PART1 – (part 2 comes later today is NOW ONLINE HERE)
I’ve been noting with some humor the anticipation of a new Arctic sea ice extent minimum in the Alarmosphere. Yesterday, the frustration that there hasn’t been any major announcement yet bubbled to the surface in the form of a Michael Mann tweet, who was upset that NSIDC is making him wait:

Today though, looking at the NSIDC extent graph, he seems happy, declaring it “official”:

NSIDC made an announcement a few minutes ago, just as I started writing this post (and for that reason I’m publishing this post in two parts, see below):
Arctic sea ice appears to have broken the 2007 record daily extent and is now the lowest in the satellite era. With two to three more weeks left in the melt season, sea ice continues to track below 2007 daily extents.
Arctic sea ice extent fell to 4.10 million square kilometers (1.58 million square miles) on August 26, 2012. This was 70,000 square kilometers (27,000 square miles) below the September 18, 2007 daily extent of 4.17 million square kilometers (1.61 million square miles).
Here’s the plot, annotation mine:

Predictably, Seth Borenstein is already practicing for the big story he’ll be writing any minute now, and, the money quote he uses is just as predictable:
Data center scientist Ted Scambos says the melt can be blamed mostly on global warming from man-made emissions of greenhouse gases.
Neither Borenstein nor NSIDC’s current announcement mentions the massive Arctic storm that broke up huge amounts of sea ice, making this new record low possible. NSIDC said on August 14th:
As of August 13, ice extent was already among the four lowest summer minimum extents in the satellite record, with about five weeks still remaining in the melt season. Sea ice extent dropped rapidly between August 4 and August 8. While this drop coincided with an intense storm over the central Arctic Ocean, it is unclear if the storm prompted the rapid ice loss.
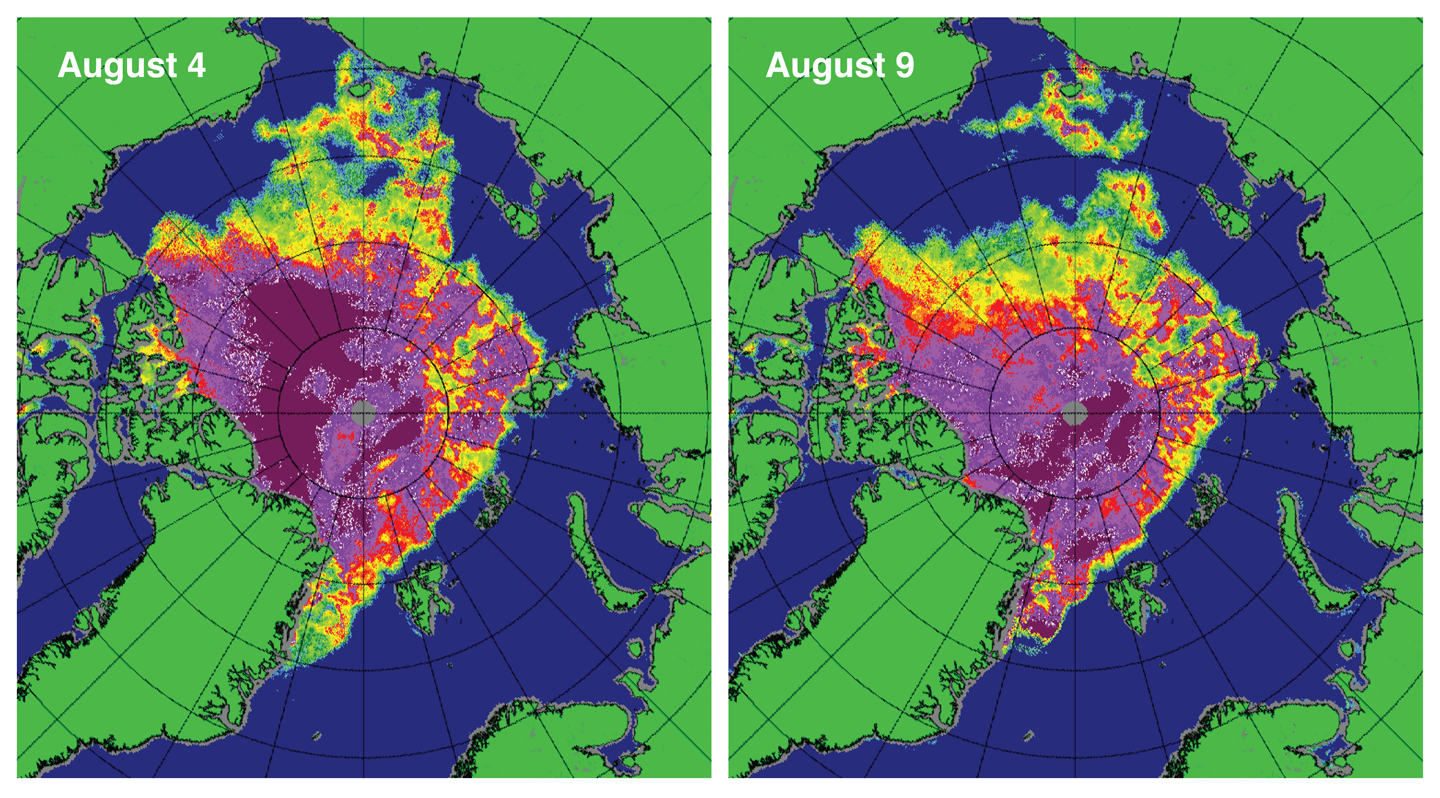
Unclear? Hmmph. Further down they dub it: “The Great Arctic Cyclone of 2012” and provide this before and after image:

Figure 4. These maps of sea ice concentration from the Special Sensor Microwave Imager/Sounder (SSMIS) passive microwave sensor highlight the very rapid loss of ice in the western Arctic (northwest of Alaska) during the strong Arctic storm. Magenta and purple colors indicate ice concentration near 100%; yellow, green, and pale blue indicate 60% to 20% ice concentration.
Credit: National Snow and Ice Data Center courtesy IUP Bremen
Calling the reason “unclear” seems more than a bit disingenuous to me, especially when you don’t mention it again.
It should be noted that in the ARCUS sea ice forecast submitted on August 5th, both NSIDC and WUWT forecasts agreed at 4.5 million sqkm. Clearly NSIDC didn’t expect this storm nor its effects, because if they had, their forecast would have been much lower.
In part two of this post, later today, I’ll share some other interesting things I’ve found that suggests NSIDC and the media aren’t telling you the full story right now.
John F. Hultquist says
I first made my comments about albedo & energy loss from an ice free Arctic ocean at least 2 years ago, closer to 5 years ago in private conversations with the late Jan Pompe.
My first hypothesising here was probably under the nick DaveE, as I said, about 2 years ago.
DaveE.
Err like I said back in July, we are poised to break the record and if we get bad weather we will crush the record.
http://wattsupwiththat.com/2012/07/03/seat-ice-news-volume-3-number-7-the-next-arcus-sea-ice-outlook-forecasting-poll-for-2012-is-online/#comment-1023687
Simply put. Given the volume of Ice in July, assuming a normal influx of heat (look at SSTs and heat flux into the arctic region), assuming a normal amount of solar radiation during the season, we were poised to set a record. The only way we could not set a record was if we got abnormal weather. The weather we got helped to beat the record that was already in the cards from day 1. Given the state of the ice ( as I explained before the storm hit ) the record which was already in the cards, was bound to get smashed.
As for this being part of a natural cycle? Yup. more heat means less ice. utterly natural.
Now, comes the question, why is it warmer? So, yes warmer weather in the long past may have melted the arctic cap to where it is now. The question is why is it warmer now.
TSI hasnt increased.. what could it be? grelims?
Lets roll tape: We can all make fun of Zwally. Check out what other folks said.
http://wattsupwiththat.com/2012/08/04/sea-ice-news-volume-3-number-9/#comment-1052637
Heres someone who said the ice wasnt thin.
http://wattsupwiththat.com/2012/08/04/sea-ice-news-volume-3-number-9/#comment-1052752
here is somebody who thinks the storm wasnt that rare.
http://wattsupwiththat.com/2012/08/04/sea-ice-news-volume-3-number-9/#comment-1052815
here is somebody who thinks that falling below 4M km is not likely.
http://wattsupwiththat.com/2012/08/04/sea-ice-news-volume-3-number-9/#comment-1052842
here is jeez.. betting
http://wattsupwiththat.com/2012/08/04/sea-ice-news-volume-3-number-9/#comment-1052961
here is bill again calling the storm normal.. thats ok. I like that logic. normal storm rips up the ice. not so normal.
http://wattsupwiththat.com/2012/08/04/sea-ice-news-volume-3-number-9/#comment-1053138
Soot makes a return. It was the soot that dun it! err. not in past I suspect.
http://wattsupwiththat.com/2012/08/04/sea-ice-news-volume-3-number-9/#comment-1053461
Watch volume. as the volume goes, so goes the ice. If the same volume spreads out to the same extent.. watch out, you will be in for surprises if normal or abnormal weather hits.
you will know you’re a fake skeptic if you try to struggle with the fact of their being less ice in the arctic. You will know your are struggling with that fact if you.
1. start to question every metric you’ve relied on in the past.
2. change the topic to the south pole.
3. Blame things that cant melt ice ( like wind). heat melts ice.
4. search around feverishly for one chart that supports your position.
5. Forget your own mistakes and focus on others.
A real skeptic would shrug his shoulders and say.. “Sure there is less ice, sure warmer temps plays a role, but we have no knowledge about why its warmer” That’s at least a defensible position. No knowledge is a standard skeptical position. But if you find yourself twisting and turning to reject the fact that there is less ice, well then..you might want to consider.. what would you say if there was zero ice. You better think about that argument because you’ll have to make it in the not too distant future.
Frederick Michael says:
August 27, 2012 at 10:35 am
“I think we’re missing Walt’s point here. We cannot say with any confidence that without the storm the new low would not have occurred. Given the trend, a new low is pretty much inevitable.
The trend is LINEAR,”
The satellite era trend is plausibly linear but that is over a short duration. The linear decline does not look so convincing if the years 1973 to 1979 as shown IPCC FAR WG1 are added to the chart. In this chart, 1974 appears to be at least 1.6 million km2 below the 1979 peak extent. Hardly the stuff of a linear trend. At least NSIDC qualifies the announce as lowest of the satellite era though they never extend the qualification by mentioning that the starting date 1979 was a local peak in Arctic ice extent with periods of lesser extent evident prior to that starting date.
Smokey says:
August 27, 2012 at 11:27 am
‘undeniable’ evidence
—————————–
If we had undeniable evidence this debate would not be happening. Statistical information such as 95% conficdence limits gives us some idea of the reliability of our measurements and laboratory studies and models can help us understand the process behind them.
Once we go back beyond the time periods covered by our measurement record we have to use proxies, anecdote and other less reliable information.
In science peer review and replication act as quality checks, which is why peer-reviewed papers tend to be taken more seriously (and why Watts.2012 will need to pass peer review). Cheating usually shows up because it fails to fit in with later work by others.
For non-specialists, it comes down to making what independant checks we can, and to the settings on our own B.S. filters.
I’m not going to start worrying until the same thing starts happening to the Antarctic sea ice. Until then, it’s not part of a global phenomenon, it’s merely an interesting local one.
Julienne Stroeve says:
August 27, 2012 at 11:26 am
…………..
Your paper is beyond ‘pay wall’, not all of us are AGU members.
I am puzzled by your claim :
Pointing to strong impacts of internal climate variability, 16% of the ensemble member trends over the satellite era are statistically indistinguishable from zero. (abstract)
Natural variability would suggest at least 3 years and possible up to one more decade of low Arctic summer ice coverage. I base this on study of the North Atlantic SST
http://www.vukcevic.talktalk.net/Sun-Earth.htm
Perhaps I am expecting too much of you to make the paper available, but it wouldn’t be unreasonable to ask for expand on the ‘natural variability-anthropogenic factor’ ratio.
Smokey says:
August 27, 2012 at 11:37 am
Julienne, if you also look at the temperature anomalies in the Antarctic since 1957, you will find they are anomalously cold in all seasons.
———————————-
This is why you are not taken seriously, Smokey. The data are avaliable, here for example.
Browse among the data for a while and then bring us back something to convince us that you are correct
Entropic,
I posted a chart that is based on raw temperature data. The fact that you wish to reject it indicates a closed mind.
Steven Mosher says:
August 27, 2012 at 11:41 am
Good post up until the last sentences.
Mosher says:
“what would you say if there was zero ice. You better think about that argument because you’ll have to make it in the not too distant future.”
If Mosher were a “real skeptic” he would not display 100% confidence in the linear death spiral meme. The satellite era is just too short to rate 100% confidence in such predictions even where one presumes AGW.
CRS, Dr.P.H. says:
August 27, 2012 at 9:17 am
Just noticed the “Death Spiral” myself! Anthony, you said:
Neither Borenstein nor NSIDC’s current announcement mentions the massive Arctic storm that broke up huge amounts of sea ice, making this new record low possible.
======================================================
http://news.yahoo.com/arctic-ice-melts-record-low-us-researchers-171243395.html
“Mark Serreze, director of the center, said that the record was all the more striking as 2007 had near perfect patterns for melting ice, but that the weather this year was unremarkable other than a storm in early August.
“The ice is so thin and weak now, it doesn’t matter how the winds blow,” Serreze said in the statement.”
The ice is sooooooooooooooooooooooooooooo thin and weak…….
Let’s feed the ice !!!!!
Steven Mosher says:
August 27, 2012 at 11:41 am
The question is why is it warmer now.
TSI hasnt increased.. what could it be? grelims?
No ‘grelims’ Steven, too cold up there for them.
It is very simple, as I outlined in my post at
http://wattsupwiththat.com/2012/08/27/sea-ice-news-volume-3-number-10-part-1-new-arctic-extent-record/#comment-1065927
I suspect you wouldn’t bother with it.
However, I invite you to look at the bottom graph here:
http://www.vukcevic.talktalk.net/Sun-Earth1.htm
.
Why the silence on the new IMS ice data which shows 2012 ice melt unremarkable and still way above the 2007 low? (See WUWT sea ice page).
There is a HUGE discrepancy between the new IMS (International multi-sensor) Arctic ice trace and all the others i.e. IARC-JAXA, Norsex and DMI. These others all show arctic ice in free-fall below 2007 levels, well into record territory, while IMS shows 2012 ice to be within the pack similar to the last 6-7 years, albeit today at the bottom of the range. But still way above the 2007 minimum.
Which is right? Or are criteria different? In previous years the arch-warmist RGates was always saying “wait till we have the IMS – this will give us the true picture”.
tomwys says:
August 27, 2012 at 9:11 am
An open Arctic Ocean means more moisture availability for the Polar Easterlies!!!
Watch for more “Ocean-Effect” snow to add to Greenland’s snow/ice depth, wiping out the “loss” from the brief early August “melt” so eagerly pounced upon by the AGW crowd!
____________________________________
I was thinking the same thing.
Anchorage Alaska had record snows last winter and the snow was not melting out.
It would be ironic if thanks to this “Ice Free” Arctic we get a polar express jet stream locked in place, and the USA gets blasted with severe cold and snow the first week of November.
I am in mid NC and it was a chilly 64F (18c) last night and 59F (15C) the night before. August is supposed to be HOT.
vukcevic, if you email me at stroeve at nsidc.org I will send you a copy of the paper.
[Address edited to avoid automated spam seekers. Robt]
Steven Mosher says:
“A real skeptic would shrug his shoulders and say… ‘Sure there is less ice, sure warmer temps plays a role, but we have no knowledge about why its warmer’.”
I think that is what most of us here are saying. The planet is still emerging from the Little Ice Age, but we don’t know all the reasons why, or why the LIA occurred in the first place. It was one of the coldest times of the entire Holocene. Why? We are not certain why.
The actual error is on the side of the climate alarmist crowd, which assumes that human activities are causing global warming. The fact that they have no scientific evidence to support their assumption seems to be irrelevant to them. Thus, their belief is no different than a belief in witch doctor juju. They cannot explain it, and they have no evidence for it. They simply believe it.
Julienne Stroeve says:
August 27, 2012 at 11:23 am
“Anthony, you probably understand that when the ice cover is thicker, storms like what happened this August, or the summer dipole anomaly may cause a change in ice volume, but it won’t be reflected in a change in ice extent (and actually storms tended to have the opposite affect on the ice extent – they would actually increase the ice extent). That is the point you seem to be missing. For a thinner ice cover, the same storm, or the same dipole anomaly pattern will not only translate into a loss of ice volume, but also a loss of ice extent.”
Well, at least you are willing to address the matter of storms. But you are unwilling to address the particulars of the storm in question. Everything you assert in this paragraph amounts to no more than a rule of thumb. I must say that you, too, lack all instinct for the empirical. Have you done some research on the facts of this particular storm? If so, I do wish that you would share them.
Is there a plotting issue again? I seem to remember that 2012 was much closer to average at one point this spring. Now it appears to be nowhere near the average.
Hi Anthony,
Since you are blaming the record ice loss in the arctic sea, to the storm.
Can you please answer and me this simple question : How did a “tropical cyclone” end up in the Arctic Sea in the first place?
Roger Harrabin on the BBC news:
Consider geo-engineering e.g. spaying the Arctic atmosphere with ‘particles’ …..
Theo, we don’t have the data/analysis in at this point to say exactly what the storm did (i.e. what sizes of floes did it break the ice-pack up into, what were the SSTs, how far were the ice floes transported, how much thick the ice was when it was broken up, how much melt happened as the ice pack spread out, etc. etc. What we do know is that the winter ice was thinner than last winter (from Cryosat) and that immediately after the storm, ice concentrations were already low in that region prior to the storm, and SSTs were colder than normal immediately after the storm, with warm water below. Then the SSTs increased later in the month.
I can’t quite understand the desire to ignore the fact that the ice is thin and prone to melting out. If you remember, 2002 was dominated by cyclones all summer. So why didn’t all those storms result in ice extent below 5 million sq-km?
What’s worse is that I wasn’t up there to make a margarita out of that slushy ice. Hell, it even came with salt. What’s not to like?
I see Mosher trolling in the comment threads again. Sorry Steve, if heat is causing the Arctic to melt, then the Antarctic should also be melting. The fact is we can’t account for this change. In any case, there’s no evidence to suggest that the loss of the sea ice pack will be anything but beneficial. If it is an indication of a permanent shift towards ice-free summers, this will be a boon to the shipping industry, reducing fuel costs (and emissions) by decreasing travel distances. It will also open up the sea floor to oil and gas exploration and mineral extraction.
The big melt this year occurred in 3 waves. The first in late-April, the second in early-June and then in early August when the storm hit lasting until today really.
The melt rate appears to be going back to average.now but these 3 big abnormally long melt periods are the reason the sea ice is so low.
Daily melt rate versus the average for Jaxa and NSIDC.
http://s18.postimage.org/h817h2e4p/NH_SIE_Daily_Ch_Aug26_12.png
Suffer no fools.
The ice extend graph is not very consistent with the Mean Temperature above 80°N graph showing constant below zero temperatures and also the webcams showing refreezing for a while…