PART1 – (part 2 comes later today is NOW ONLINE HERE)
I’ve been noting with some humor the anticipation of a new Arctic sea ice extent minimum in the Alarmosphere. Yesterday, the frustration that there hasn’t been any major announcement yet bubbled to the surface in the form of a Michael Mann tweet, who was upset that NSIDC is making him wait:

Today though, looking at the NSIDC extent graph, he seems happy, declaring it “official”:

NSIDC made an announcement a few minutes ago, just as I started writing this post (and for that reason I’m publishing this post in two parts, see below):
Arctic sea ice appears to have broken the 2007 record daily extent and is now the lowest in the satellite era. With two to three more weeks left in the melt season, sea ice continues to track below 2007 daily extents.
Arctic sea ice extent fell to 4.10 million square kilometers (1.58 million square miles) on August 26, 2012. This was 70,000 square kilometers (27,000 square miles) below the September 18, 2007 daily extent of 4.17 million square kilometers (1.61 million square miles).
Here’s the plot, annotation mine:

Predictably, Seth Borenstein is already practicing for the big story he’ll be writing any minute now, and, the money quote he uses is just as predictable:
Data center scientist Ted Scambos says the melt can be blamed mostly on global warming from man-made emissions of greenhouse gases.
Neither Borenstein nor NSIDC’s current announcement mentions the massive Arctic storm that broke up huge amounts of sea ice, making this new record low possible. NSIDC said on August 14th:
As of August 13, ice extent was already among the four lowest summer minimum extents in the satellite record, with about five weeks still remaining in the melt season. Sea ice extent dropped rapidly between August 4 and August 8. While this drop coincided with an intense storm over the central Arctic Ocean, it is unclear if the storm prompted the rapid ice loss.
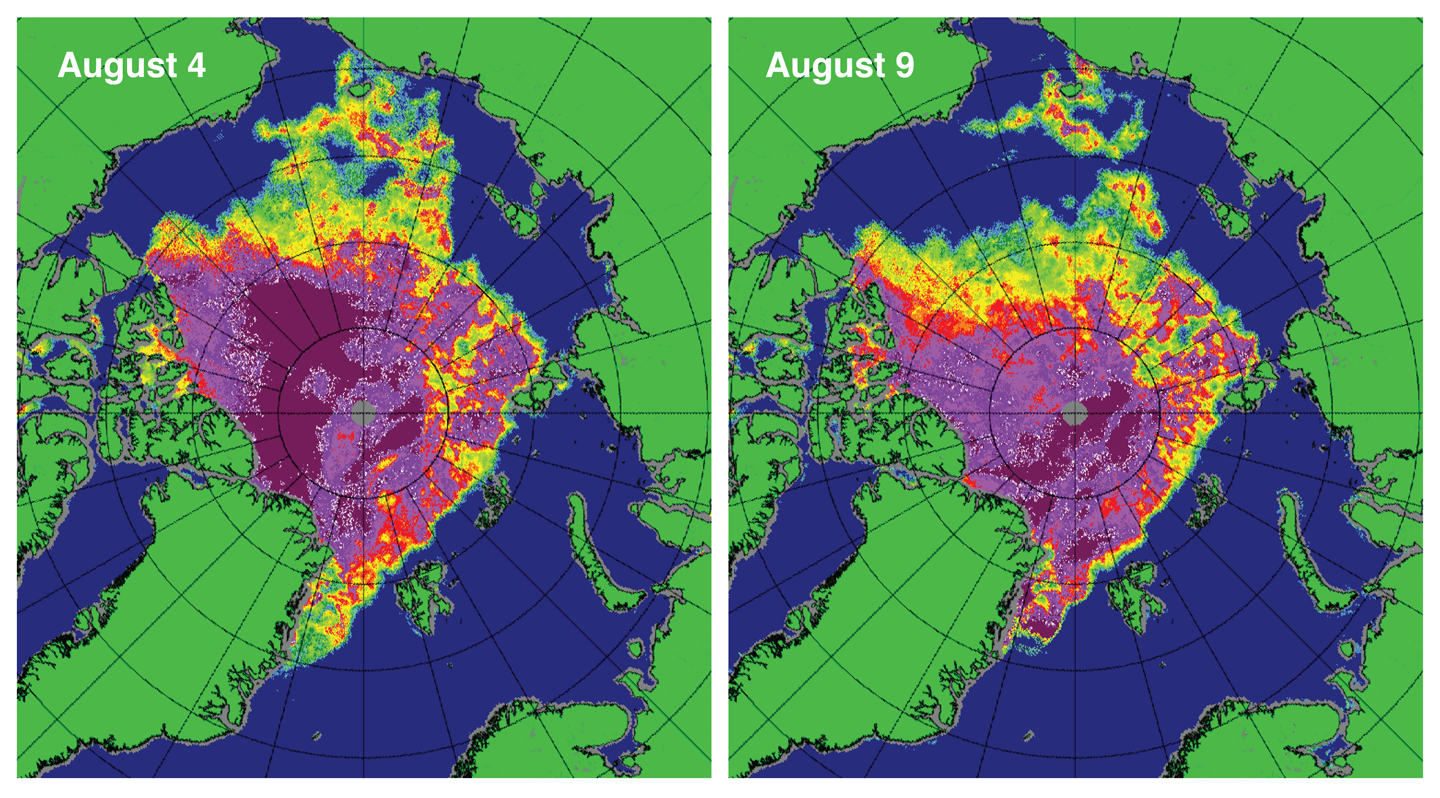
Unclear? Hmmph. Further down they dub it: “The Great Arctic Cyclone of 2012” and provide this before and after image:

Figure 4. These maps of sea ice concentration from the Special Sensor Microwave Imager/Sounder (SSMIS) passive microwave sensor highlight the very rapid loss of ice in the western Arctic (northwest of Alaska) during the strong Arctic storm. Magenta and purple colors indicate ice concentration near 100%; yellow, green, and pale blue indicate 60% to 20% ice concentration.
Credit: National Snow and Ice Data Center courtesy IUP Bremen
Calling the reason “unclear” seems more than a bit disingenuous to me, especially when you don’t mention it again.
It should be noted that in the ARCUS sea ice forecast submitted on August 5th, both NSIDC and WUWT forecasts agreed at 4.5 million sqkm. Clearly NSIDC didn’t expect this storm nor its effects, because if they had, their forecast would have been much lower.
In part two of this post, later today, I’ll share some other interesting things I’ve found that suggests NSIDC and the media aren’t telling you the full story right now.
JohnB says:
August 27, 2012 at 9:56 am
——————-
“Anthony, what evidence would that be?”
Oh please! This has been discussed so much your implication that there is no evidence is laughable. Start reading with the year 1817 and work your way to now. That 1817 date is 2 years after Waterloo so maybe the melting can be related to the battle – you know, all the big tanks, Humvees, and SUVs burning oil. Maybe not. Edwin Drake’s oil well didn’t come along until 1859. Sort of rules oil out.
Start here:
http://www.john-daly.com/polar/arctic.htm
Paper finds Arctic sea ice extent 8,000 years ago was less than half of the ‘record’ low 2007 level
A paper published in Science finds summer Arctic Sea Ice extent during the Holocene Thermal Maximum 8,000 years ago was “less than half of the record low 2007 level.” The paper finds a “general buildup of sea ice from ~ 6,000 years before the present” which reached a maximum during the Little Ice Age and “attained its present (year 2000) extent at 4,000 years before the present”
http://hockeyschtick.blogspot.com/2012/08/paper-finds-arctic-sea-ice-extent-8000.html
Smokey says: August, 2012 at 10:03
“It has occurred even in the 20th Century [the 1920’s and the 1960’s] and is documented in Royal Navy observations in the 1800′s. Why would the current cycle be anything but natural?”
So Smokey, are you suggesting that this low sea ice extent happened before in the 1920s and in the 1960s? Can you show us the undeniable evidence for that claim please that sea ice extent was just what it is right now in those years.
Scientific evidence please so that I can verify it myself. Not blogs. You are asking (sorry … demanding is a better word here) the same of Julienne Stroeve.
melt baby melt
I think we’re missing Walt’s point here. We cannot say with any confidence that without the storm the new low would not have occurred. Given the trend, a new low is pretty much inevitable.
The trend is LINEAR, just like everything else (e.g., global mean temp and global mean sea level). This is both a strong argument that the globe is warming and a strong argument that it’s not a catastrophe.
The data supports a moderate skeptical position. We should be happy with that and play our hand accordingly.
The ice looked very sparse this spring and many folks back then were concerned that we were set to break the record this year. If we make enough over-the-top arguments, this kind of news can be turned into a defeat for the skeptics position.
So, we’re saying it’s just one storm that made all that ice melt? If that type of storm had hit 30 years ago, would all the ice have melted then, too?
REPLY: Never trust a statement that begins with “So,….” as you know it is disingenuous.
No, we are saying this storm exacerbated the melt underway. And since such things weren’t tracked over 30 years ago, nobody can say with certainty that this is an unprecedented event. Really the conceit that we understand the Arctic and planetary cycles from 30 years of satellite data is laughable.
Have a look at this recent paper: http://hockeyschtick.blogspot.com/2012/08/paper-finds-arctic-sea-ice-extent-8000.html
– Anthony
The BBC are hyping it up as usual. “Could be all gone by next year.. could cause huge releases of methane… which could add to an already overheating planet… 70% definitely caused by humans…” on and on… “Garmany calling, Garmany calling… “
David A. Evans says:
August 27, 2012 at 9:41 am
First, I agree with you about Walt Meier’s openness – in general though, others there and their trustworthness is hard to evaluate – except for one or two others, do names come to mind? Mostly not, but I assume most folks there try to do an honest day’s work.
——————————————————-
On the following blog . . .
http://notrickszone.com/2012/08/25/genius-taz-leftist-paper-arctic-sea-ice-now-600000-sq-km-less-than-2007/#comments
. . . I made a similar statement to your’s about lack of ice (on the Arctic Ocean) being a negative influence on temperature in the N. H.:
I said:
My take on the low ice cover on the Arctic Ocean is this allows for more rapid heat loss from the water to the atmosphere and space. Albedo is high with a small sun angle and a decreasing one as that area transitions to a no-sun winter. TAZ type folks keep telling us the atmosphere (because of a rising CO2 concentration) should be warming rapidly. That seems to have stalled and corresponds time-wise with the lower ice minimums of the last decade or so. If I were a conspiracy type, I would be asking who is paying “climate scientists” to NOT investigate the connection between these two variables.
This old earth was created to die and be destroyed, we are at the end of the life giving cycle. Ever think of that? It’s just as accurate as “it’s been here billions of years and man is destroying it.”
What’s holding back release of ice-extent-estimates based on the pre-1979 military satellites? (Along with sample photos of extremes from that range.)
is this a joke?
That ice was going to melt anyway because it was already at very low concentration as the NSIDC explain in the previous report.
John F. Hultquist says:
August 27, 2012 at 10:29 am
JohnB says:
August 27, 2012 at 9:56 am
——————-
“Anthony, what evidence would that be?”
Oh please! This has been discussed so much your implication that there is no evidence is laughable. Start reading with the year 1817 and work your way to now. That 1817 date is 2 years after Waterloo so maybe the melting can be related to the battle – you know, all the big tanks, Humvees, and SUVs burning oil. Maybe not. Edwin Drake’s oil well didn’t come along until 1859. Sort of rules oil out.
Start here:
http://www.john-daly.com/polar/arctic.htm
————————
I started there, and found: “useful data on ice extent and thickness only dates from the 1950s”
Frederick Michael says:
August 27, 2012 at 10:35 am
Using words that an empiricist might use, you continue to counsel that we ignore this huge recent change in the Arctic, the cyclone. You are counseling that we ignore part of the data. Can you not see what you are doing?
Do not be fooled by a false dichotomy. The question is not cyclone versus radiation driven melt. There are many facts to be explained and the cyclone is just one of them. But to ignore it is to ignore facts and to ignore what might be crucial evidence.
Julienne, can you please cut to the chase here and just answer a simple question? Are you saying we’re supposed to still be in the same climate that we had in the 1960’s and 1970’s?
It seems you all are just beating around this bush but not saying the words. You keep comparing today’s climate to that period through alarming announcements of diminishing sea-ice extent Are we supposed to be in that climate again? Did man alter that pristine cooler 1970’s climate forcing our moderately warmer current climate? Do you believe that humans have brought an abrupt stop the natural cool and warm and cool and warm cycles locking us into a permanent warming? Have we ruined the chances for another Little Ice Age?
I’ve heard some whoppers in my many years but these last two really take the cake … (1) That this past July was the hottest in all history (anyone not born yesterday knows better), and (2) That CO2 is behind the melting of Arctic sea-ice (but somehow ignores every place else!). Where were you 4 months ago when extent hit the long term average (and probably exceeded it but for a suspicious satellite problem once again). Did the CO2 concentration drop 4 months ago and suddenly return to normal at the solstice? Do you in fact believe in whoppers (1) and (2)? Serious question.
BTW, you must know full well that many uneducated people are being tricked by this since they start to believe that permanent ice is gone, not bi-annual water freezing and thawing as it always does when the axial tilt is aiming away from the sun. There are two insidious propaganda angles to this climate pseudo-science seen spread by kooks like Joe Romm, and it looks bad when people like you let it stand. You should be countering their garbage by pointing out that all of the so-called melting in the Arctic is the same water that freezes and thaws annually, and also that nothing about sea-ice affects sea-level. Both these things get confused in the general publics’ mind, and I suspect that Serreze is just fine with that. Are you?
Julienne Stroeve says:
August 27, 2012 at 10:08 am
REPLY: Thanks Walt, have you ever considered we may be at/near the bottom of a natural cycle? How can you rule that out without data much beyond 30 years? There’s historical anecdotal evidence of very low Arctic sea ice in the past where you have no data. – Anthony
Anthony, we can also go back somewhat reliably until 1953, so are you suggesting that we may be at the bottom of a 60-year cycle? Or longer?
——————-
Longer than 60 years, if we are seeing a cycle. A 60 year cycle would show a minimum in the early 1950s. The data we have shows the 1950s and 1960s as maintaining a fairly uniform high level of ice extent, then starting a long term decline in the 1970s.
http://nsidc.org/icelights/files/2010/11/mean_anomaly_1953-2010.png
Regarding the pre-measurement historical record we see a possibility of warmer conditions for the Vikings in the MWP(a 1000 year cycle?) The 1800s consist mostly of optimistic anecdotes by the likes of Parry and Franklin, designed to encourage the Admiralty to keep looking for the North West Passage.
george e smith says:
August 27, 2012 at 10:13 am
Walt is using the false dichotomy of cyclone or radiation melt in his response to Anthony. He fails to address part of the facts to be explained, the recent cyclone and its effects on Arctic ice.
Julienne Strove (or whoever is pretending to be her) says:
Anthony, we can also go back somewhat reliably until 1953…
Julienne, I’m curious. What data collected before the satellite era does the NSIDC consider somewhat reliable?
Also, everyone please be courteous to Dr. Meier. We may not always agree with him, but he has always been a stand-up guy here on WUWT.
REPLY: there’s no pretending, that is actually her – Anthony
Regarding my earlier comment
I recall at the time many of the true deniers saying the reports were a spoof, and they based this on the name of the reporter, one Harold Denny which they took as a variation of deny!
Denny was actually a renowned reporter in the ’30s and many of us found the reports quickly and then linked. The report has since disappeared behind a paywall, I wonder why?
I think Mary Hinge, (The nick is based on a Spoonerism of an old joke,) was one of the disparaging commentators. Not seen Mary for some time.
Would be interesting to know how much of this year’s melt was due to the warm water from the 2010 el nino event finally making its way to the Arctic.
I found these two links a day or two back. The first describes a gradual reduction in the amount of cold water accumulating on the Antarctic sea bed (the AABW). The second describes a possible link between reduced AABW and superwarming episodes in the Arctic during past interglacials. These reached temperatures several degrees above current levels.
Whether caused by natural variation, or triggered by cAGW, consider the hypothesis that we are moving into a superwarming episode.
http://www.noaanews.noaa.gov/stories2012/20120320_antarcticbottomwater.html
http://www.dailykos.com/story/2012/06/22/1102148/-Shocking-Interglacial-Shift-to-Hot-Arctic-Tied-to-Rapid-Antarctic-Ice-Melt
Louis Hooffstetter says:
August 27, 2012 at 11:08 am
Julienne Strove (or whoever is pretending to be her) says:
Anthony, we can also go back somewhat reliably until 1953…
Julienne, I’m curious. What data collected before the satellite era does the NSIDC consider somewhat reliable?
————————-
Here it is again.
http://nsidc.org/icelights/files/2010/11/mean_anomaly_1953-2010.png
Anthony, you probably understand that when the ice cover is thicker, storms like what happened this August, or the summer dipole anomaly may cause a change in ice volume, but it won’t be reflected in a change in ice extent (and actually storms tended to have the opposite affect on the ice extent – they would actually increase the ice extent). That is the point you seem to be missing. For a thinner ice cover, the same storm, or the same dipole anomaly pattern will not only translate into a loss of ice volume, but also a loss of ice extent.
Blade, our report is based on the modern passive microwave record which is the most consistent data record out there. We can also go back somewhat reliably to 1953, and efforts have been made to go back to 1900 and in all those efforts the last few summers have had the lowest extents. Also, the winter ice cover will come back like it always does, and there is little correlation between winter extent and summer extent. Even if the winter extent is about normal, the ice that forms in winter is first-year ice that tends to be about 1.5m thick, and a large part of that will melt in summer. The thickness of the winter ice on the other hand is a factor behind what the summer extent will be. So if you are transitioning towards more first-year ice and less multiyear ice (which is what these large ice losses in summer are resulting in), then you will continue to have summers with less sea ice. If you also look at the temperature anomalies in the Arctic over the last decade you will find they are anomalously warm in all seasons. You also find the melt season happens earlier and ends later, which in turn helps to enhance the ice-albedo feedback. It doesn’t surprise me in the least that this summer became a new record low given the climate patterns over the last several years.
Louis, the data set I’m referring to was developed by Chapman and Walsh, and is part of the Had1SST data set. Several publications have referenced that data set, including our recent one I linked to earlier in GRL.
Robbie says:
“…are you suggesting that this low sea ice extent happened before in the 1920s and in the 1960s? Can you show us the undeniable evidence for that claim please that sea ice extent was just what it is right now in those years.”
Sorry, I can’t provide ‘undeniable’ evidence, because you will just reject it as being a lot of inconvenient observations.
Julienne Stroeve says:
“If you also look at the temperature anomalies in the Arctic over the last decade you will find they are anomalously warm in all seasons.”
Julienne, if you also look at the temperature anomalies in the Antarctic since 1957, you will find they are anomalously cold in all seasons.
When discussing global warming, regions such as the Arctic are only a part of the big picture.