Guest Post by David Middleton
“Satellites See Unprecedented Greenland Ice Sheet Surface Melt… Right On Time”

I guess Professor Tedesco missed this…
“Ice cores from Summit show that melting events of this type occur about once every 150 years on average. With the last one happening in 1889, this event is right on time,” says Lora Koenig, a Goddard glaciologist and a member of the research team analyzing the satellite data.
How can an ice sheet surface melt be both “unprecedented” and “right on time”?
It can’t. However, nothing is impossible when you combine govt bureaucrats and the junk science of anthropogenic global warming…

Satellites See Unprecedented Greenland Ice Sheet Surface Melt
07.24.12
For several days this month, Greenland’s surface ice cover melted over a larger area than at any time in more than 30 years of satellite observations. Nearly the entire ice cover of Greenland, from its thin, low-lying coastal edges to its two-mile-thick center, experienced some degree of melting at its surface, according to measurements from three independent satellites analyzed by NASA and university scientists.
[…]
“Ice cores from Summit show that melting events of this type occur about once every 150 years on average. With the last one happening in 1889, this event is right on time,” says Lora Koenig, a Goddard glaciologist and a member of the research team analyzing the satellite data. “But if we continue to observe melting events like this in upcoming years, it will be worrisome.”
[…]
Summit Station’s summer peak temperatures flirted with 0°C for a few hours in late July.

Hence the somewhat unusual wide-spread, right-on-time melt.
This melt shows up very clearly in the Greenland Ice Sheet Albedo…

The “normal” summer melt season albedo minimum at 2500-3200m is in the range of 0.79-0.82. This year, it briefly dropped to just below 0.74.

“Normal” is based on 12 years of data. The GRACE measurements upon which the accelerating ice loss claims are based are heavily dependent on the Glacial Isostatic Adjustment (GIA). While not as large as Antarctica (where the GIA’s margin of error is nearly as large as the asserted ice loss), GIA variations can result in totally different ice loss values… And the GRACE time series isn’t any longer than the MODIS time series.
Wu et al., 2010 determined that the GIA commonly assumed for Greenland was way too high and that the 2002-2008 ice loss rate was 104 Gt/yr rather than the oft cited 230 Gt/yr. Even at 230 Gt/yr, it would take 1,000 years for Greenland to lose 5% of its ice mass.
Riva et al., 2007 concluded that the ice mass-loss rate in Antarctica from 2002-2007 could have been anywhere from zero-point-zero Gt/yr up to 120 Gt/yr. Dr. Riva recently co-authored a paper in GRL (Thomas et al., 2011) which concluded that GPS observations suggest “that modeled or empirical GIA uplift signals are often over-estimated” and that “the spatial pattern of secular ice mass change derived from Gravity Recovery and Climate Experiment (GRACE) data and GIA models may be unreliable, and that several recent secular Antarctic ice mass loss estimates are systematically biased, mainly too high.”
So… We have barely a decade’s worth of data and no idea if the modern melt rates and albedo changes are anomalous relative to the early 20th century Arctic warming, Medieval Warm Period or any of the other millennial-scale Holocene warming periods.
I’m gonna go out on a limb and say that unless some alarmist can tell me what the albedo was in 1899, 1127, 1143 and 1939, during the vast majority of the Holocene or during the Sangamonian, my response is, “Very interesting. Now, move along, there’s nothing more to see here.”

http://wattsupwiththat.com/2011/09/29/warming-island-greenland-sea-regional-climate-and-arctic-sea-ice-reconstruction/

(After Alley, 2000)

(NGRIP)
Manhattan-sized Icebergs!!!

(MSNBC)
Manhattan-sized Icebergs are insignificant relative to Greenland-sized ice sheets.
- Manhattan: 34 square miles.
- Greenland ice sheet: 660,235 square miles.
Manhattan = 0.005% of Greenland ice sheet. 99.995% of the Greenland ice sheet did not participate in this event.
If one Manhattan-sized chunk of ice calved into the ocean every year and there was no snow accumulation in Greenland for 1,000 years, Greenland would lose 5% of its ice sheet.

(Wikipedia and Google Earth)

(Climate4you)
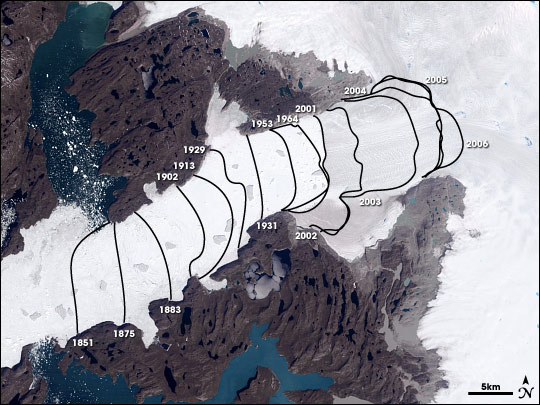
This is a Google Earth photo of Jakobshavn Isbrae, Greenland’s largest outlet glacier…The red lines represent the calving front’s retreat from 1851-1942.If the calving front retreated almost 20 km over that 90-yr period and Greenland’s ice sheet is supposedly vanishing (according to the Warmists), why does the Google Earth image show so much ice downstream of the calving front?
Surely if Jakobshavn Isbrae’s calving front retreated by nearly 20 km before SUV’s, it must have retreated much more than 20 km farther upstream that the 1942 front by now… Right?
(Wikipedia)
It appears to have only retreated by a bit more than 10 km since 1942… But, why is there still so much ice downstream of the calving front? If the Greenland ice sheet is disappearing, surely that must be open ocean… erm… open fjord by now… Right?
All that moving around of the calving front and all that lack of disappearing ice might lead someone to think that glaciers are rather dynamic…
Jakobshavn Isbrae – Greenland Glacier Has Always Changed With The Climate
By News Staff | July 16th 2011
New research on Jakobshavn Isbrae, a tongue of ice extending out to sea from Greenland’s west coast, shows that large, marine-calving glaciers don’t just shrink rapidly in response to global warming, they also grow at a remarkable pace during periods of global cooling. *Glaciers change.
[…]
Jakobshavn Isbrae has been the focus of intense scientific interest because it is one of the world’s fastest-flowing glaciers, releasing enormous quantities of Greenland’s ice into the ocean. It is believed that changes in the rate at which icebergs calve off from the glacier could influence global sea level rise. The decline of Jakobshavn Isbrae between 1850 and 2010 has been documented, mostly recently through aerial photographs and satellite photographs.
“We know that Jakobshavn Isbrae has retreated at this incredible rate in recent years, and our study suggests that it advanced that fast, also,” said Jason Briner, the associate professor of geology at the University of Buffalo, who led the research. “Our results support growing evidence that calving glaciers are particularly sensitive to climate change.”
[…]

(Wikipedia and Google Earth)
“Our results support growing evidence that calving glaciers are particularly sensitive to climate change.”Greenland’s climate is always changing… Always has and always will change… And the climate changes observed over the last few decades are not unprecedented. The Greenland ice sheet is no more disappearing this year than it was last year and it is physically impossible for the ice sheet to “collapse” into the ocean.
Entropic says:
“Can give me your world view in a similar way, in about the same detail, with an idea of the mechanisms you think are controlling the system and some numbers. (Specifics please, not vague generalisations like natural variation.)” And: “I’m not getting any closer to finding out what a sceptic consensus on the science looks at.” And: “…or to Smokey who does not regard it as a greenhouse gas at all?”
First, Entropic cannot find a comment of mine that states that CO2 is not a GHG. That is because Entropic suffers from confirmation bias, and sees what he wants to see, whether it’s there or not.
And it appears that the scientific method cannot penetrate the E-man’s skull. I’ll try one more time, so listen up, Entropic: scientific skeptics [the only honest kind of scientists] have nothing to prove. The onus is entirely on those arguing the failed CO2=CAGW conjecture. Instead, they always try to shift the burden off of themselves, and onto scientific skeptics who are simply questioning their evidence-free belief system.
But the scientific method does not work that way. YOU have to convince US, using testable scientific evidence. Since you lack any such evidence, you try to shift the burden onto skeptics to, in effect, try and prove a negative. But that dog won’t hunt here on the internet’s “Best science” site. It is the CAGW crowd that must produce testable evidence, and they have failed.
CO2 may be a GHG, but its effect is so small that it is literally unmeasurable. Practitioners of the scientific method would see that their conjecture has fallen apart for lack of any evidence, and try to re-formulate a new conjecture that fits the evidence and raw data. But not the alarmist crowd. They want to “adjust” the evidence to fit their failed conjecture. Climate alarmists are to science as astrologers are to astronomy.
Smokey says:
August 19, 2012 at 1:29 pm
Entropic presumes far too much based on zero scientific evidence. Any effect from human emitted CO2 is too small to measure. And of course, from years to hundreds of millennia, rises in CO2 have always followed rises in temperature, not vice-versa.
And where’s that global warming, anyway?
__________________________________
Rather than cherrypicking one graph which shows what you want from the SSMI data , I thought I’d include all four decadal trend maps and let people decide for themselves what is happening.
http://www.ssmi.com/msu/msu_data_monthly.html?type=trend&channel=tlt
http://www.ssmi.com/msu/msu_data_monthly.html?type=trend&channel=tmt
http://www.ssmi.com/msu/msu_data_monthly.html?type=trend&channel=tts
http://www.ssmi.com/msu/msu_data_monthly.html?type=trend&channel=tls
To quote from the SSMI website:-
Globally averaged trends computed over latitudes from 82.5S to 82.5N (70S to 82.5N for channel TLT) are shown in the table below, and include data through July, 2012:
___________Start Time______Stop Time______# Years______Global Trend
Channel TLT__1979__________2012-07________ 30+_______0.133 K/decade
Channel TMT__1979__________2012-07________30+_______0.078 K/decade
Channel TTS__1987__________2012-07________22+_______-0.011 K/decade
Channel TLS__1979__________2012-07________30+_______-0.301 K/decade
Smokey says:
August 19, 2012 at 2:05 pm
“Entropic cannot find a comment of mine that states that CO2 is not a GHG.”
“CO2 may be a GHG, but its effect is so small that it is literally unmeasurable.”
——————————
I think you just provided question and answer together. A GHG whose “effect is so small that it is literally unmeasurable” is not a GHG.
Smokey says:
August 19, 2012 at 1:29 pm
“And where’s that global warming, anyway?”
—————————————
Rather than cherrypicking one channel from SSMI, which shows the trend you want, I thought I would give all four and let people make up their own minds. Remember that these maps exclude the high Arctic and the Antarctic plateau.
http://www.ssmi.com/msu/msu_data_monthly.html?type=trend&channel=tlt
http://www.ssmi.com/msu/msu_data_monthly.html?type=trend&channel=tmt
http://www.ssmi.com/msu/msu_data_monthly.html?type=trend&channel=tts
http://www.ssmi.com/msu/msu_data_monthly.html?type=trend&channel=tls
Sorry to put up duplicates there, and for the untidy table. I hate this word processing software!
David Middleton says:
August 17, 2012 at 2:56 pm
Thank you, great!
richardscourtney says:
August 18, 2012 at 3:33 am
I see, thanks! I always try to check all information that looks reasonable. I found my answer in David’s post, somehow I missed it first time I checked
Entropic man says:
Should I be talking to JJ and David Middleton who regard n=13 as too small a sample size of years for analysis of Greenland albedo trends, …
Don’t put words in my mouth, bucko.
Reasking that which remains unanswered, having been reasked for the same reason previously: You hold that 12 years of data produces a distribution that assigns what meaning to the terms “divergence” and “normal variation”, exactly?
JJ says:
August 19, 2012 at 3:26 pm
You hold that 12 years of data produces a distribution that assigns what meaning to the terms “divergence” and “normal variation”, exactly?
In the context of the albedo data. I regarded the values within 2 Standard Deviations of the minimum albedo mean as normal variation.
The 2011 and 2012 values were more than 2 Standard Deviations from the mean, indicating that the probability of their being part of the normal range of variation was less than 5%. I used divergence as a convenient shorthand for this.
Thinking on the matter later it occured to me that the 6/7 events per milennium frequency quoted gave an annual probability of occurence of about 0.6%, which agreed with my probability derived from the data in the graph.
In other scientific contexts I have tended to find that if two independant lines of evidence relating to the same phenomenon agree, one can have increased confidence in their validity.
As for putting words into your mouth, I interpreted your earlier comment as expressing unhappiness that the sample size was not larger. I would prefer n>30 for statistics involving 95% confidence limits myself, but in the case of the albedo data perforce went with what was available.
I’m not getting any closer to finding out what a sceptic consensus on the science looks at.
Science isn’t about consensus. Science is about constructing theories, looking for evidence and seeing if the evidence supports or falsifies the theory. Remember, no amount of evidence will ever prove a theory correct.
That so many theories are floated here, is evidence of how little we understand about the climate and complex the climate is. It may be that most of them have some truth and climate change results from their composite effect.
I personally think that the warming from 2XCO2 is around 0.3C as calculated by John Daly and more recently here by Willis E. I also think the elephant in the climate room is albedo (and albedo changes from aerosols). But we only have good albedo data from 2000, and global albedo has been flat, as have temperatures. So that doesn’t tell us much.
Philip Bradley says:
August 19, 2012 at 11:48 pm
Entropic man-I’m not getting any closer to finding out what a sceptic consensus on the science looks at.
Science isn’t about consensus. Science is about constructing theories, looking for evidence and seeing if the evidence supports or falsifies the theory. Remember, no amount of evidence will ever prove a theory correct.
————————————–
Within sciece I would agree with you. Unfortunately, in practice, scientists are expected to advise political decision makers.
Politicians have no liking for “a range of probabilities” or ” some of us think ” or “Fred’s theory says this and Charlie’s theory says that” . They demand a consensus opinion on the science to put alongside other factors such as voter pressure, economics, etc.
This creates oddities like the North Carolina state commission on seal level rise.A group of academics were asked to forecast the amount of sea level rise to 2100. Individual estimates varied from 18″ up to 55″. The politicians demanded a single figure and got 39″. They then decided mitigation would be too expensive and tried to pass a law banning anyone from discussing the matter.
http://www.reuters.com/article/2012/07/03/us-usa-northcarolina-idUSBRE86217I20120703
http://www.scientificamerican.com/article.cfm?id=north-carolina-sea-level-rises-desipte-senators
The IPCC reports are the consensus response of climate scientists to the same political requirement for scientific advice on climate change. Like it or hate it, AR4 is what decision makers requested. Their response to it varies with the political and other realities of their own situations. In Tuvalu they are bying land in Fiji to resettle their population if necessary. In the US a strong anti-climate change lobby forces politicians to keep their heads down.
What is missing on the sceptic side is some credible equivalent to AR4, a consensus document advising decision makers what to expect if IPCC are mistaken. I have seen documents describing a consensus among sceptic scientists that the impending doubling of [CO2] would produce a warming of 1.1C, plus 0.3C forcing, but outside the sceptic community that has not been widely reported. It may have been drowned out by the cacophany of different ideas coming from different factions within the community.
Friends:
The paid troll who posts under the name of Entropic man provides a clear statement of the desires of his/her/their paymaster(s) by saying in the post at August 20, 2012 at 3:40 am
Scientists practice science. They do not stop the practice of science because “politicians” want to use the statements of scientists.
Scientists are required to do their research and state what they have found, the uncertainty of their findings, and what they want to find. Anything else is not science.
Scientists are not “expected” to present a “consensus” (i.e. a single) opinion. Indeed, that is the opposite of what is expected of them.
A “consensus of opinion” is a rejection of science. Indeed, it is a prevention of science because it inhibits alternative understandings. And the selection of a single – i.e. a “consensus” – view of scientific opinion has a name: it is Lysenkoism.
(Anybody who does not know how Lysenkoism has already killed millions of people should google for ‘Trofim Lysenko’.)
Politicians obtain information from many sources and science is only one of them: others include economics, military intelligence, popular opinion, etc.. Politicians sift and evaluate this information to determine courses of action. THAT IS THEIR JOB. In democracies it is the job they are elected to do.
Entropic man wants politicians to only be provided with the scientific information which he wants them to have. His Lysenkoism is an attempt to destroy science and to usurp the political process.
Richard
Entropic says:
“What is missing on the sceptic side is some credible equivalent to AR4, a consensus document advising decision makers what to expect…”
The consensus is clearly on the side of scientific skeptics, as stated in the OISM petition, which debunks the UN/IPCC nonsense. More than 31,400 American scientists, 9,000+ with PhD’s, have co-signed an unequivocal statement pointing out that CO2 is harmless, and beneficial to the biosphere. Counter petitions attempted by the alarmist crowd have gotten fewer than 10% of those OISM numbers. Thus, the true consensus is heavily in favor of scientific skeptics. Deal with it, that is reality.
And I see that Entropic is stil fixated on Tuvalu sinking beneath the waves. How often must that patrticular climate alarmism be debunked, before people like Entropic finally accept the reality that Tuvalu is in ZERO danger from rising sea levels? It is simply not happening, yet people like Entropic continue to repeat the Tuvalu/sea level nonsense as if it were factual, when it is not.
Smokey:
There is an alternative to the IPCC AR4 which provides a clear summation of sceptical understandings of the science: it is the Non-Intergovernmental Panel on Climate Change (NIPCC).
The NIPCC document is far more credible than the IPCC AR4 (I contributed to the production of both of them). The NIPCC is the more credible than the AR4 because it presents a variety of understandings of the data while the AR4 presents a monolithic interpretation especially in its summaries.
Richard
@ur momisugly Entropic man, Physics doesn’t change there may or may not be warming in the pipeline, it was as true of the past as now, therefore the 0.7 deg includes any in-pipeline warming, which by the log law, would have Greater effect than today. (Some pipeline since Global temperatures are heading down). Now where are your Numbers, I gave you numbers I want yours in return. You demand numbers, expect to have the same demanded of you,
Entropic man says:
August 19, 2012 at 1:49 pm
I’m not getting any closer to finding out what a sceptic consensus on the science looks at….
_____________________________
We are not Warmist Scientists, we do not “DO” consensus science because it is antithetical to the scientific method. Instead we argue a lot using the best data and logic we can obtain. If someone has a better understanding we can and will shift views. This is why we have a major problem with the Warmist Scientists who follow the The Philosophy Of Karl Marx and/or Hegel
We hold the position that there is an objective reality.
In both cases reality is in the mind of man and “Consensus” or ” Synthesis” is truth. Consider the old question, if a tree falls in the woods does it make a sound if there is no one there to hear it.
Hegel would say no, those on WUWT would say yes, and Marx seems to think reality is in the collective mind so I guess it would have to be put to a consensus.
Wow! I come in after lunch for a quick look at WUWT and find more than I have time to answer!
Briefly:-
Mr. Courtney- Politicans do indeed take advice from all directions. I do not want Lysenkoism. I want them to get the best advice possible. Did you notice my use of the word credible. From their viewpoint the IPCC have more credibility than NIPCC . Get your sceptic scientists singing from one sheet, get several demonstrably accurate predictions on record and, above all, separate NIPCC publicly and visibly from any perceived links with political lobby groups. They might then have more influence. Dont rail at me, get out there and convince your own population.
Smokey- Science is not a democracy, it is a test of theory versus reality. No matter how many votes it gets, if a theory fails that test it is wrong. Telling that to politicians is, however, an uphill struggle. Like Mr Courtney, stop railing at me and get a convincing case together. If you can successfully reassure the government of Tuvalu you should be able to convert many others too.
Gail-“We are not Warmist Scientists, we do not “DO” consensus science”. This is why you remain on the fringe. A cacophany of different opinions is useless to the man planning sea defences or irrigation systems or wondering whether to buy more snowploughs.
Bobl-“the 0.7 deg includes any in-pipeline warming,” No, it doesnt. Sea temperatures are a long way from equilibrium even for the warming we’ve seen so far. It will be another 50 years before the changes already set in motion reach a stable state.
Ah, I see: Entropic cites the mythical alarmist “consensus” as his authority. Then, when that fictional alarmist consensus is shown to be non-existent, Entropic suddenly reverses course and declares that “science is not a democracy”.
Got it. Confirmation bias and moving the goal posts constitute the entire alarmist argument. Because there is certainly no scientific evidence for the CAGW belief.
And BTW, CAGW is not a “theory”, it is a thoroughly debunked conjecture. Theories and hypotheses are testable. That rules out the CAGW conjecture, which has never been testable.
Entropic man says:
August 19, 2012 at 1:49 pm
I’m not getting any closer to finding out what a sceptic consensus on the science looks at.
The following may interest you:
http://www.quadrant.org.au/blogs/doomed-planet/2010/03/six-myths-about-deniers
One quote:
“5. “Deniers” think CO2 is irrelevant.
The issue is not whether CO2 is irrelevant, but, rather, how relevant is it?”
Entropic man says:
In the context of the albedo data. I regarded the values within 2 Standard Deviations of the minimum albedo mean as normal variation.
The question was, what does “normal variation” mean to you. i.e. what significance do you associate with it? “Normal variation” is not a term with a single connotation. In addition to having a dry and unevocative meaning which describes the result of a statistical calculation, it is also, not surprisingly, a normative term. Unfortunately, people tend to equivocate on the statistical and normative meanings that they associate with that term. This is not the “how did you calculate that” question. This is the “So what?” question.
The 2011 and 2012 values were more than 2 Standard Deviations from the mean, indicating that the probability of their being part of the normal range of variation was less than 5%.
So what?
See.
Thinking on the matter later it occured to me that the 6/7 events per milennium frequency quoted gave an annual probability of occurence of about 0.6%, which agreed with my probability derived from the data in the graph.
The 6/7/mil frequency was quoted for melt events. The graph tracks albedo. You’re making fruit salad.
As for putting words into your mouth, I interpreted your earlier comment as expressing unhappiness that the sample size was not larger.
That was not a comment, it was a question. The size of a sample does not affect my happiness absent an inappropriate use of that sample. I was inquiring as to the nature of the use to which you are putting that sample.
I would prefer n>30 for statistics involving 95% confidence limits myself, …
Why? Why are you not content with n=13? What do you think you would get for n=30 that you don’t have now? Why would that be important? Why N=30, vs say, N=60, or N=100? How are you making these choices?
… but in the case of the albedo data perforce went with what was available.
Why? You seem to be yearning for n=30, as if that would have some important effect on your conclusions, but you go right ahead and draw those conclusions with less than half that sample size. Why would you do that?
Friends:
I quote and deconstruct the comments addressed to me by the paid troll who hides behind the pseudonym of Entropic man. I invite others to whom he/she/they had addressed comments to do the same.
Entropic man says
Point 1.
The two statements
“I do not want Lysenkoism”
and
“I want them to get the best advice possible”
do not equate.
Who decides “best”? The paymasters of of Entropic man?
Politicians need ALL the information so they can assess it using the advice of their civil servants: that is why a government has a civil service.
The statement saying “I want them (i.e. politicians) to get the best advice possible” is an assertion of pure Lysenkoism.
Point 2.
Of course they do, and from the viewpoint of the NIPCC the NIPCC has more credibility than the IPCC. This is why the views of those (e.g. me) who were involved in production of both documents are more credible than the views of people who were involved in the production of only one of them.
However, the phrasing may have been wrong. I am not intending to ‘put words in the mouth of Entropic man, but it is possible that he/she/they intended to write
“From politicians’ viewpoint the IPCC have more credibility than NIPCC .”
If that were the intended meaning of Entropic man then it is clearly wrong. Politicians control the IPCC process (the IPCC is an interGOVERNMENTal panel). Every line of the IPCC documents is approved by representatives of governments (i.e. representatives of politicians) or it is excluded from IPCC Reports. Politicians give the IPCC no more credibility than any other organisation they control as a mouthpiece.
Point 3.
Entropic man says
This is a stated desire for pure Lysenkoism.
Scientists challenge data, they don’t “sing” anything, and they stop being scientists if they sing “from the same sheet”. It is the duty of every scientist to challenge data and not to “sing” it especially not in unison. Advocates do that, scientists don’t.
Point 4.
No! Science is as more about demonstrating an existing idea is wrong than it is about finding supporting information for an existing idea.
And ‘climate realists’ have a record of accurate prediction; e.g. rising CO2 will have no discernible effect on global temperature. Whereas the AGW-hypothesis has failed to correctly predict anything; e.g., the ‘hot spot’ is missing.
Point 5,
The NIPCC obtains funds from the Heartland Institute (HI), but that funding is trivial when compared to thethe funding of the IPCC which is entirely from politicians (i.e. governments).
Stop all funding from the IPCC or give half of that funding to the NIPCC would be a better option.
The gall of Entropic man in calling for the NIPCC to be de-funded is staggering. If he could prove HI influenced the NIPCC in any way then he/she/they might have a point. But the HI does not influence the NIPCC at all. Whereas politicians control the IPCC.
Point 6.
At best this is disingenuous. If the NIPCC is de-funded then it will cease to exist so it will have no influence. And if it is presenting scientific information then “influence” has no importance. People, including politicians, choose information to use.
Point 7.
Nobody “rails” at Entropic man. People regard him/her/them with contempt and some refute his/her/their nonsense (as I am doing) for the benefit of others.
Point 8.
Climate realists don’t have their “own population” but all available polls show we are having success at explaining to the general public the truth that the AGW-scare is nonsense.
I look forward to others deconstructing the nonsense which Entropicman has directed at them.
Richard
Entropic man says:
August 18, 2012 at 3:24 pm
Ms Combs, while reading up on Bond events and Daasgaard-Oeschger oscillations I ran across this paper….
_____________________
Thanks. And yes I do think Milankovitch had it correct.
Where I have a problem is the zeroing in on CO2 before the first step in “Troubleshooting” was ever taken. That step is listing every conceivable possible variable. For chemical batch processes it would be temperature, pressure, mixing time and rate, personel/shift, mix equipment raw material lot/vendor…. As far as I am concerned we are still at that step.
For the sun we know there is a 22 yr Hale cycle.
Gleissberg came up with the 88-year solar cycle, Joan Feyman et al confirmed it with the Nile flooding/aurora records and there is this paper Persistence of the Gleissberg 88-year solar cycle over the last ∼12,000years: Evidence from cosmogenic isotopes
The name of the 200 year cycle is the de Vries or Suess cycle. Again confirmed by Joan Feyman et al and this paper The influence of the de Vries (∼ 200-year) solar cycle on climate variations: Results from the Central Asian Mountains and their global link among others.
Heck even the US government acknowledges these solar cycles.
I am rather surprised you were not aware of these solar cycles.
The there is Variation in Earth Rotation and Global Temperature (An example paper from Colorado State Uni)
And this Solar Activity, Geomagnetic Field, Earth Rotation Rate, and Climate a series of papers presented in 2007?, and this Long Term Variations in the Length of Day and Climatic Change and this from NASA: Giant Breach in Earth’s Magnetic Field Discovered
You should already be aware of Svensmark and Friis-Christensen’s Variation of Cosmic Ray Flux and Global Cloud Coverage – a Missing Link in Solar-Climate relationships and the confirming tests. CERN experiment confirms cosmic ray action Also Article originally appeared in PhysicaPlus: Cosmic Rays and Climate by Dr. Nir J. Shaviv
Also by Shavir on CERN experiment: The CLOUD is clearing
And then there are other factors outside the earth. Shavir’s The Milky Way Galaxy’s Spiral Arms and Ice-Age Epochs and the Cosmic Ray Connection
On top of that is plate tectonics and the movement of the Caribbean plate closing the Isthmus of Panama that is thought to have caused a change in ocean circulation, resulting in the gulf stream and the Ice Ages.
Then there are the oceans that act as climate modifiers and have a major contribution to the climate much of which is still not understood. Bob Tisdale is writing a book on just one part of that.
That is just quickly off the top of my head. Heck they are just now figuring out that CO2 is not uniform in the atmosphere PHOTOS: Global Carbon Dioxide -AIRS Data, July 2008 and July 2009 (scales are not the same)
Do I know what factors regulate the climate? No but I do know it is not just one factor but a combination and CO2 is just a tiny part of it. The Sun, our only source of energy has got to be in the middle of it even though we have not figured out the how and the oceans/water cycle have to play a big roll since land temperature follow sea temperatures and not vice versa.
🙂
Why do I smile?
I have just been harangued from three directions.
I have been haragued about science by a man demonstrating that he knows little of science
I have been harangued about politics by a man demonstrating that he knows little of politics.
I have been harangued about statistics by a man demonstrating that he knows little of statistics.
Ms. Combs, thank you.At least one person is discussing science.
You describe ten different cycles, some I’d never encountered before, and a number of other sources of complexity in the system. From context, I think you regard this complexity as a barrier to understanding it.
This is not necessarily a problem.I worked in ecology and was bedevillied by the same difficulty. The solution was to look for the drivers of the system. In ecology we quickly found that if we concentrated on energy flow and nutrient cycles, plus a limited number of environmental variables like temperature and water, the apparant complexity bcame self cancelling. The non-driving variables were either of small influence or cancelled each other out.
In studying climate the same thing may happen . With a large number of cycles acting simultaneously on the atmosphere, land and oceans, some will be warming, some cooling and some neutral at any time and most will be self cancelling.
The cycles driving the system will be the ones showing strong correalations with the climate data. I suggest five possible candidates.
On the largest scale would be the 100,000 year Milankovich cycle of orbital eccentricity, which matchs the glacial/interglacial cycle well.
If the Sun does show grand minima and grand maxima, then we may have a 1000 year cycle, explaining MWP, LIA and the present warming though I would as yet regard that as speculative, our measured solar data has too short a baseline.
On a decadal scale we have ENSO, and the NAO, both showing in the record. THe 11 year solar cycle also shows in the data, though I would like to see a much more strongly establised link before I accepted that cosmic rays rather than insolation are the mechanism by which it interacts with us.
Models are disliked here, perhaps because the sceptics expect too much from them. A model is a simplified simulation of reality, working, within its limitations, using the same physics. What you can do with a model is to try the things you cannot do with only one Earth available. Different cycles can be included or left out and the effects observed. It quickly becomes apparant which are the drivers and which are not.
If a sceptic scientist is listening, with access to climate modelling software; try producing a workable model in which the driving cycles can be shown to generate the temperature record of the last milennium, overwhelming any variation due to increasing CO2. That would be the sort of evidence which I, and hopefully the rest of climate science, would take notice of.
Werner Brozek says:
August 20, 2012 at 9:13 am
Entropic man says:
August 19, 2012 at 1:49 pm
I’m not getting any closer to finding out what a sceptic consensus on the science looks at.
The following may interest you:
http://www.quadrant.org.au/blogs/doomed-planet/2010/03/six-myths-about-deniers
One quote:
“5. “Deniers” think CO2 is irrelevant.
The issue is not whether CO2 is irrelevant, but, rather, how relevant is it?”
———————————–
Thank you. An excellent article.
It highlights perhaps the biggest problem in judging the inputs to the climate change debate. How does one distinguish the members of the five main groups.
At one extreme are the deniers, peddling dubious ideas and data to suit their agenda.
Next are the sceptic scientists, presenting evidence and data.to support their world view
In the middle are those just doing science with no agenda.
Next are the pro-climate change scientists presenting evidence and data to support their world view.
At the other extreme are the envioronmentalists, peddling dubious ideas and data to suit their agenda.
With political and economic agendas smeared all over the debate as well, how is one to sort wheat from chaff?
Regarding CO2, I regard the match between the lab measured CO2 spectrum, the ground radiometry of the downward radiation spectrum, and Earth’s emission spectrum as consistent with the effect of CO2 acting as a greenhouse gas. My own back-of-the-envelope calculations also give answers consistent with the IPCCs mid-range model for the effect of increasing CO2. I also enjoy thought experiments like the recent statistics on the Greenland albedo data which so annoyed JJ. As a retired scientist and science teacher from a different discipline, this is the best I can do personally.
Beyond that I, and everyone else, are in the hands of the professionals; and which professionals one accepts evidence from depends on ones own [snip . . kbmod] filter settings.