Guest Post by David Middleton
“Satellites See Unprecedented Greenland Ice Sheet Surface Melt… Right On Time”

I guess Professor Tedesco missed this…
“Ice cores from Summit show that melting events of this type occur about once every 150 years on average. With the last one happening in 1889, this event is right on time,” says Lora Koenig, a Goddard glaciologist and a member of the research team analyzing the satellite data.
How can an ice sheet surface melt be both “unprecedented” and “right on time”?
It can’t. However, nothing is impossible when you combine govt bureaucrats and the junk science of anthropogenic global warming…

Satellites See Unprecedented Greenland Ice Sheet Surface Melt
07.24.12
For several days this month, Greenland’s surface ice cover melted over a larger area than at any time in more than 30 years of satellite observations. Nearly the entire ice cover of Greenland, from its thin, low-lying coastal edges to its two-mile-thick center, experienced some degree of melting at its surface, according to measurements from three independent satellites analyzed by NASA and university scientists.
[…]
“Ice cores from Summit show that melting events of this type occur about once every 150 years on average. With the last one happening in 1889, this event is right on time,” says Lora Koenig, a Goddard glaciologist and a member of the research team analyzing the satellite data. “But if we continue to observe melting events like this in upcoming years, it will be worrisome.”
[…]
Summit Station’s summer peak temperatures flirted with 0°C for a few hours in late July.

Hence the somewhat unusual wide-spread, right-on-time melt.
This melt shows up very clearly in the Greenland Ice Sheet Albedo…

The “normal” summer melt season albedo minimum at 2500-3200m is in the range of 0.79-0.82. This year, it briefly dropped to just below 0.74.

“Normal” is based on 12 years of data. The GRACE measurements upon which the accelerating ice loss claims are based are heavily dependent on the Glacial Isostatic Adjustment (GIA). While not as large as Antarctica (where the GIA’s margin of error is nearly as large as the asserted ice loss), GIA variations can result in totally different ice loss values… And the GRACE time series isn’t any longer than the MODIS time series.
Wu et al., 2010 determined that the GIA commonly assumed for Greenland was way too high and that the 2002-2008 ice loss rate was 104 Gt/yr rather than the oft cited 230 Gt/yr. Even at 230 Gt/yr, it would take 1,000 years for Greenland to lose 5% of its ice mass.
Riva et al., 2007 concluded that the ice mass-loss rate in Antarctica from 2002-2007 could have been anywhere from zero-point-zero Gt/yr up to 120 Gt/yr. Dr. Riva recently co-authored a paper in GRL (Thomas et al., 2011) which concluded that GPS observations suggest “that modeled or empirical GIA uplift signals are often over-estimated” and that “the spatial pattern of secular ice mass change derived from Gravity Recovery and Climate Experiment (GRACE) data and GIA models may be unreliable, and that several recent secular Antarctic ice mass loss estimates are systematically biased, mainly too high.”
So… We have barely a decade’s worth of data and no idea if the modern melt rates and albedo changes are anomalous relative to the early 20th century Arctic warming, Medieval Warm Period or any of the other millennial-scale Holocene warming periods.
I’m gonna go out on a limb and say that unless some alarmist can tell me what the albedo was in 1899, 1127, 1143 and 1939, during the vast majority of the Holocene or during the Sangamonian, my response is, “Very interesting. Now, move along, there’s nothing more to see here.”

http://wattsupwiththat.com/2011/09/29/warming-island-greenland-sea-regional-climate-and-arctic-sea-ice-reconstruction/

(After Alley, 2000)

(NGRIP)
Manhattan-sized Icebergs!!!

(MSNBC)
Manhattan-sized Icebergs are insignificant relative to Greenland-sized ice sheets.
- Manhattan: 34 square miles.
- Greenland ice sheet: 660,235 square miles.
Manhattan = 0.005% of Greenland ice sheet. 99.995% of the Greenland ice sheet did not participate in this event.
If one Manhattan-sized chunk of ice calved into the ocean every year and there was no snow accumulation in Greenland for 1,000 years, Greenland would lose 5% of its ice sheet.

(Wikipedia and Google Earth)

(Climate4you)
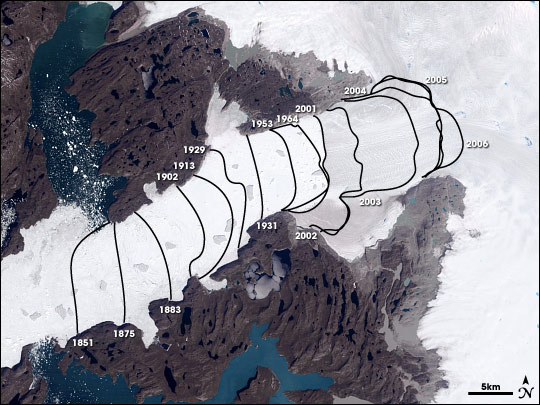
This is a Google Earth photo of Jakobshavn Isbrae, Greenland’s largest outlet glacier…The red lines represent the calving front’s retreat from 1851-1942.If the calving front retreated almost 20 km over that 90-yr period and Greenland’s ice sheet is supposedly vanishing (according to the Warmists), why does the Google Earth image show so much ice downstream of the calving front?
Surely if Jakobshavn Isbrae’s calving front retreated by nearly 20 km before SUV’s, it must have retreated much more than 20 km farther upstream that the 1942 front by now… Right?
(Wikipedia)
It appears to have only retreated by a bit more than 10 km since 1942… But, why is there still so much ice downstream of the calving front? If the Greenland ice sheet is disappearing, surely that must be open ocean… erm… open fjord by now… Right?
All that moving around of the calving front and all that lack of disappearing ice might lead someone to think that glaciers are rather dynamic…
Jakobshavn Isbrae – Greenland Glacier Has Always Changed With The Climate
By News Staff | July 16th 2011
New research on Jakobshavn Isbrae, a tongue of ice extending out to sea from Greenland’s west coast, shows that large, marine-calving glaciers don’t just shrink rapidly in response to global warming, they also grow at a remarkable pace during periods of global cooling. *Glaciers change.
[…]
Jakobshavn Isbrae has been the focus of intense scientific interest because it is one of the world’s fastest-flowing glaciers, releasing enormous quantities of Greenland’s ice into the ocean. It is believed that changes in the rate at which icebergs calve off from the glacier could influence global sea level rise. The decline of Jakobshavn Isbrae between 1850 and 2010 has been documented, mostly recently through aerial photographs and satellite photographs.
“We know that Jakobshavn Isbrae has retreated at this incredible rate in recent years, and our study suggests that it advanced that fast, also,” said Jason Briner, the associate professor of geology at the University of Buffalo, who led the research. “Our results support growing evidence that calving glaciers are particularly sensitive to climate change.”
[…]

(Wikipedia and Google Earth)
“Our results support growing evidence that calving glaciers are particularly sensitive to climate change.”Greenland’s climate is always changing… Always has and always will change… And the climate changes observed over the last few decades are not unprecedented. The Greenland ice sheet is no more disappearing this year than it was last year and it is physically impossible for the ice sheet to “collapse” into the ocean.
Thank you, David.
Every voice helps, when dealing with ignorance.
Off topic I know but the article jogged my memory about the Arctic row 2012 so here is an extract from Thursday:
I would love for someone to contact Dr. Ron Kwok at JPL/NASA and/or Dr. James Morrison at washington.edu to see what the heck is going on out here (both polar weather experts we contacted prior to departure). I suspect the tough conditions have something to do with the unusually cold winter but I don’t know.
Scott Mortensen
August 16, 2012
Off the northwest coast of Alaska
Entropic man says:
August 17, 2012 at 3:32 pm
I get that a lot here, Gunga Din. These people are negative.
So AGW is not the most negative belief on the planet?
Take a look at the satellite images of South West Greenland at r02-c01 and r02-co2. There sure is a lot of melting going on. I realise this is the height of the melt season but I’ve never taken the trouble to look at it before so have no idea if this amount of melting is to be expected.
The 250m images provide exceptional detail and the melt lakes and holes are clearly defined. I wonder what the dark strip running up the western edge of the ice is caused by?
Entropic man on August 17, 2012 at 10:49 am
Mr. Middleton, do you know on what dates your photos in figures 11 and 12 of the Jakobshavn Isbrae were taken? The calving fronts labelled reflect the minimum extent of the glacier at the warmest part of the thaw.
The position of the ice front in the photograph and the lack of snow suggest that the picture was taken considerably later in the season after the ice front had moved seaward once more, but before the first snowfall.
[…]
If the Greenland ice sheet was “disappearing,” it wouldn’t matter what time of year the photos were taken.
Satellite image link for my post above. Sorry about that, perhaps the moderator could include it and delete this to tidy up the thread.
http://rapidfire.sci.gsfc.nasa.gov/imagery/subsets/?mosaic=Arctic.2012230.terra.4km
I should have better explained the differences between the ice cap (~continental glacier) and outlet glaciers. The calving and melt dynamics of the outlet glaciers are often reported as indications of destabilization of the entire ice sheet; which is nonsense. That’s why I included a link to Ollier & Paine.
Jakobshavn Isbrae As of Yesteday 17/083012. Scroll to middle of vertical and Horizontal axis. I have selected outline coasts so it is easier to see where the fjord starts.
http://rapidfire.sci.gsfc.nasa.gov/imagery/subsets/?subset=Arctic_r02c02.2012230.terra.250m&vectors=coast
How come this data from NOAA Aug 17, 2012 shows Greenland more than 90% icecovered? :
http://www.natice.noaa.gov/pub/ims/ims_gif/DATA/cursnow_asiaeurope.gif
Is there a more recent satellite photo available?
Thanks James for the Jakobshavn Isbrae photo!
Reblogged this on Globalcooler's Weblog and commented:
A short time ago I made a comment in one of my articles that the Arctic Ice might be one of the largest summer minimums in at least 5 years. I appears thet will not be the case. That requires that I point out my error and replace my prediction with a rational view of what is actually happening. One of the best is this by David Middleton.
Gail Combs says:
NOPE, you have it backwards. Climate scientists have to convince ME that there is something going on that is not typical of Earth’s climate.
Especially given that “change” is typical of Earth’s (and probably other planets’) climate.
Even if they could do that it would still be necessary to provide good evidence that human activity is a significent causal factor. That they had correctly identified what that factor was. That any proposed “solutions” would actually be effective. Etc.
Lars P. says:
August 18, 2012 at 2:08 am
Entropic man says:
August 17, 2012 at 10:57 am
Thank you, for the answer and the link, however the link does not seem to work… eventually could you write it in full so that I can copy-paste and try to read the article?
Sorry, I cant get back to the accursed link myself!
Try the links in my Aug 17,2012 at 3.41pm comment. I think they cover a lot of the same ground.
David Middleton says:
August 18, 2012 at 9:05 am
ntropic man on August 17, 2012 at 10:49 am
Mr. Middleton, do you know on what dates your photos in figures 11 and 12 of the Jakobshavn Isbrae were taken? The calving fronts labelled reflect the minimum extent of the glacier at the warmest part of the thaw.
The position of the ice front in the photograph and the lack of snow suggest that the picture was taken considerably later in the season after the ice front had moved seaward once more, but before the first snowfall.
[…]
If the Greenland ice sheet was “disappearing,” it wouldn’t matter what time of year the photos were taken.
—————————
It matters considerably. Photos taken at different times in the season will show the solid ice of the glacier, the calving front and the sea ice in different positions along the fjord.. A cynic might wonder if you were trying to present photos of a different part of the season and pretend they represented the maximum retreat of the calving front. This would present the illusion that the long-term retreat had stopped.
Gail Combs says:
NOPE, you have it backwards. Climate scientists have to convince ME that there is something going on that is not typical of Earth’s climate.
Robert Austin says:
August 17, 2012 at 5:49 pm
They convince us, not we convince them. Capiche?
My own view of climate change without humanity was written in my Aug 17, 4.25pm comment. Add “Since 1880 cAGW has reversed the downward trend towards a glacial period.” and you have a complete idea of my thinking.
Can give me your world view in a similar way, in about the same detail, with an idea of the mechanisms you think are controlling the system and some numbers. ( Specifics please, not vague generalisations like natural variation.) Some things we may already agree on. For example do you accept the long term pattern of Milankovich cycle driven glacials and interglacials?
I need to know clearly what you mean by typical, before I can construct proper counter arguments. If you are not clear, yourself, what you believe there would be no point in trying to refute foggy thinking.
Ms Combs, while reading up on Bond events and Daasgaard-Oeschger oscillations I ran across this paper on the effect of various cycles on temperature. You might find it interesting.
http://www.agci.org/docs/lean.pdf
The Standardized Melting Index (SMI) is defined as the number of days where melting occurs multiplied by the surface area. So, the SMI for 2012 in Greenland is at an all time high after 33 years of data. The satellites being used are capable of measuring the area of the melt, but are incapable of measuring the thickness of the melt from the agw crowd. Will someone please tell me what possible significance there is to knowing time multiplied by area? Anyone?
Area of wetness means nothing. The sudden SMI increase could be the result of a parked high pressure area or change in surface albedo.
Volume of melt on the other hand, like cubic kilometers per day,would be of utmost significance. These satellites do measure elevation of ice. However, since there has been no discussion on any ice elevation change, one can only conclude that if the elevation was dropping, indicating an ice loss, we certainly would have heard about it by now.
“Ice cores from Summit show that melting events of this type occur about once every 150 years on average. With the last one happening in 1889, this event is right on time,” says Lora Koenig,
——————————————————————————————————————
The “right on time” is 27 years early.
Gail, I am just pointing out to the assembled readers, that in fact the assumption that the CO2 / Temperature follows a log law, presupposes that CO2 adds to the atmosphere, if that isn’t happening then the log characteristic is actually likely to break down at some point and become saturated.
For example project backwards using the IPCC numbers 390PPM (33 deg GHE) 190 PPM (30 deg GHE) 95 (27 deg GHE), 47, 22, 11, 5.5, 2.5, 1.2, 0.6, 0.3PPM where do I stop, is really the step between 0.15PPM and 0.3 PPM really going to result in a 3 degree temperature rise for 0 deg GHE to 3deg GHE. What happened for the doubling before that 0.075 to 0.015 since we are right back to the black-body temperature does the relationship break down there? Or are we going to get a temperature less than the backbody temperature, a greenhouse cooling ;-). The point is that this will not be a strict log law relationship, there will be practical limits at both ends, one is the available energy input, the other is the infinite slope of the log curve at zero, real world has to be something less than that
CO2 can only ever increase absorption 17% over what it does now (85 % energy saturated). Since the rise from all sources so far is 33 deg, the absolute maximum that could occur even in a 100% CO2 atmosphere is 5.2 degrees, feedback or not. Even if that occurred, it’d still not be catastrophic – Mind you we’d all be dead of asphyxiation, since we’d run out of oxygen long before we get to 100% CO2
Instead we get told 3 degrees per doubling giving more than 5.2 degrees rise by the time we get to 1600 PPM (0.6% CO2) – Just Ridiculous.
Oops
giving more than 5.2 degrees rise by the time we get to 1600 PPM (0.16% CO2)
@Entropic man – Some Numbers for you – you wanted hard numbers right?
1. IPCC 6 Degrees by 1600PPM (0.16% CO2 atmosphere)
BOBL’s calc 33 Deg GHE so far, CO2 85% Saturation, Remaining energy 15% ratio 15/85 17% increase in GHE above amount so far = 5.2 Degree rise (for 1 ATM 100% CO2 Atmosphere) – This is called a bounds test BTW
2. SCIENCE – Rise for last 100PPM 0.7 deg
IPCC Forecast for next 100PPM 1.2 – 2.4 deg
Temperature/CO2 relationship is a log (ln) law – Please reconcile how the rise for the next 100 PPM can be greater than the last 100PPM if the relationship is a log law – Numbers please?
3a. Gain for feedback is a nett of 3 degrees due to feedback, proportion of output fed back to input (loop gain) IPCC – 0.67 – Q 1 – How is it this is stable.
3b – There are significant negative feedbacks in the climate, Lapse Rate feedback, Radiative Loss, Cloud Albedo amounting to an attenuation of the direct effect of C02 by a factor of 5 (1/5th). This implies a counteracting positive feedback resulting in a multiplication of 15 must exist, requiring a total positive feedback loop gain (proportion of output fed back to input) of more than 0.95 – Please explain how this is stable. Bode plot to prove stability please Entropic?
Lets see if Entropic can come up with Post-Normal mathematics?
Bobl says:
August 18, 2012 at 6:24 pm
Mind you we’d all be dead of asphyxiation, since we’d run out of oxygen long before we get to 100% CO2
We will never run out of oxygen since if oxygen gets below 15%, fires cannot burn so no cars or trucks can run, but we would still live. With artificial respiration, the person can be revived with air that has 17% oxygen and 4% carbon dioxide. There just would not be too many olympic records set if oxygen dropped to 15%.
Bobl says:
August 18, 2012 at 6:52 pm
2. SCIENCE – Rise for last 100PPM 0.7 deg
IPCC Forecast for next 100PPM 1.2 – 2.4 deg
You quote a rise of 0.7C for the change in CO2 from 0.028% to 0.038%. You make the elementary mistake of assuming that the temperature change due to this CO2 increase has gone to completion, and is therefore going to be less than the temperature rise due to the change from.0.038% to 0.048%. You forgot that the latter is a prediction to equilibrium while the effect of the former is ongoing as equilibrium has not yet been reached.
As you pointed out temperature is proportional to log[CO2], To suggest that the first quantity should be less than the second is mistaken.
If the rest of your attempt to drown me in mathematics is of the same quality, it is probably not worth answering.
Entropic presumes far too much based on zero scientific evidence. Any effect from human emitted CO2 is too small to measure. And of course, from years to hundreds of millennia, rises in CO2 have always followed rises in temperature, not vice-versa.
And where’s that global warming, anyway? The rise in [harmless, beneficial] CO2 seems to be an especially impotent temperature driver over the past three decades. Sorry about Entropic’s failed CO2 conjecture. Based on real world evidence, it is obviously mistaken.
I’m not getting any closer to finding out what a sceptic consensus on the science looks at.
Should I be talking to the sceptic scientists who regard a doubling of [CO2] as causing 1.1C warming from direct back radiation and 0.3C forcing ( the reference is on WUWT, I think, but a search didnt pick it up), or to Smokey who does not regard it as a greenhouse gas at all?
Should I be talking to JJ and David Middleton who regard n=13 as too small a sample size of years for analysis of Greenland albedo trends, or to Robert Carter who regards n=13 as enough years to confidently predict that global warming has stopped?