Guest post by Michael Pacnik
Especially in the context of recent discussion of the Shakun et al. paper, a look at other sources for temperature history versus CO2 can be helpful, examining timescales ranging from the past century to the past 11000 years and even the past 500 million years.
Recent discussion of the Shakun et al. (Nature 2012) paper has illuminated issues in its presentation of the history of CO2 versus temperature (commentaries here, here, here, and here).
In addition to those investigations, another helpful approach may be to take a step back and cross-check with other sources. In general, does CO2 correlate with temperature in climate history?
The answer is often yes on “medium” timescales, but no on “short” timescales and also no on the very longest timescales of all. If one looks at all three timescales, overall observations are consistent with temperature rise causing the oceans to release part of their dissolved CO2 after substantial lag time, yet not consistent with CO2 being the primary driver of climate.
Over the past few hundred thousand years of ice core data, a “medium” time
scale in this sense, CO2 superficially appears to change in step with
temperature if a graph is so zoomed out as to not show sub-millennial time
scales well:

Source: http://www.brighton73.freeserve.co.uk/gw/paleo/400000yearslarge.gif
Yet, what about a closer look at a “short” time scale, the past few thousand years instead?
Showing from 200 to 11000 years ago, the subsequent graph is based on ice core data, readily visible in files hosted on the servers of the U.S. National Oceanic and Atmospheric Administration (NOAA): GISP 2 and EPICA Dome C:

Source:
A lack of correlation between temperatures (in the above from a Greenland ice core) and atmospheric CO2 becomes very apparent at that timescale and level of detail.
With the focus on the bulk of the past 11000 years of the Holocene, the most recent rise in CO2 is not shown in the preceding because the EPICA ice core data ends in 1777 A.D., while the GISP 2 ice core temperature data extends up to a century ago.
Greenland is relatively indicative of changes in Northern Hemisphere temperature over time. Throughout the Holocene, warm periods have tended to have more warming in the upper Northern Hemisphere than nearer the equator (including the Modern Warm Period, a.k.a. global warming).
In the prior chart, much of around 7000 to 8000 years ago was particularly warm, more so than now. Such was part of the Holocene Climate Optimum. Research at Oak Ridge National Laboratory remarks (bolding added):
“By 8,000 14C y.a., the Earth was under a full interglacial climate, with conditions warmer and moister than present in many parts of the world. Tropical forest in Africa (and probably also Asia) was expanded in area, and the areas of desert in Africa and Asia were much reduced.”
Source: http://www.esd.ornl.gov/projects/qen/nerc.html
In fact, that atlas of palaeovegetation led to a conclusion which may surprise those used to hearing claims of how global warming would mean overall more deserts: When the climate was warmer, overall desert extent was actually less (because the ocean surface, 70% of Earth’s area, was warmed as well as land, causing more thermal-driven evaporation and circulation through rainfall of water onto land). Conversely, there was far greater
desert extent 18000 years ago during the cold Last Glacial Maximum, including polar deserts which are cold but have a lack of precipitation.

Sources: http://www.esd.ornl.gov/projects/qen/nerc.html
However, at the “short” time scales in the last ice core graph, showing fluctuations down to relatively small fractions of a millennia, atmospheric temperatures over Greenland would not be the same as ocean temperatures far below the surface, as the ocean depths can take centuries to warm much.
Only at greater time scales is there time for even seawater thousands of meters deep to fully warm and release more CO2. Accordingly, only at greater “medium” time scales does CO2 and temperature correlate highly, as can be seen contrasting the 400,000-year graph to the 11,000-year graph.
Evidence for how CO2 in ice core data lags temperature by centuries has been discussed before at Watts Up With That, including articles in 2009 by Frank Lansner and R. Taylor.
A simple Henry’s Law formula is applicable to a glass of water on a table releasing more previously-dissolved gas when warmed, but it is not literally valid when there are chemical reactions with the solute (CO2). The oceans are a far more complex system in general. However, still, more CO2 is released eventually when the planet warms. The atmosphere and the ocean surface (or shallow zones) warms much first, then deeper waters later.
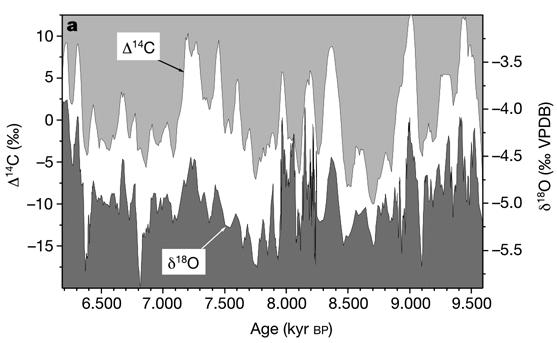
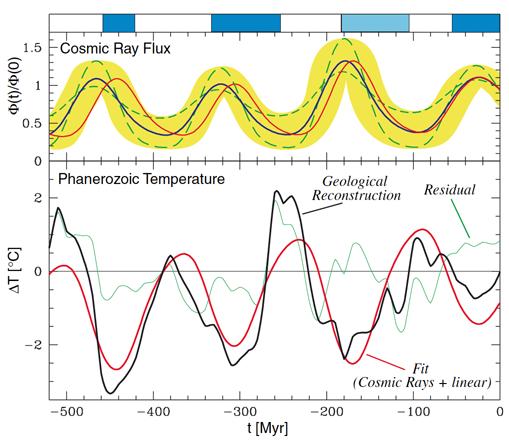
If CO2 does not usually correlate well with temperatures on the scale of variation over shorter time intervals, what does? A look at a reconstruction of Indian ocean temperatures is fitting:

Source: http://sciencebits.com/files/pictures/climate/crcFig1.jpg
Such is showing the history of temperature versus cosmic ray flux. The Oxygen-18/Oxygen-16 isotope ratio is a common temperature proxy, where the trends in it correspond to the trends in temperature.
Many papers describe Carbon-14 as a solar activity proxy, which it is indirectly, aside from some caveats on other time scales than depicted here. However, more directly, it is a cosmic ray proxy. Aside from more recent artificial sources, 20th-century atmospheric nuclear tests, carbon-14 is a cosmogenic isotopeproduced in nature by cosmic rays.
On these time scales, most variation in incoming galactic cosmic ray flux is caused by changes in the solar-driven interplanetary magnetic field. Those changes have a major relationship to sunspot trends but are not exactly identical in timing. For example, the authors of a paper by NASA’s JPL remark (terminology clarification in brackets added):
“Cliver et., (1998) has compared the minimum aa [index of geomagnetic activity] values with the Earth’s surface temperature record and found a correlation of 0.95 between the two data sets starting in 1885. The solar irradiance [solar activity] proxy developed from the aa minima continues to track the Earth’s surface temperature until the present (Cliver et al., 1998).
This is in marked contrast to reconstructions based on sunspot number [Solanki and Fligger, 1998 in which the irradiance and the temperature are not correlated after 1978. In a study of 14C [Carbon-14 history] Stuiver and Quay (1980) found that the cosmic ray flux at the magnetopause was anticorrelated with [the] aa [index of geomagnetic activity].”
With that said, there is significant correlation between sunspot number trends and temperature in many time periods, provided that an appropriate temperature indicator is utilized. One example is the following chart from the NOAA archive for 1860 – 1985, where the global mean sea surface temperature trend (SST) is fortunately not skewed by Urban Heat Island (UHI) effects on land:

Source: http://www.oar.noaa.gov/spotlite/archive/images/sunclimate_3b.gif
However, as noted previously, trends in the aa index of geomagnetic activity
display even better correlation than sunspot trends to terrestrial temperatures. When the aa index of geomagnetic activity rises, more galactic cosmic rays are deflected in interplanetary space, and fewer cosmic rays reach Earth.
The following shows correlation between temperature and Be-10 over the latter part of the Little Ice Age and then into the 20th-century Modern Warm Period:

Source:
http://www.appinsys.com/globalwarming/GW_Part6_SolarEvidence_files/image009.gif
The Be-10 cosmogenic isotope is frequently labeled a solar activity proxy, which is true, but, once again, it is also and more directly a cosmic ray proxy.
On the short term, solar activity in terms of total solar irradiance (TSI) changes only by around 0.1% typically over solar cycles, but the interplanetary magnetic field varies vastly more in percentage terms, with correspondingly substantial changes in cosmic ray flux.
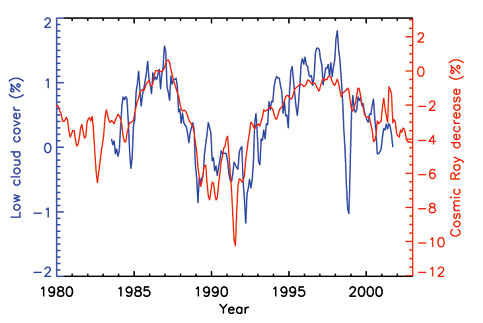
On Earth, tropospheric ionization changes by typically 5% over a single solar cycle (Shaviv, 2005). Global cloud cover has been observed to vary 3-4% in a solar cycle in a manner strongly correlating with cosmic ray flux change (Svensmark, 1997).
Cosmic rays are minuscule in direct energy delivered compared to sunlight but can seed clouds. Evidence supporting how cosmic rays contribute to cloud condensation nuclei has been discussed at Watts Up With That previously, including a last month’s update.
Some common mistakes can lead to missing observation of the effect of cosmic rays, discussed by Dr. Shaviv in remarks on the Hebrew University debate, another debate,
and a recent paper. (Also, counterintuitively, fluctuations in galactic cosmic ray flux matter little for the highest altitude clouds but more for lower altitude clouds, because the former are in an enviroment where GCRs are always in relative surplus and not the limiting nutrient, so to speak).
However, if those mistakes are all avoided, substantial correlation can be seen between cosmic ray flux variation and cloud cover variation, such as this illustration (discussed more at Dr. Shaviv’s site, following Marsh & Svensmark 2003):

Source: http://sciencebits.com/files/pictures/climate/crcFig3.jpg
There are other examples. For instance, as might be expected from cosmic ray variation slightly modifying average cloud cover, a study from a much different source notes a relationship between galactic cosmic radiation and tree rings:
“There was a consistent and statistically significant relationship between growth of the trees and the flux density of galactic cosmic radiation. Moreover, there was an underlying periodicity in growth, with four minima since 1961, resembling the period cycle of galactic cosmic radiation. We discuss the hypotheses that might explain this correlation: the tendency of
galactic cosmic radiation to produce cloud condensation nuclei, which in turn increases the diffuse component of solar radiation, and thus increases the photosynthesis of the forest canopy.”
An article by Dr. Svensmark on cosmoclimatology is excellent reading:
Cosmoclimatology: A new theory emerges (PDF)
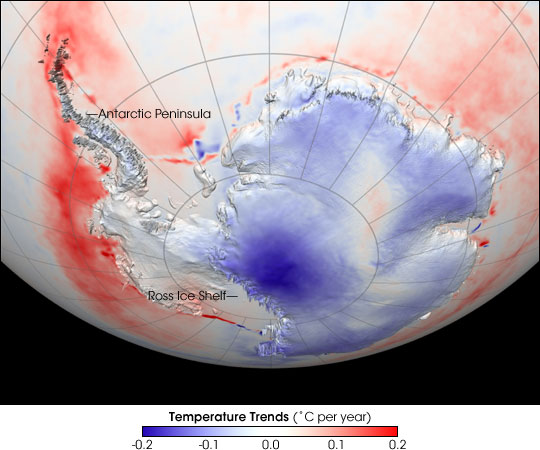
As implied there, a relative smoking gun of evidence exists for variations in cloud cover driving much of temperature change: Usually low-level cloud cover cools the surface, but cloud cover over the Antarctica ice sheet itself is the opposite situation, because the ice is such a particularly high albedo as to be literally more white (more reflective) than the cloud tops. The following NASA graph indirectly provides a rather good illustration if interpreted in that context:

Source:
http://eoimages.gsfc.nasa.gov/images/imagerecords/6000/6502/antarctic_temps.AVH1982-2004.jpg
Over the 1982 – 2004 period depicted above, there is a very sharp contrast between observed temperature trends over the exceptionally reflective continuous permanent ice sheet in Antarctica (cooled when average cloud cover decreased over that particular period) versus the less reflective surrounding ocean even a short distance away (warmed when cloud cover decreased).
Another NASA graph shows the past century of temperature variation on the opposite end of the world, the Arctic (which warmed far more in the late 20th century than more tropical regions):

Source:
http://earthobservatory.nasa.gov/Features/ArcticIce/Images/arctic_temp_trends_rt.gif
As can be seen, there was major decline in temperatures from the 1930s to the 1960s. CO2 emissions went up constantly meanwhile, in utter lack of correlation not fitting the theory of CO2 being the primary climate driver. What does fit for more correlation there is solar activity, both solar irradiance and the solar-driven interplanetary magnetic field affecting
comic rays:
Sources: http://www.appinsys.com/globalwarming/GW_Part6_SolarEvidence.htm
Even on a time scale of a century, CO2 trends do not correlate with temperature well. What about very “long” timescales in geological terms? Back in 2001, a study of atmospheric carbon dioxide levels for the last 500 million years (Rothman, MIT) remarked:
“Because the long-term evolution of carbon dioxide levels depends similarly [to a strontium-isotope record] on weathering and magmatism, the relative fluctuations of CO2 levels are inferred from the shared fluctuations of the isotopic records. The resulting CO2 signal exhibits no systematic correspondence with the geologic record of climatic variations at tectonic time scales.”
On those extreme long time scales, atmospheric CO2 levels are driven largely by geological processes other than the temperature-dependent release of CO2 from the ocean predominant on “medium” time scales. Accordingly there is lack of correlation between CO2 and temperature. The prior study also noted apparent long-period climate fluctuations, of around 135 million years, existing from some cause, with cycling between warm and cool modes several times over the past 600 million years.
Others have guessed that cause. Inthe words of Dr. Antonino Zichichi, president of the World Federation of Scientists:
“In the last half billion years, earth has lost, four times, its polar caps: no ice at the North Pole and none at the South Pole. And, four times, the polar caps were reconstituted. Man did not exist then, only the so-called cosmic rays, discovered by mankind in the early twentieth century. The last cosmic ice age started 50 million years ago when we entered into one of the galaxy arms.”
A non-coincidental match between a climate cycle of near 140 million years and the time it takes the Solar System to pass between spiral arms of the galaxy was observed by Dr. Shaviv after reconstructing past cosmic ray variation from iron meteorites:

Source: http://sciencebits.com/files/pictures/climate/crcFig5.jpg
Everything from ozone change to volcanoes, human activities, and ocean cycles has a non-zero effect on climate, but much of temperature history fits together well if changes in cosmic rays and solar activity have a major effect on climate. The preceding contrasts with those who would assume CO2 to be the primary climate driver and who, in practice, predominantly simply entirely ignore the effect of cosmic rays (aside from the occasional attempt at rebuttal to justify continuing to ignore them), acting as if solar activity variation only mattered for direct irradiance alone.
However, claims about massive forcing from CO2 variation have always been based not on its direct observed spectral effect but upon hypothetical major net positive feedback from water vapor vastly amplifying CO2’s small direct effect. Evidence supports rather a climate system with low climate sensitivity, with predominantly negative feedback.
Gail Combs said:
April 13, 2012 at 10:45 am
“Henry Clark, you might like to look at this research by Richard Feynman’s sister: NASA Finds Sun-Climate Connection in Old Nile Records It looks at ancient Nile and auroral records.”
Indeed that is a good example. (I did not know before now that Feynman had a sister, but, looking up the name, I see you are right).
Leif Svalgaard says:
No, you are a bit too formalistic here. We have geomagnetic data back to the 1740s, and good solar data covering the named Gleissberg minimum 1890-1920. Also, there is good evidence that at every minimum the Sun returns to the same state which we have observed many times. The real issue is not what happens a minimum, but what happens at maximum and we may see in the future a replay of the Maunder Minimum. The Dalton minimum was not deep enough to be of interest.
One thing, when I was talking about minimum, I was talking about named minimums such as the Maunder, I was not talking about the maximums and minimums we have observed many times in solar cycles. I would agree that with those “minimums” and “maximums”, it is the strength (if you can call it that) of the maximum that is what may, or may not, effect things like whether we have a little ice age or not.
If the Dalton Minimum (capitalizing to separate it out from solar cycle minimums and maximums) was not deep enough to be of interest, then the Gleissberg Minimum may not be either. The prediction of another (named) Minimum is that it will be about the strength of the Dalton, but longer. This may mean that we will not go into another little ice age, more like a little frost age, if the Dalton was not strong enough to effect weather. The predictions (which have been known to be wrong) also say that sun spots will fade by 2015, which would definitely effect the maximum (not capitalized because I am talking about a solar cycle maximum here).
We do, however, have a problem here. There was definitely a Little Ice Age, and it was definitely cold, and cold world wide. Something caused it. The latest posts here strongly suggest that it was not vulcanism (Willis pretty much shot down that idea in flames). So what does that leave? The most likely place to look for a lack of heat is, of course, the sun, since that’s where the heat comes from (News Flash, sun produces Global warming!). If not the sun, then what? It appears to go from warm to cold periods approximately every 500 years or so. Something must cause that. It could be cycles of things like ocean currents or some such, however, without a time machine handy, it is rather hard to say if the last little ice age even was from that, much less ones before that. There is, however, evidence of this here Maunder Minimum, which points to the sun, which makes it the most likely culprit. We at least should follow up on that to see if it might be true. One possible way, IF we go into a Named Minimum type solar change with the next cycles maximum (and it is “deep enough to count”), we may then be able to tell if such a Minimum can change weather, and if so, how much.
Also, the suggested ways that the sun may change weather, increased cosmic rays due to lower solar wind, and/or changes in UV radiation, are not things I believe have been measured until extremely recently. Since those are the things I am chiefly looking at, and they were not measured during, say, the Gleissgerg Minimum, that is why I am interested to see what those measurements are IF the prediction holds true and we go into an actual Minimum in the next cycle here (assuming that either of those actually do anything to weather). Unless proven proxies can show what the solar wind speed was, say, during the Maunder Minimum, then we will just have to wait for another Minimum and see what happens then.
Of course, it is always possible that little ice ages happen because of something we don’t know about yet. Maybe every 1000 years or so the earth passes through an area of the galaxy with higher than normal cosmic rays, strong enough to not care what the sun is doing (or not doing). However, for right now, the sun seems the most likely culprit. The only way to tell for sure is to wait for a Named Minimum type event (deep enough to be of interest) , which may mean only waiting till the next non maximum in the next solar cycle. However, that could still be years off.
I hate waiting…http://www.youtube.com/watch?v=y0Y7ScfaVHs
Lief said: I would go along with 10% for solar and 10% for CO2.
This is exactly the problem. Something was big enough to cause a full blown Little Ice Age. If what you say is true, we have a problem, something is causing the change and we don’t know what it is. If the above is true, and the sun only causes 10% of it, what is the other 90%? 90% is pretty big, you would think we could find something that big. The sun is, well, big.
Currently, the sun looks like the most likely guilty party, so we need to at least investigate the sun. We may not be ready to make an arrest yet, but we should at least gather some more clues. I mean, we got this here crime, somebody had to have done it!
Leif Svalgaard said:
April 13, 2012 at 5:32 pm
I’m not trying to convince you of anything. Experience shows that in the game it is impossible to overthrow entrenched dogmas by rational arguments or reliable data. I was bringing forward the reasons why I am not convinced by the multitude of claims [Hoyt and Schatten list ~2000 papers proving sun-weather-climate correlations]. Take for example the one you refer to by Solanky. There is ongoing research giving good reasons why that claim does not hold. I refer to some of that here: http://www.leif.org/research/The%20long-term%20variation%20of%20solar%20activity.pdf
Partially setting aside for the moment whether one trusts different Be-10 reconstructions and separate from the direct topic of sunspot number estimates, there is an indirect aspect to the matter. Indirectly, part of the matter comes down to how current temperatures compare to those in prior eras.
If current temperatures were utterly unprecedented compared to past history, a particularly high magnitude of late-20th-century solar activity would be required for solar activity to be much of a contributor.
But current temperatures are not really extreme. Here is a graph of temperature history … actually NSF (National Science Foundation), yet more honest than the hockey stick:
http://www.nsf.gov/news/mmg/media/images/monsoon1_h.jpg
Recent “global warming” has been relatively little outside of the upper northern hemisphere, outside of the Arctic. For instance, in the following for satellite data by zone for 1979-2012, there is roughly on the order of maybe 0.1 degrees Celsius meaningful temperature rise over that period beyond the oscillations in the tropics, as can be seen looking at the graph:
http://climate4you.com/images/MSU%20UAH%20TropicsAndExtratropicsMonthlyTempSince1979%20With37monthRunningAverage.gif
In contrast, for the Arctic, the following plot of a 5-year average went up by roughly around 0.7 degrees Celsius over the 1979-2000 period as can be seen:
http://upload.wikimedia.org/wikipedia/commons/5/53/NASAarctic_temp_trends_rt.jpg
corresponding to
http://earthobservatory.nasa.gov/Features/ArcticIce/Images/arctic_temp_trends_rt.gif
Yet the prior graphs also show how arctic temperature in the late 1930s was higher than it was in the late 20th century. Especially as ideological polarization continues to self-reinforce and skeptical “deniers” get more fully deterred from even being inclined to try entering the field as a career, there may be additional historical revisionism gradually revising until such is no longer so in future versions of graphing the same period, hockey stick style. However, whether in an act of subtle rebellion or otherwise, someone at NASA did post the preceding graph to their official server as can be seen.
Thus, for instance, solar activity does not even need to be far higher in recent decades than before for temperatures to have no inconsistency with solar activity being a major influence on them (not sole but major).
Leif Svalgaard said:
April 13, 2012 at 5:32 pm
I would go along with 10% for solar and 10% for CO2.
As might be guessed, I can’t agree with the 10% figure.
Out of curiosity, though, how is your other 80% divided?
Personally I think some part is from ocean cycles, partially, but not lengthy events like the LIA vs the MWP vs the Holocene Climate Optimum (and others).
Leif Svalgaard:
In my last comment, which will probably appear simultaneously with this one, there was a typo or carelessness where I said “current temperatures” when referencing the NSF graph which doesn’t extend past most of the way through the 20th century. However, other graphs referenced in my comment show more recently.
Legatus says:
April 13, 2012 at 7:00 pm
If the above is true, and the sun only causes 10% of it, what is the other 90%? 90% is pretty big, you would think we could find something that big. The sun is, well, big.
And just because of that, it is not easy to change the sun. It is amazing that people who cannot accept that the climate system has internal cycles gladly assume that the sun has.
Henry Clark says:
April 13, 2012 at 8:48 pm
As might be guessed, I can’t agree with the 10% figure.
10% is in the noise and so cannot be falsified nor confirmed. Theoretically, known variability of TSI must cause a 0.07C variation which is consistent with a 10% effect.
Out of curiosity, though, how is your other 80% divided?
Not divided, just internal climate variability.
Henry Clark says:
April 13, 2012 at 8:48 pm
But current temperatures are not really extreme. Here is a graph of temperature history … actually NSF (National Science Foundation), yet more honest than the hockey stick:
http://www.nsf.gov/news/mmg/media/images/monsoon1_h.jpg
By the same token, the LIA temperatures were not really extreme either [Legatus take note].
Leif Svalgaard said:
April 13, 2012 at 10:21 pm
Theoretically, known variability of TSI must cause a 0.07C variation which is consistent with a 10% effect.
But then you would be getting that 10% figure from implicitly assuming more or less 0% effect from cosmic rays, since then you are implicitly assuming only TSI counts.
That’s what the IPCC does, but them doing so does not support it being a valid approach, as, in general, they skip what they don’t like. For instance, as the NIPCC report chapter 7 comments on, the IPCC report has only a few brief remarks in passing on the biological growth effects of CO2 (and those misleading) in their collosal otherwise verbose report, despite how there is a vast number of studies showing effects including high gain in water usage efficiency, fewer open stomata needed, etc.:
http://nipccreport.org/reports/2011/pdf/07TerrestrialPlants.pdf
Anyway, treating cosmic rays as zero effect would be implicitly assuming the following (and a bunch of other evidence) is mere coincidence and accidental chance:
http://sciencebits.com/files/pictures/climate/crcFig3.jpg
Incidentally, for CO2 vs solar correlation:
The following is lousy correlation:
http://www.appinsys.com/globalwarming/GW_Part6_SolarEvidence_files/image024.gif
The below is better correlation (not my favorite quantity to have plotted compared to cosmic ray flux itself but still illustrative in this case):
http://www.appinsys.com/globalwarming/GW_Part6_SolarEvidence_files/image023.gif
Much more than 0.07 degrees Celsius and far more effect than TSI alone fits the latter best.
Leif Svalgaard said:
April 13, 2012 at 10:21 pm
Not divided, just internal climate variability.
Such as the ENSO, PDO, and AMO definitely exist, in those examples temperature-affecting ocean cycles of years to decades respectively.
But I’m not really seeing what you would envision matching the particular pattern of lengthy temperature diversions on the scale of centuries like the LIA.
For me, for my hypotheses, everything matches Occam’s Razor style: observed change in solar activity / cosmic rays during the LIA and MWP (plus some volcanoes but not the primary explanation); observed temperature change; etc.
I end up considering only with a grain of salt a few studies which just happen to conveniently utterly overturn the results found before the politicized era of climate science, but that is nothing new. I can’t even recall seeing any top pro-alarmism site report Doran & Zimmerman 2009 (the 97% “consensus” study asking respondents if temperatures rose relative to the “pre-1800s” — the LIA — so almost everyone answers yes) with enough shreds of honesty to ever mention the trick in its poll questions rather than implying it shows agreement with CAGW.
Henry Clark says:
April 14, 2012 at 1:37 am
But then you would be getting that 10% figure from implicitly assuming more or less 0% effect from cosmic rays, since then you are implicitly assuming only TSI counts.
No assumption here. The argument is this: TSI should give up to 10%. I see no signal above the noise above 10%. Any TSI connection is strong, valid physics, if we can get a good reconstruction for TSI we can calculate what the effect must be. The cosmic ray hypothesis is shaky from the outset and as an extraordinary claim demands extraordinary evidence [which is not there].
implicitly assuming the following (and a bunch of other evidence) is mere coincidence and accidental chance: http://sciencebits.com/files/pictures/climate/crcFig3.jpg
Worse than coincidence: cherry picking. What would the graph look like if extended to the present?
The below is better correlation (not my favorite quantity to have plotted compared to cosmic ray flux itself but still illustrative in this case):
http://www.appinsys.com/globalwarming/GW_Part6_SolarEvidence_files/image023.gif
Much more than 0.07 degrees Celsius and far more effect than TSI alone fits the latter best.
The 0.07 is a solar cycle effect: goes up then down then up then down, etc with no trend.
The TSI you show is not the TSI construction currently thought to be valid.
But I’m not really seeing what you would envision matching the particular pattern of lengthy temperature diversions on the scale of centuries like the LIA. For me, for my hypotheses, everything matches Occam’s Razor style: observed change in solar activity / cosmic rays during the LIA and MWP (plus some volcanoes but not the primary explanation); observed temperature change; etc.
The problem is that people cherry pick what they like and consider that settled to the degree that the razor is applicable. Although Solanki is wrong about how the 20th century should be spliced to the cosmic ray record, his reconstruction before is reasonable. Moberg has a global temperature reconstruction. Compare the two here [suitably scaled]: http://www.leif.org/research/Moberg-Solanki-Correlation.png
I have put ovals where the correlation obviously fails. I will predict that you will think the correlation is good, nevertheless.
sorry for the bold. Should have been:
The 0.07 is a solar cycle effect: goes up then down then up then down, etc with no trend.
The TSI you show is not the TSI construction currently thought to be valid, but is clearly picked to make your point.
But I’m not really seeing what you would envision matching the particular pattern of lengthy temperature diversions on the scale of centuries like the LIA. For me, for my hypotheses, everything matches Occam’s Razor style: observed change in solar activity / cosmic rays during the LIA and MWP (plus some volcanoes but not the primary explanation); observed temperature change; etc.
The problem is that people cherry pick what they like and consider that settled to the degree that the razor is applicable. Although Solanki is wrong about how the 20th century should be spliced to the cosmic ray record, his reconstruction before is reasonable. Moberg has a global temperature reconstruction. Compare the two here [suitably scaled]: http://www.leif.org/research/Moberg-Solanki-Correlation.png
I have put ovals where the correlation obviously fails. I will predict that you will think the correlation is good, nevertheless.
Something that is big has more internal state than something that is small, so it is also more likely to have “internal cycles”, IMHO.
Leif Svalgaard says:
April 13, 2012 at 2:34 am
The total global production of 14C is 17 pounds per year.
Feedbacks. Gnarly feedbacks.
DirkH says:
April 14, 2012 at 9:11 am
Something that is big has more internal state than something that is small, so it is also more likely to have “internal cycles”, IMHO.
I’m not saying is does not, on the contrary I think it does have internal cycles. My point was that people should also accept that the climate has. Or is your argument that the Earth is too small to have internal climate cycles? I don’t buy that.
gymnosperm says:
April 14, 2012 at 10:07 am
“The total global production of 14C is 17 pounds per year.”
Feedbacks. Gnarly feedbacks.
How much feedback can you get from 17 pounds per year?
Your gnarly faith must be strong.
BTW, the global total production of the other radioisotope 10Be is 2 ounces per year.
Leif Svalgaard says:
April 14, 2012 at 10:10 am
“Or is your argument that the Earth is too small to have internal climate cycles? I don’t buy that.”
No, it most definitely has; the ocean’s mass is big enough for that, and the thermohaline circulation takes a long time, so we should see century-scale repercussions of past events. No argument about that.
Leif Svalgaard said:
April 14, 2012 at 7:19 am
The problem is that people cherry pick what they like and consider that settled to the degree that the razor is applicable. Although Solanki is wrong about how the 20th century should be spliced to the cosmic ray record, his reconstruction before is reasonable. Moberg has a global temperature reconstruction. Compare the two here [suitably scaled]: http://www.leif.org/research/Moberg-Solanki-Correlation.png
I have put ovals where the correlation obviously fails. I will predict that you will think the correlation is good, nevertheless.
I would agree with there being lack of correlation if that graph summed up the situation, but rather see this in contrast (clicking it to enlarge if needed):
http://www.freeimagehosting.net/newuploads/319xq.jpg
(references given below)
In fact, writing additional text in my comment here would mostly only distract from the above important graphical illustration I created, so just click on it, aside from that I’ll quickly note see Svensmark 2007 for a GCR versus low-lying cloud cover plot extending up to its publication date (not cherry picked).
Sources used in making the giant image above:
Be-10 reconstruction:
http://napink.com/Global%20Warming%20and%20Phanerozoic%20Climate%20Changes_Page_17.jpg
(which corresponds to Solar Variability Traced by Cosmogenic Isotopes, by Beer et al. 1994)
Loethle 2007 temperature graph (actually not a lot different from Moburg overall although
vastly different from the fraudulent hockey stick):
http://www.drroyspencer.com/global-warming-background-articles/2000-years-of-global-temperatures/
though Loethle 2007 temperature data was utilized more exactly from:
http://www.ncasi.org/programs/areas/climate/LoehleE&E2007.csv
Svensmark 2007:
http://www.space.dtu.dk/upload/institutter/space/forskning/05_afdelinger/sun-climate/full_text_publications/svensmark_2007cosmoclimatology.pdf
Quick edit to my prior comment: I meant to reference Beer et al 1994, not the 1997 typo in the image.
Leif Svalgaard says:
http://www.nsf.gov/news/mmg/media/images/monsoon1_h.jpg
By the same token, the LIA temperatures were not really extreme either [Legatus take note].
Well, I looked at this graph, and it got me thinking…
First, I do see a LIA, a MWP, etc. I also see a lot of wiggles, you can see the LIA if you step back, but it gets harder to see much but the wiggles on smaller scales or if you look really close. Leif looks really close at the sun, he sees all it’s wiggles and changes. He then looks really close at the earth, he does not see wiggles and changes that match the suns, He concludes that the suns changes do not make the earth’s changes. This is because he has looked really closely at the sun and knows all its wiggles, and does not see the same matching wiggles down here. The rest of us (well, some of us) do see a match, because we do NOT know about all those little wiggles the sun makes, and thus can only see the big picture, that is, that the sun did something unusual, and around the same time, so did the earth. Thus the differences between what Leif thinks and what others think may be largely because of scale.
Second, I notices things on this graph like fall of Tang/Yuan/Ming dynasty. Well, I know a little about history from that region, and there may be just a little more to the fall of a dynasty than just weather. For instance, if this change in weather had hit when the dynasty was young and strong, would it have the same effect as if it hit when it was falling into massive corruption as periodically happens to ancient Chinese dynasties? In other words, what the effect on the dynasty may be from the weather may have a lot to do on the initial conditions of the dynasty when the weather hits.
And the same may be true of the climate, when the sun does it’s Grand Minimum thing (characterized by a change in solar cycle maximums, like very slow and weak solar wind, spots fade to nothing, etc), that change will meet the conditions of the earth at that time. Conditions like PDO and AMO warm or cold phases, speed and direction of ocean currents, the reactions of various forcings and feedbacks and thermostat effects. These all have their own timings of how fast and in what way they will react to the changes in the sun, and thus down here on earth one place may see an immediate change, another may not see any change for decades. Thus, when Leif looks at it, he does not see a matching wiggle of change on earth that matches the suns changes. He also won’t see one if he assumes a lag, because depending on the initial conditions and the place we are talking about, the lag (if any) may be very different in one place than another, and thus it won’t show up as one noticeable lag world wide, indeed the different time lags may average out if added together and not even be noticeable on say a world wide average temperature chart, even though their effects on one locality may be very noticeable (some earlier, some way later). Thus some people are saying the LIA may be entirely from cycles, another says it is entirely the sun, well, could we get away from this either/or idea and admit that it obviously could be a lot of both in a complex interaction? Not so much the sun effecting earth immediately and noticeably, but the sun effecting already acting cycles and those effecting the earth. In other words, the sun not doing it directly, the sun effects the cycles, then the cycles do it. We can see this already, most of the heating of the air on this earth is not the sun heats the air, but the sun heats the oceans which heat the air. And sometimes the sun heats the ocean which then sends that heat around the world to show up as effects decades later.
Possible examples: lets try two different places. Just a randomish pick, place, Jakarta Indonesia, initial starting condition, PDO in warm phase. Now the sun decides to have a Grand Minimum, what will the effect on this one place be? What will the effect be if the PDO is in cold phase when this happens? Now, lets try Shenyang in northeastern China, same conditions, what effects there? One place, say Jakarta, may not notice much if the PDO is in warm phase at the time for many years, the other, in northern China, may suddenly be effected by a change in the jet stream which could result in an immediate succession of very harsh winters. From an ivory tower many years later, if we average the two temperatures together, we may not see much, and assume the effect was small. Meanwhile, back then, the people of Shenyang could have seen a sudden drastic change in weather followed by famine, revolution, and war.
And about this statement “the LIA temperatures were not really extreme either”, well, they don’t have to be. One late spring frost, or one pre harvest rainstorm or hailstorm, and 75% of the crop is gone, followed by famine, revolution, and war. Example, also to show how initial starting conditions, in this case cultural, can effect this (and mask it if you average out things), these sorts of crop destroying effects hit Europe a while back. There was hardship but much of Europe adapted their farming practices and coped. However, in France, the peasants could not adapt because of their culture (much of it was a top down culture like the CAGW supporters are trying to remake our society into today), result, famine, the French Revolution, and a continent at war. Thus, if it meets the right conditions, even if the average temperature does not change by a great amount, all it needs is enough change that one day, just one, say a hard deep spring frost repeated year after year wiping out the crops, is enough to warrant the name Little Ice Age, because of the changes that it made. It is all very well for a professor in their air conditioned ivory tower today to make grand sweeping gestures at the map and say that the world wide average didn’t change much, yet the view of the man on the street back then in the real world may be very much different. Mann tried to get rid of the LIA. He failed. Don’t make the same mistake.