Guest post by Michael Pacnik
Especially in the context of recent discussion of the Shakun et al. paper, a look at other sources for temperature history versus CO2 can be helpful, examining timescales ranging from the past century to the past 11000 years and even the past 500 million years.
Recent discussion of the Shakun et al. (Nature 2012) paper has illuminated issues in its presentation of the history of CO2 versus temperature (commentaries here, here, here, and here).
In addition to those investigations, another helpful approach may be to take a step back and cross-check with other sources. In general, does CO2 correlate with temperature in climate history?
The answer is often yes on “medium” timescales, but no on “short” timescales and also no on the very longest timescales of all. If one looks at all three timescales, overall observations are consistent with temperature rise causing the oceans to release part of their dissolved CO2 after substantial lag time, yet not consistent with CO2 being the primary driver of climate.
Over the past few hundred thousand years of ice core data, a “medium” time
scale in this sense, CO2 superficially appears to change in step with
temperature if a graph is so zoomed out as to not show sub-millennial time
scales well:

Source: http://www.brighton73.freeserve.co.uk/gw/paleo/400000yearslarge.gif
Yet, what about a closer look at a “short” time scale, the past few thousand years instead?
Showing from 200 to 11000 years ago, the subsequent graph is based on ice core data, readily visible in files hosted on the servers of the U.S. National Oceanic and Atmospheric Administration (NOAA): GISP 2 and EPICA Dome C:

Source:
A lack of correlation between temperatures (in the above from a Greenland ice core) and atmospheric CO2 becomes very apparent at that timescale and level of detail.
With the focus on the bulk of the past 11000 years of the Holocene, the most recent rise in CO2 is not shown in the preceding because the EPICA ice core data ends in 1777 A.D., while the GISP 2 ice core temperature data extends up to a century ago.
Greenland is relatively indicative of changes in Northern Hemisphere temperature over time. Throughout the Holocene, warm periods have tended to have more warming in the upper Northern Hemisphere than nearer the equator (including the Modern Warm Period, a.k.a. global warming).
In the prior chart, much of around 7000 to 8000 years ago was particularly warm, more so than now. Such was part of the Holocene Climate Optimum. Research at Oak Ridge National Laboratory remarks (bolding added):
“By 8,000 14C y.a., the Earth was under a full interglacial climate, with conditions warmer and moister than present in many parts of the world. Tropical forest in Africa (and probably also Asia) was expanded in area, and the areas of desert in Africa and Asia were much reduced.”
Source: http://www.esd.ornl.gov/projects/qen/nerc.html
In fact, that atlas of palaeovegetation led to a conclusion which may surprise those used to hearing claims of how global warming would mean overall more deserts: When the climate was warmer, overall desert extent was actually less (because the ocean surface, 70% of Earth’s area, was warmed as well as land, causing more thermal-driven evaporation and circulation through rainfall of water onto land). Conversely, there was far greater
desert extent 18000 years ago during the cold Last Glacial Maximum, including polar deserts which are cold but have a lack of precipitation.

Sources: http://www.esd.ornl.gov/projects/qen/nerc.html
However, at the “short” time scales in the last ice core graph, showing fluctuations down to relatively small fractions of a millennia, atmospheric temperatures over Greenland would not be the same as ocean temperatures far below the surface, as the ocean depths can take centuries to warm much.
Only at greater time scales is there time for even seawater thousands of meters deep to fully warm and release more CO2. Accordingly, only at greater “medium” time scales does CO2 and temperature correlate highly, as can be seen contrasting the 400,000-year graph to the 11,000-year graph.
Evidence for how CO2 in ice core data lags temperature by centuries has been discussed before at Watts Up With That, including articles in 2009 by Frank Lansner and R. Taylor.
A simple Henry’s Law formula is applicable to a glass of water on a table releasing more previously-dissolved gas when warmed, but it is not literally valid when there are chemical reactions with the solute (CO2). The oceans are a far more complex system in general. However, still, more CO2 is released eventually when the planet warms. The atmosphere and the ocean surface (or shallow zones) warms much first, then deeper waters later.
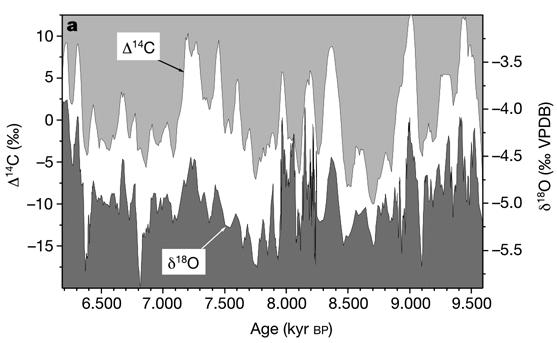
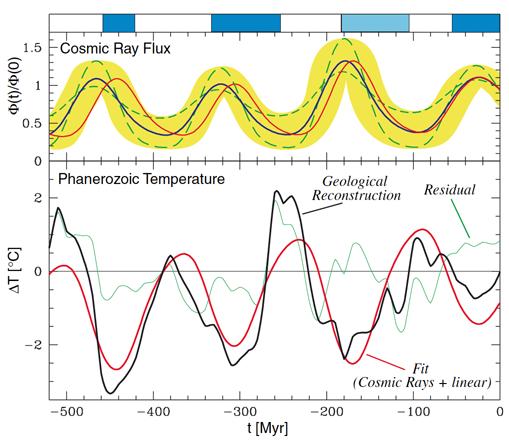
If CO2 does not usually correlate well with temperatures on the scale of variation over shorter time intervals, what does? A look at a reconstruction of Indian ocean temperatures is fitting:

Source: http://sciencebits.com/files/pictures/climate/crcFig1.jpg
Such is showing the history of temperature versus cosmic ray flux. The Oxygen-18/Oxygen-16 isotope ratio is a common temperature proxy, where the trends in it correspond to the trends in temperature.
Many papers describe Carbon-14 as a solar activity proxy, which it is indirectly, aside from some caveats on other time scales than depicted here. However, more directly, it is a cosmic ray proxy. Aside from more recent artificial sources, 20th-century atmospheric nuclear tests, carbon-14 is a cosmogenic isotopeproduced in nature by cosmic rays.
On these time scales, most variation in incoming galactic cosmic ray flux is caused by changes in the solar-driven interplanetary magnetic field. Those changes have a major relationship to sunspot trends but are not exactly identical in timing. For example, the authors of a paper by NASA’s JPL remark (terminology clarification in brackets added):
“Cliver et., (1998) has compared the minimum aa [index of geomagnetic activity] values with the Earth’s surface temperature record and found a correlation of 0.95 between the two data sets starting in 1885. The solar irradiance [solar activity] proxy developed from the aa minima continues to track the Earth’s surface temperature until the present (Cliver et al., 1998).
This is in marked contrast to reconstructions based on sunspot number [Solanki and Fligger, 1998 in which the irradiance and the temperature are not correlated after 1978. In a study of 14C [Carbon-14 history] Stuiver and Quay (1980) found that the cosmic ray flux at the magnetopause was anticorrelated with [the] aa [index of geomagnetic activity].”
With that said, there is significant correlation between sunspot number trends and temperature in many time periods, provided that an appropriate temperature indicator is utilized. One example is the following chart from the NOAA archive for 1860 – 1985, where the global mean sea surface temperature trend (SST) is fortunately not skewed by Urban Heat Island (UHI) effects on land:

Source: http://www.oar.noaa.gov/spotlite/archive/images/sunclimate_3b.gif
However, as noted previously, trends in the aa index of geomagnetic activity
display even better correlation than sunspot trends to terrestrial temperatures. When the aa index of geomagnetic activity rises, more galactic cosmic rays are deflected in interplanetary space, and fewer cosmic rays reach Earth.
The following shows correlation between temperature and Be-10 over the latter part of the Little Ice Age and then into the 20th-century Modern Warm Period:

Source:
http://www.appinsys.com/globalwarming/GW_Part6_SolarEvidence_files/image009.gif
The Be-10 cosmogenic isotope is frequently labeled a solar activity proxy, which is true, but, once again, it is also and more directly a cosmic ray proxy.
On the short term, solar activity in terms of total solar irradiance (TSI) changes only by around 0.1% typically over solar cycles, but the interplanetary magnetic field varies vastly more in percentage terms, with correspondingly substantial changes in cosmic ray flux.
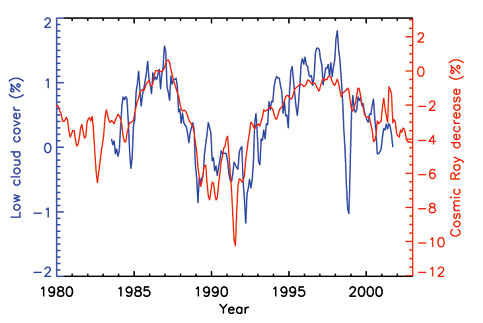
On Earth, tropospheric ionization changes by typically 5% over a single solar cycle (Shaviv, 2005). Global cloud cover has been observed to vary 3-4% in a solar cycle in a manner strongly correlating with cosmic ray flux change (Svensmark, 1997).
Cosmic rays are minuscule in direct energy delivered compared to sunlight but can seed clouds. Evidence supporting how cosmic rays contribute to cloud condensation nuclei has been discussed at Watts Up With That previously, including a last month’s update.
Some common mistakes can lead to missing observation of the effect of cosmic rays, discussed by Dr. Shaviv in remarks on the Hebrew University debate, another debate,
and a recent paper. (Also, counterintuitively, fluctuations in galactic cosmic ray flux matter little for the highest altitude clouds but more for lower altitude clouds, because the former are in an enviroment where GCRs are always in relative surplus and not the limiting nutrient, so to speak).
However, if those mistakes are all avoided, substantial correlation can be seen between cosmic ray flux variation and cloud cover variation, such as this illustration (discussed more at Dr. Shaviv’s site, following Marsh & Svensmark 2003):

Source: http://sciencebits.com/files/pictures/climate/crcFig3.jpg
There are other examples. For instance, as might be expected from cosmic ray variation slightly modifying average cloud cover, a study from a much different source notes a relationship between galactic cosmic radiation and tree rings:
“There was a consistent and statistically significant relationship between growth of the trees and the flux density of galactic cosmic radiation. Moreover, there was an underlying periodicity in growth, with four minima since 1961, resembling the period cycle of galactic cosmic radiation. We discuss the hypotheses that might explain this correlation: the tendency of
galactic cosmic radiation to produce cloud condensation nuclei, which in turn increases the diffuse component of solar radiation, and thus increases the photosynthesis of the forest canopy.”
An article by Dr. Svensmark on cosmoclimatology is excellent reading:
Cosmoclimatology: A new theory emerges (PDF)
As implied there, a relative smoking gun of evidence exists for variations in cloud cover driving much of temperature change: Usually low-level cloud cover cools the surface, but cloud cover over the Antarctica ice sheet itself is the opposite situation, because the ice is such a particularly high albedo as to be literally more white (more reflective) than the cloud tops. The following NASA graph indirectly provides a rather good illustration if interpreted in that context:

Source:
http://eoimages.gsfc.nasa.gov/images/imagerecords/6000/6502/antarctic_temps.AVH1982-2004.jpg
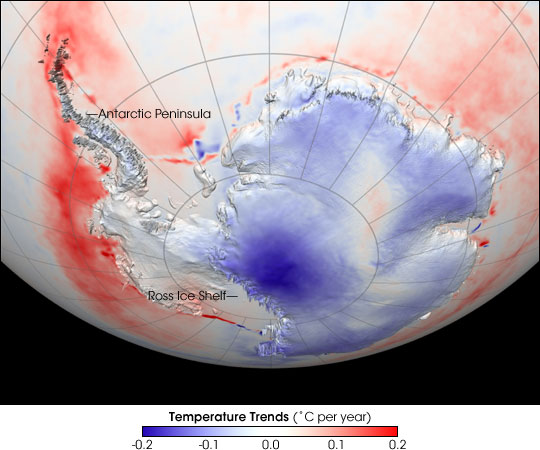
Over the 1982 – 2004 period depicted above, there is a very sharp contrast between observed temperature trends over the exceptionally reflective continuous permanent ice sheet in Antarctica (cooled when average cloud cover decreased over that particular period) versus the less reflective surrounding ocean even a short distance away (warmed when cloud cover decreased).
Another NASA graph shows the past century of temperature variation on the opposite end of the world, the Arctic (which warmed far more in the late 20th century than more tropical regions):

Source:
http://earthobservatory.nasa.gov/Features/ArcticIce/Images/arctic_temp_trends_rt.gif
As can be seen, there was major decline in temperatures from the 1930s to the 1960s. CO2 emissions went up constantly meanwhile, in utter lack of correlation not fitting the theory of CO2 being the primary climate driver. What does fit for more correlation there is solar activity, both solar irradiance and the solar-driven interplanetary magnetic field affecting
comic rays:
Sources: http://www.appinsys.com/globalwarming/GW_Part6_SolarEvidence.htm
Even on a time scale of a century, CO2 trends do not correlate with temperature well. What about very “long” timescales in geological terms? Back in 2001, a study of atmospheric carbon dioxide levels for the last 500 million years (Rothman, MIT) remarked:
“Because the long-term evolution of carbon dioxide levels depends similarly [to a strontium-isotope record] on weathering and magmatism, the relative fluctuations of CO2 levels are inferred from the shared fluctuations of the isotopic records. The resulting CO2 signal exhibits no systematic correspondence with the geologic record of climatic variations at tectonic time scales.”
On those extreme long time scales, atmospheric CO2 levels are driven largely by geological processes other than the temperature-dependent release of CO2 from the ocean predominant on “medium” time scales. Accordingly there is lack of correlation between CO2 and temperature. The prior study also noted apparent long-period climate fluctuations, of around 135 million years, existing from some cause, with cycling between warm and cool modes several times over the past 600 million years.
Others have guessed that cause. Inthe words of Dr. Antonino Zichichi, president of the World Federation of Scientists:
“In the last half billion years, earth has lost, four times, its polar caps: no ice at the North Pole and none at the South Pole. And, four times, the polar caps were reconstituted. Man did not exist then, only the so-called cosmic rays, discovered by mankind in the early twentieth century. The last cosmic ice age started 50 million years ago when we entered into one of the galaxy arms.”
A non-coincidental match between a climate cycle of near 140 million years and the time it takes the Solar System to pass between spiral arms of the galaxy was observed by Dr. Shaviv after reconstructing past cosmic ray variation from iron meteorites:

Source: http://sciencebits.com/files/pictures/climate/crcFig5.jpg
Everything from ozone change to volcanoes, human activities, and ocean cycles has a non-zero effect on climate, but much of temperature history fits together well if changes in cosmic rays and solar activity have a major effect on climate. The preceding contrasts with those who would assume CO2 to be the primary climate driver and who, in practice, predominantly simply entirely ignore the effect of cosmic rays (aside from the occasional attempt at rebuttal to justify continuing to ignore them), acting as if solar activity variation only mattered for direct irradiance alone.
However, claims about massive forcing from CO2 variation have always been based not on its direct observed spectral effect but upon hypothetical major net positive feedback from water vapor vastly amplifying CO2’s small direct effect. Evidence supports rather a climate system with low climate sensitivity, with predominantly negative feedback.
Pamela Gray says:
April 12, 2012 at 6:22 am
Volker, your mechanistic climate-Solar correspondance appears to be cloudy. Care to be clear on what it is? Exactly? With maths? And models? With a bit of physical science thrown in perchance? And maybe narrowed down to just one of your suggestions? In classical debate, Leif wins this hands down. You, on the other hand, appear to be handwaving.
Hi Pamela,
I think you misunderstand the plot. First I’m a guest here in the room of Anthony, and so I think it is not the right place to write a long dissertation about my discovery. Second it needs only the standard knowledge of the science of astronomy to understand heliocentric synodic solar tide functions. Because of this it becomes clear that is a thing which can verified with astronomical knowledge. Especially the solar (heliocentric) tide function of the main couple of Pluto and Quaoar is relating to the highest temperature anomalies with a frequency of 1/913.5 y-1 . It is shown here in a number of graphs that the relation of spring tide functions to global warm times and vice versa the relation of nip tide functions to global cold times as the LIA is true over several 1000 years. The very point you may misunderstand is that it is not my duty to give a prove that the shown astronomic function is correct; it is the very duty of the members of the science community. This is to be understood, because it is the rule in science, claimed astronomic functions, which are suspect to the other to refute as wrong. Since this is not done, I think I must not discuss further on this matter.
For You. There is an important point on this matter which is ruled by the sciences of philosophy. It reads that the sciences of metaphysics like logic, geometry, maths are the basis of science. In this view physics is like a religion or a belief system. There are some great insights in physics like the sayings in thermodynamic, but a lot of ancient idols like space, time, causality, or velocity, which are claimed to be holy, still never has proves as physical observables. Near to me on my desk is a 966 pages book written by Isaac Newton and it is interesting what he tells about gravity and density. But I have found nothing about the fact, that the (measured) gravity is decreased while the moon eclipses the sun. The density of Quaoar is most high of the objects behind Neptune, and although the temperature of Quaoar is only ~ 50K (-223 °Cel) it must have eras given where the objects must heated up over ~150K because of the measured crystalline ice on it. The fits I have done to the magnitude of the several solar tide function from the different couples have its best matches taking the density of the objects involved into account. The simple point is Sir Newton’s inverse quadratic gravitation has nothing to do with these tide like magnitudes, and I have no time to fight a mind fight on it with ignorant’s and followers of Sir Newtons law, while the geometric facts are still facts.
The other simple point is, I have a valid tool (given to public) to calculate the global climate in month resolution from the solar tide functions for the whole next millennium, Leif has not.
V.
Leif Svalgaard says:
Legatus says:
April 11, 2012 at 2:41 pm
The important words here are “a century ago”.
Sunspots, Geomagnetic activity, Magnetic fields on the sun, UV radiation have all been well measured over the entire last century. So, we cannot blame anything on ‘poor’ data. And there were several good [and physically valid] predictions of a low cycle 24 as far back as 2003.
The important words are “over the entire last century”. The entire last century did not include the Dalton or Maunder minimums or any other actually recognized period of named minimums. Therefore, we have yet to measure during an actualy minimum.
It may be that, if predictions are true, we are about to enter into an actual, real minimum. Then we will have our first chance to see and actually measure what an actual minimum looks like, and observe what effects (if any) it has. The current record breaking quiet sun may have all it’s records broken and then some if an actual real minimum happens with the next cycle.
What I am saying is that belief that a quiet sun has little or no effect doesn’t mean much, science is not about belief, it is about observation. <b.If we have an actual, real minimum, then we will, for the very first time, be able to actually observe it. Until then, we are not really doing a science of minimums, since we have never actually seen one.
Legatus says:
April 12, 2012 at 1:11 pm
The important words are “over the entire last century”. The entire last century did not include the Dalton or Maunder minimums or any other actually recognized period of named minimums. Therefore, we have yet to measure during an actualy minimum.
No, you are a bit too formalistic here. We have geomagnetic data back to the 1740s, and good solar data covering the named Gleissberg minimum 1890-1920. Also, there is good evidence that at every minimum the Sun returns to the same state which we have observed many times. The real issue is not what happens a minimum, but what happens at maximum and we may see in the future a replay of the Maunder Minimum. The Dalton minimum was not deep enough to be of interest.
Volker Doormann says:
April 12, 2012 at 10:49 am
I have a valid tool (given to public) to calculate the global climate in month resolution from the solar tide functions for the whole next millennium, Leif has not.
To put it mildly, I think you are deceiving yourself. Luckily, that may be the only one you can deceive.
Leif Svalgaard says:
April 11, 2012 at 3:32 pm
Just the usual straw man. The satellite data is not turning down: http://www.drroyspencer.com/latest-global-temperatures/
Well that was only half my argument. I see you one UHCSN adjustments, and raise you two RSS 😉
http://www.ncdc.noaa.gov/img/climate/research/ushcn/ts.ushcn_anom25_diffs_urb-raw_t.gif
ftp://ftp.ssmi.com/msu/graphics/tls/plots/rss_ts_channel_tls_global_land_and_sea_v03_3.png
ftp://ftp.ssmi.com/msu/graphics/tts/plots/rss_ts_channel_tts_global_land_and_sea_v03_3.png
Some people seem to have hoped this article would demonstrate absolutely all effects whatsoever of human activity could be ruled out, down to the tiny slice of climate fluctuations which is looking at tenths and hundredths of a degree in the past 2 or 3 decades (although what is seen is an astronomical contrast to the “public education” of the global warming alarmism movement which really tries to make the public think most climate history in the 20th century and far beyond was driven by CO2 primarily).
Such would not happen. Even this article, if you read it fully and closely, has remarks like “in marked contrast to reconstructions based on sunspot number [Solanki and Fligger, 1998 in which the irradiance and the temperature are not correlated after 1978” … as well as “everything from ozone change to volcanoes, human activities, and ocean cycles has a non-zero effect on climate.” Moreover, the heavily referenced cosmic ray theorist Professor Nir J. Shaviv of sciencebits.com in his papers does not argue that human emissions have 0.00 degrees effect but rather that they have had a small fraction of a degree Celsius effect.
In fact, for on the order of a degree Celsius or less temperature rise (aside from when overwhelmed by other factors) to occur from hypothetical future doubling of CO2 compared to pre-industrial levels matches the estimates of most of the very top skeptic scientists including Roy Spencer (google Spencer Global Warming 101) and Richard Lindzen. That reduces the warming from it to being minor and less than the Holocene Climate Optimum, a period warmer than now which the polar bears survived fine and which was beneficial to mankind, when warmth in near-arctic northern hemisphere regions increased vegetation as we can see in the fossil record.
A while back, someone posted somewhere on this website a graph of carbon-14 versus temperature in the years preceding and then up to the Maunder Minimum. I recall looking at it and noticing how there were essentially two lags, each of several years. There were three stages IIRC:
1) First, the final semi-regular solar cycle must peak.
2) Secondly, after several subsequent years of greater decline in solar activity, there is relatively extreme cumulative ramp-up in cosmic rays as seen in carbon-14 levels.
3) Thirdly, only then is there the really major temperature decline, after *another* several years lag.
Even assuming the predictions of a second Maunder Minimum coming soon (finally the end of the current Modern Maximum) turn out to be correctly (which they probably will), we are not in a Maunder Minimum yet. In fact, right now, solar activity is increasing at the moment as the current cycle 24 has not peaked quite yet. Anyway, if so, you can expect the doom of the global warming movement roughly around a decade from now, once really major temperature decline appears, too much to hide from the public even with data fudging, at which nobody will be get away as well with how their climate models implicitly treat cosmic rays as 0% effect by neglecting them entirely (an omitted variable fallacy). According to the estimates of Shaviv, during the Modern Maximum, the solar effect with cosmic rays included was around triple that of looking at TSI change alone, which fits observed results.
We can not predict the weather reliably so don’t expect anything about a single year or couple years at a time. I have never seen anybody utterly properly account for everything from cosmic rays to El Ninos all at once. Probably that is because it would take hundreds to thousands of pages to discuss, plus a huge number of manhours. Those with enough funding are environmentalists hardly inclined to do so, while skeptic scientists don’t have that level of funding and work more individually.
In fact, most skeptics seem to focus either on ocean cycles (like the AMO and PDO) or on solar activity / cosmic rays but not both at once. The fascinating question of how exactly they superimpose and relate is underanswered yet.
Personally, I periodically like to look at Spencer’s graph of UAH satellite temperatures:
http://www.drroyspencer.com/wp-content/uploads/UAH_LT_1979_thru_March_2012.png
Right now, the curved black line which is the purely-unofficial overall curve fit is just starting to curve down. Later this decade is when we should start to see true global cooling. In the next decade, it may become so blatant even to the public in direct consequences that the global warming enviropolitical movement collapses by some time in the 2020s. A second Little Ice Age doesn’t develop overnight.
peterhodges says:
April 12, 2012 at 4:40 pm
Well that was only half my argument.
There is a long way to go before we are down to 1900s level and so far you are just playing the adjustment game. I’ll still go with http://www.drroyspencer.com/wp-content/uploads/UAH_LT_1979_thru_March_2012.png where the thin black curve has no predictive value [for Henry Clark] according to Roy Spencer “The 3rd order polynomial fit to the data (courtesy of Excel) is for entertainment purposes only, and should not be construed as having any predictive value whatsoever”.
peterhodges says:
April 12, 2012 at 4:40 pm
Well that was only half my argument.
To present the whole of your argument you could overplot the satellite record you prefer on http://www.leif.org/research/SSN-SST-Disconnect.png
then let’s see.
Leif Svalgaard: Like I said, the “purely-unofficial overall curve fit.” I have read that remark before on the curve fit. Dr. Spencer is keeping himself legally or otherwise covered, and I don’t blame him. Anyway, just watch temperatures in the UAH data over rest of this decade and beyond; if they decline much after this solar cycle 24 peaks followed by the two several-year lags combined, the averaged-out curve line on top of the short-term temperature readings won’t even be needed to see what happens.
sunshinehours1 says:
April 11, 2012 at 4:27 pm
Too many people have fallen into the warmenist trap. CO2 is not the only GHG.
What happens when you melt ice? More H2O in the atmosphere.
Why didn’t this paper use water vapor and methane proxies too?
CO2 is not the #1 or only GHG. And knowing that dry areas cool off quickly at night (deserts) and humid areas do not, Co2 is quite impotent.
_____________________________
Why didn’t this paper use water vapor and methane proxies too? That is easy. CO2 is the byproduct of energy generation unless you use nuclear. Therefore you want to target CO2 not methane or water if you want to grab control of the world economy.
It is no coincidence that in 1970 Kissinger said “Who controls the energy controls nations, who controls the food supply controls the people, who controls money controls the world.” and in 1972 Maurice Strong chaired the First Earth Summit and the began the global warming craze.
Nothing but a political motive can explain the consistent refusal by government funded scientists to entertain anything by a minute amount of a trace gas as THE CONTROL KNOB of the climate.
Henry Clark says:
April 12, 2012 at 5:38 pm
Anyway, just watch temperatures in the UAH data over rest of this decade and beyond; if they decline much after this solar cycle 24 peaks followed by the two several-year lags combined, the averaged-out curve line on top of the short-term temperature readings won’t even be needed to see what happens.
It has a long way to drop to get down to the 1900s level. And you miss my point: The evidence NOW is what we have to judge, not what we think, hope, or wish it will be beyond this decade. If the temperature in the 2030s drop to the level of the 1900s, then I might revise my opinion [if still alive by then], but for now the ‘evidence’ is not convincing.
Leif Svalgaard says:
April 12, 2012 at 5:51pm
“The evidence NOW is what we have to judge, not what we think, hope, or wish it will be beyond this decade. If the temperature in the 2030s drop to the level of the 1900s, then I might revise my opinion [if still alive by then], but for now the ‘evidence’ is not convincing.”
But convincing of what exactly? As noted in the first of my two recent comments, Nir J. Shaviv’s research is not that variation in cosmic rays accounts for 100.0% of past climate fluctuations but rather that it plus solar irradiance variation has around 3 times the effect of solar TSI variation alone, multiple times more than IPCC models which implicitly treat GCRs as 0% effect.
He has never claimed that El Ninos, Milankovitch cycles, anthropogenic GHGs, and much else have not existed or have not had effects on climate too.
Your argument in comments about sunspot number and temperature divergence corresponds to the article’s quote of “reconstructions based on sunspot number [Solanki and Fligger, 1998 in which the irradiance and the temperature are not correlated after 1978.”
The effect of incorporating the cosmic ray theory into analysis of a wide range of timeframes up to hundreds of millions of years back is illustrated on Nir J. Shaviv’s site at http://www.sciencebits.com/OnClimateSensitivity
John Kehr made a good post destroying the paper:
Flagrant Attempt to Mislead the Public about the Holocene Onset
http://theinconvenientskeptic.com/2012/04/flagrant-attempt-to-mislead-the-public-about-the-holocene-onset/
Henry Clark says:
April 12, 2012 at 6:21 pm
But convincing of what exactly? As noted in the first of my two recent comments, Nir J. Shaviv’s research is not that variation in cosmic rays accounts for 100.0% of past climate fluctuations but rather that it plus solar irradiance variation has around 3 times the effect of solar TSI variation alone, multiple times more than IPCC models which implicitly treat GCRs as 0% effect.
If the solar variations cannot explain climate the past 200 years [or the past 30 years] I doubt that we have the ability to do that for millions of years past. TSI is only known back to 1978 so I’m not so sure that the ‘finding’ you cite is solid. The TSI we know of has a solar cycle effect of 0.07 degrees and is cyclic with no trend, so 3 times that is 0.2C cyclic with no trend. Is that what you are claiming?
Cosmic rays, galactic and otherwise, not only form condensation nuclei; they convert nitrogen to 14C. Enough of this and you get a heavy greenhouse gas with a half-life of, I forget,5000 years?
Anyway this stuff reverts back to nitrogen leaving no trace because the critters prefer 12C.
The Spiral Arm cycle is the precession of the eliptic, the orbital cycle Milankovitch was unaware of.
The dates change all the time, but the Sturtian glacial period was about 710mya, the Marinoan about 635mya, the Ordovician about 450mya, the Carbo-Permian about 300mya, and the Pleistocene about 2mya. Small statistical sample, but no apparent beat. The Pleistocene thus far (I do not recognize the Holocene or the Anthropocene) has not bottomed as low as the Paleozoic glaciations.
Who is Michael Pacnik? What is his area of expertise?
gymnosperm says:
April 12, 2012 at 11:19 pm
Cosmic rays, galactic and otherwise, not only form condensation nuclei; they convert nitrogen to 14C. Enough of this and you get a heavy greenhouse gas with a half-life of, I forget,5000 years?
The total global production of 14C is 17 pounds per year.
The reasons for a lack of correlation with CO2 are explained in my paper, so it is perhaps relevant to summarise some of the main points in the paper, and add further explanation, such as that regarding microwave ovens. This should answer questions raised above. However, any who advocate that all radiation causes a transfer of thermal energy regardless of the temperatures of the source and target, or that there is some entity representing “net” radiation are asked to read the paper for my response.
Of course radiation can go in all directions. It does so in a microwave oven, but not everything gets warmed in the oven by normal atomic absorption. In fact there is absolutely no atomic absorption involving changes in electron energy states. Instead, liquid water molecules in the food are quickly rotated (flipped or “snapped”) through 180 degrees twice with each passing wave of radiation. It is molecular friction which warms the water, not atomic absorption such as happens in the Sun. The molecules in ice are too close to rotate, so ice is not melted this way. (See experiment in an earlier post above.) The defrost cycle turns power on and off in order to allow time for heat conduction from water to ice. The oven demonstrates that low frequency radiation does not act like high frequency radiation, even if the intensity (flux) is greater.
This is because of the main hypothesis in the paper that radiated energy from a source which is cooler than a target is not absorbed and converted to thermal energy by such changes in electron energy states at the atomic level. If the radiation from such a source is spontaneous, then the peak frequency in its Planck curve is proportional to its absolute temperature by Wien’s Displacement Law. If thermal energy were transferred from such a cooler source to a warmer target then that process, if independent, would violate the Second Law of Thermodynamics (SLoT.) There are several pages in the paper explaining why this is the case, so I ask you to read Sections 1 to 5 in this regard.
Radiated energy is not thermal energy. It has to be converted to thermal energy, and that only happens if the source of the radiation was warmer than the target. Some or all of the radiation can and will resonate with the target. When this happens it supplies energy to the target, yes, but the energy is used by the target to do some of its own radiating. It can use it because it is identical in frequency to what it can emit itself. And this happens because the Planck curve for a cooler body is always fully contained within that for a warmer body. So the two-way radiation which corresponds to the area under the Planck curve for the cooler body just resonates in each body and gives it energy that can only be used for new radiation. Because the new radiation is identical, it looks as if the original radiation has been scattered. Hence the term “pseudo scattering” or, as I call it in my paper, “resonant scattering.”
So the process is not in any way violating the Second Law of Thermodynamics (SLoT) because the radiated energy is never converted to thermal energy. However, there is additional radiation in the warmer body which corresponds to the area between the Planck curves. This is the energy which does get converted to thermal energy in a cooler target. And, since S-B calculations are based on the integrals of Planck functions, the normal calculations (subtracting the two S-B values which represent areas under the large and small curve) still apply, because the difference is the area between the curves.
So you may think of radiation being scattered each time it strikes a target, but only “dropping off” some of its thermal energy when it meets a cooler target. The new radiation then continues just as if emitted by that target, so more thermal energy is only dropped off iff the next target is cooler than the last one.
Because the incident radiation supplied radiated energy to the cooler target, that target does not have to convert some of its own thermal energy in order to radiate what it is “allowed” to radiate as per the Planck function. Hence the target’s rate of radiative cooling will be slower, as we observe. So, yes, a wooden table in your back yard may stop dew forming on the ground below it because the table is warmer than the atmosphere and thus slows the cooling more. This is because gases in the atmosphere are cooler, and also because ones like carbon dioxide don’t radiate with a full Planck spectrum. Instead they just have a few spectral lines of radiation which can resonate with the surface. So carbon dioxide is like a picket fence with most of its pickets missing, standing up against a full flood of radiation from the surface. Even water vapour molecules can do much better when it comes to slowing radiative cooling of the surface.
Whilst the calculations are the same, there are huge differences in the physical consequences. These are explained in the FAQ’s in Appendix Q.7 of my paper. Because there is no conversion to thermal energy, there can be no subsequent heat transfer to other bodies instead of radiation. Hence, in the case of radiation from a cooler atmosphere, there can be no effect upon the rates of cooling by evaporation, conduction and other sensible heat transfer mechanisms. Nor is there any slowing of the radiation that gets through the atmospheric window to space. So only about a quarter of all the surface cooling is affected, and only by a minuscule amount by carbon dioxide with its limited range of frequencies.
Now, the temperature of the surface is stabilised by both the underground temperatures and, more importantly, the amount of solar radiation reaching the surface. The temperature gradient in the atmosphere is governed by the adiabatic lapse rate, and that in turn is controlled by the force of gravity. So, if that gradient is represented by a simple linear equation y = mx + b then m is fixed by gravity and b is controlled by solar insolation which only varies a little beyond our control. Thus surface climate is beyond our control and any slowing of the radiative cooling is simply compensated by an increase in sensible heat transfer.
So there is no overall slowing of the rate of surface cooling, no transfer of thermal energy from the atmosphere back to the surface, and so no greenhouse effect.
Leif Svalgaard:
April 12, 2012 at 8:58 pm
“If the solar variations cannot explain climate the past 200 years [or the past 30 years] I doubt that we have the ability to do that for millions of years past. TSI is only known back to 1978 so I’m not so sure that the ‘finding’ you cite is solid. The TSI we know of has a solar cycle effect of 0.07 degrees and is cyclic with no trend, so 3 times that is 0.2C cyclic with no trend. Is that what you are claiming?”
If an expectation was for a single factor to “explain” past climate in terms of account for 100.0% of its variation, climate would never, ever, ever be explained because no single factor is the only influence. Correlation as a major influence, though, extends up to, for example, that seen in Bond et al. 2001 ( one.geol.umd.edu/www/preprints/Bond_et_al.pdf ). Referring to periodic cold periods like the Little Ice Age but over a lengthier timespan than looking at the past several centuries alone, they note “our correlations are evidence, therefore, that over the last 12,000 years virtually every centennial time scale increase in drift ice documented in our North Atlantic records was tied to a distinct interval of variable and, overall, reduced solar output.”
They do not guess such is from cosmic rays in part in particular, unsurprising for multiple reasons including how its 2001 publication predates recent cosmoclimatology publications, but, as much as there are some who want to pretend the LIA correlation with solar activity was mere coincidence (like the recent paper for the purpose currently discussed on WUWT), the LIA was far from the only cold event in the Holocene with similar correlation.
Such as the Indian ocean graph in the article we are commenting on is far too much correlation to plausibly be coincidence.
Regarding trends or not, there are more than individual short solar cycles, beyond a typically ~ 11 year cycle. For instance, as Solanki et al. 2004 note:
“According to our reconstruction, the level of solar activity during the past 70 years is exceptional, and the previous period of equally high activity occurred more than 8,000 years ago.”
cc.oulu.fi/~usoskin/personal/nature02995.pdf
Of course, 8000 years ago was in the Holocene Climate Optimum, a warm period like this “does CO2 correlate with temperature history” article mentions including the link to http://www.esd.ornl.gov/projects/qen/nerc.html where the ORNL research in turn notes that “by 8,000 14C y.a., the Earth was under a full interglacial climate, with conditions warmer and moister than present in many parts of the world.”
Not particularly surprisingly for an article managing to get past the gatekeepers at the Nature journal, the Solanki et al. 2004 paper references another paper which said solar variation could not account for post-1970 warming, but, among other aspects of note (1) solar variation is not responsible for 100% of climate variation as I have always emphasized in these comments; the likes of the PDO, AMO, even GHGs, and other influences also exist (2) the particular figure was based on comparison to CRU temperature data, so its upper limit estimate on the effect of solar variation would indirectly not be a valid upper limit from my perspective. Those are not the only 2 things which could be noted, but they are part.
The amount of fraud going on with CRU temperature data, such as “adjustments” consistently predominantly the opposite direction of what any proper correction for urban heat island effects would constitute, is a whole giant other topic but familiar to some readers of Watts Up With That. (CRU was even infamous from Climategate). CRU temperature data has partial resemblance to reality, but enough skewing in quantitative terms to screw up an exact calculation.
captain pithart said:
April 13, 2012 at 1:20am
Who is Michael Pacnik? What is his area of expertise?
I don’t think that is said. But, in any case, the majority of what is said in the article comes from or relates to that at the sciencebits.com site (which is by Dr. Nir J. Shaviv, not the author of this article but author of that site). For checking references, the GISP 2 data is online at
ftp://ftp.ncdc.noaa.gov/pub/data/paleo/icecore/greenland/summit/gisp2/isotopes/gisp2_temp_accum_alley2000.txt
(Hopefully this is not a duplicate comment submission … connection issue briefly)
Leif Svalgaard said:
April 12, 2012 at 8:58 pm
“If the solar variations cannot explain climate the past 200 years [or the past 30 years] I doubt that we have the ability to do that for millions of years past. TSI is only known back to 1978 so I’m not so sure that the ‘finding’ you cite is solid. The TSI we know of has a solar cycle effect of 0.07 degrees and is cyclic with no trend, so 3 times that is 0.2C cyclic with no trend. Is that what you are claiming?”
If an expectation was for a single factor to “explain” past climate in terms of account for 100.0% of its variation, climate would never, ever, ever be explained because no single factor is the only influence. Correlation as a major influence, though, extends up to, for example, that seen in Bond et al. 2001 ( one.geol.umd.edu/www/preprints/Bond_et_al.pdf ). Referring to periodic cold periods like the Little Ice Age but over a lengthier timespan than looking at the past several centuries alone, they note “our correlations are evidence, therefore, that over the last 12,000 years virtually every centennial time scale increase in drift ice documented in our North Atlantic records was tied to a distinct interval of variable and, overall, reduced solar output.”
They do not guess such is from cosmic rays in part in particular, unsurprising for multiple reasons including how its 2001 publication predates recent cosmoclimatology publications, but, as much as there are some who want to pretend the LIA correlation with solar activity was mere coincidence (like the recent paper for the purpose currently discussed on WUWT), the LIA was far from the only cold event in the Holocene with similar correlation.
Such as the Indian ocean graph in the article we are commenting on is far too much correlation to plausibly be coincidence.
Regarding trends or not, there are more than individual short solar cycles, beyond a typically ~ 11 year cycle. For instance, as Solanki et al. 2004 note:
“According to our reconstruction, the level of solar activity during the past 70 years is exceptional, and the previous period of equally high activity occurred more than 8,000 years ago.”
cc.oulu.fi/~usoskin/personal/nature02995.pdf
Of course, 8000 years ago was in the Holocene Climate Optimum, a warm period like this “does CO2 correlate with temperature history” article mentions including the link to http://www.esd.ornl.gov/projects/qen/nerc.html where the ORNL research in turn notes that “by 8,000 14C y.a., the Earth was under a full interglacial climate, with conditions warmer and moister than present in many parts of the world.”
Not particularly surprisingly for an article managing to get past the gatekeepers at the Nature journal, the Solanki et al. 2004 paper references another paper which said solar variation could not account for post-1970 warming, but, among other aspects of note (1) solar variation is not responsible for 100% of climate variation as I have always emphasized in these comments; the likes of the PDO, AMO, even GHGs, and other influences also exist (2) such was based on comparison to CRU temperature data, so its upper limit estimate on the effect of solar variation would indirectly not be valid upper limit from my perspective.
The amount of non-accidental inaccuracy going on with CRU temperature data, such as “adjustments” consistently predominantly the opposite direction of what any proper correction for urban heat island effects would constitute, is a whole giant other topic but familiar to some readers of Watts Up With That. (CRU was even famous or infamous from climategate). CRU temperature data has partial resemblance to reality, but enough skewing to screw up an exact calculation.
Leif Svalgaard says:
April 12, 2012 at 5:04 pm
There is a long way to go before we are down to 1900s level and so far you are just playing the adjustment game.
Well it is nearly impossible to see where we would be without all the adjusting, value adding, and homogenizing. A look at
Raw data from individual sites can be revealing. At a minimum, warming trends dissapear and the present looks cooler than the first half of the last century.
I will agree with you that ultimately, we don’t really know where things are going, only what we have now.
But I will have to admit to a coolist prejudice…I did have to shovel out this morning and drive to work in a white out 😉
Henry Clark, you might like to look at this research by Richard Feynman’s sister: NASA Finds Sun-Climate Connection in Old Nile Records It looks at ancient Nile and auroral records.
http://www.woodfortrees.org/plot/rss/from:2002/plot/rss/from:2002/trend
Even the jury-rigged hadcrut etc show cooling. Will it continue? I guess we’ll see…
Henry Clark says:
April 13, 2012 at 8:43 am
Regarding trends or not, there are more than individual short solar cycles, beyond a typically ~ 11 year cycle. For instance, as Solanki et al. 2004 note:
“According to our reconstruction, the level of solar activity during the past 70 years is exceptional, and the previous period of equally high activity occurred more than 8,000 years ago.”
I’m not trying to convince you of anything. Experience shows that in the game it is impossible to overthrow entrenched dogmas by rational arguments or reliable data. I was bringing forward the reasons why I am not convinced by the multitude of claims [Hoyt and Schatten list ~2000 papers proving sun-weather-climate correlations]. Take for example the one you refer to by Solanky. There is ongoing research giving good reasons why that claim does not hold. I refer to some of that here: http://www.leif.org/research/The%20long-term%20variation%20of%20solar%20activity.pdf
Next month the researchers active in this field are holding a workshop in Switzerland to discuss this problem [to ‘settle’ the science if we can]: http://www.leif.org/research/Svalgaard_ISSI_Proposal_Base.pdf so more on this a bit later.
(1) solar variation is not responsible for 100% of climate variation as I have always emphasized in these comments
The 100% is a bit of a straw man. some people would say 90% or 70%. That would satisfy your criterion, but there is no real difference between 100% and 70%. I would go along with 10% for solar and 10% for CO2.