Guest post by Michael Pacnik
Especially in the context of recent discussion of the Shakun et al. paper, a look at other sources for temperature history versus CO2 can be helpful, examining timescales ranging from the past century to the past 11000 years and even the past 500 million years.
Recent discussion of the Shakun et al. (Nature 2012) paper has illuminated issues in its presentation of the history of CO2 versus temperature (commentaries here, here, here, and here).
In addition to those investigations, another helpful approach may be to take a step back and cross-check with other sources. In general, does CO2 correlate with temperature in climate history?
The answer is often yes on “medium” timescales, but no on “short” timescales and also no on the very longest timescales of all. If one looks at all three timescales, overall observations are consistent with temperature rise causing the oceans to release part of their dissolved CO2 after substantial lag time, yet not consistent with CO2 being the primary driver of climate.
Over the past few hundred thousand years of ice core data, a “medium” time
scale in this sense, CO2 superficially appears to change in step with
temperature if a graph is so zoomed out as to not show sub-millennial time
scales well:

Source: http://www.brighton73.freeserve.co.uk/gw/paleo/400000yearslarge.gif
Yet, what about a closer look at a “short” time scale, the past few thousand years instead?
Showing from 200 to 11000 years ago, the subsequent graph is based on ice core data, readily visible in files hosted on the servers of the U.S. National Oceanic and Atmospheric Administration (NOAA): GISP 2 and EPICA Dome C:

Source:
A lack of correlation between temperatures (in the above from a Greenland ice core) and atmospheric CO2 becomes very apparent at that timescale and level of detail.
With the focus on the bulk of the past 11000 years of the Holocene, the most recent rise in CO2 is not shown in the preceding because the EPICA ice core data ends in 1777 A.D., while the GISP 2 ice core temperature data extends up to a century ago.
Greenland is relatively indicative of changes in Northern Hemisphere temperature over time. Throughout the Holocene, warm periods have tended to have more warming in the upper Northern Hemisphere than nearer the equator (including the Modern Warm Period, a.k.a. global warming).
In the prior chart, much of around 7000 to 8000 years ago was particularly warm, more so than now. Such was part of the Holocene Climate Optimum. Research at Oak Ridge National Laboratory remarks (bolding added):
“By 8,000 14C y.a., the Earth was under a full interglacial climate, with conditions warmer and moister than present in many parts of the world. Tropical forest in Africa (and probably also Asia) was expanded in area, and the areas of desert in Africa and Asia were much reduced.”
Source: http://www.esd.ornl.gov/projects/qen/nerc.html
In fact, that atlas of palaeovegetation led to a conclusion which may surprise those used to hearing claims of how global warming would mean overall more deserts: When the climate was warmer, overall desert extent was actually less (because the ocean surface, 70% of Earth’s area, was warmed as well as land, causing more thermal-driven evaporation and circulation through rainfall of water onto land). Conversely, there was far greater
desert extent 18000 years ago during the cold Last Glacial Maximum, including polar deserts which are cold but have a lack of precipitation.

Sources: http://www.esd.ornl.gov/projects/qen/nerc.html
However, at the “short” time scales in the last ice core graph, showing fluctuations down to relatively small fractions of a millennia, atmospheric temperatures over Greenland would not be the same as ocean temperatures far below the surface, as the ocean depths can take centuries to warm much.
Only at greater time scales is there time for even seawater thousands of meters deep to fully warm and release more CO2. Accordingly, only at greater “medium” time scales does CO2 and temperature correlate highly, as can be seen contrasting the 400,000-year graph to the 11,000-year graph.
Evidence for how CO2 in ice core data lags temperature by centuries has been discussed before at Watts Up With That, including articles in 2009 by Frank Lansner and R. Taylor.
A simple Henry’s Law formula is applicable to a glass of water on a table releasing more previously-dissolved gas when warmed, but it is not literally valid when there are chemical reactions with the solute (CO2). The oceans are a far more complex system in general. However, still, more CO2 is released eventually when the planet warms. The atmosphere and the ocean surface (or shallow zones) warms much first, then deeper waters later.
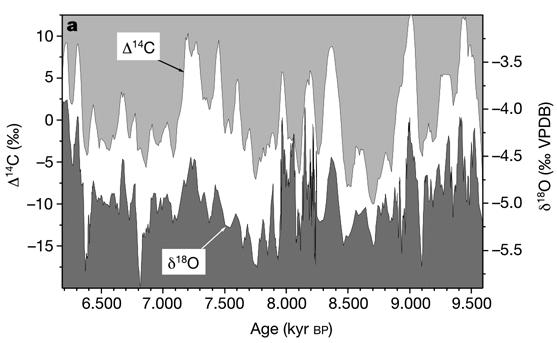
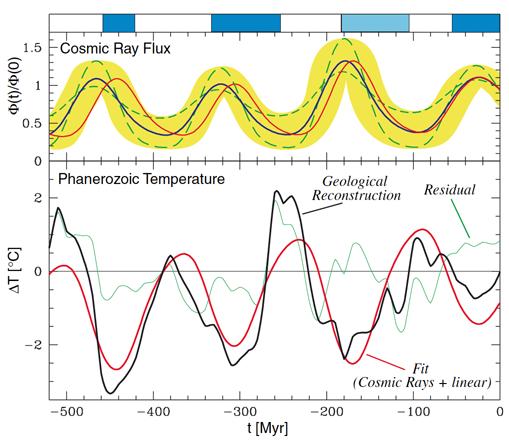
If CO2 does not usually correlate well with temperatures on the scale of variation over shorter time intervals, what does? A look at a reconstruction of Indian ocean temperatures is fitting:

Source: http://sciencebits.com/files/pictures/climate/crcFig1.jpg
Such is showing the history of temperature versus cosmic ray flux. The Oxygen-18/Oxygen-16 isotope ratio is a common temperature proxy, where the trends in it correspond to the trends in temperature.
Many papers describe Carbon-14 as a solar activity proxy, which it is indirectly, aside from some caveats on other time scales than depicted here. However, more directly, it is a cosmic ray proxy. Aside from more recent artificial sources, 20th-century atmospheric nuclear tests, carbon-14 is a cosmogenic isotopeproduced in nature by cosmic rays.
On these time scales, most variation in incoming galactic cosmic ray flux is caused by changes in the solar-driven interplanetary magnetic field. Those changes have a major relationship to sunspot trends but are not exactly identical in timing. For example, the authors of a paper by NASA’s JPL remark (terminology clarification in brackets added):
“Cliver et., (1998) has compared the minimum aa [index of geomagnetic activity] values with the Earth’s surface temperature record and found a correlation of 0.95 between the two data sets starting in 1885. The solar irradiance [solar activity] proxy developed from the aa minima continues to track the Earth’s surface temperature until the present (Cliver et al., 1998).
This is in marked contrast to reconstructions based on sunspot number [Solanki and Fligger, 1998 in which the irradiance and the temperature are not correlated after 1978. In a study of 14C [Carbon-14 history] Stuiver and Quay (1980) found that the cosmic ray flux at the magnetopause was anticorrelated with [the] aa [index of geomagnetic activity].”
With that said, there is significant correlation between sunspot number trends and temperature in many time periods, provided that an appropriate temperature indicator is utilized. One example is the following chart from the NOAA archive for 1860 – 1985, where the global mean sea surface temperature trend (SST) is fortunately not skewed by Urban Heat Island (UHI) effects on land:

Source: http://www.oar.noaa.gov/spotlite/archive/images/sunclimate_3b.gif
However, as noted previously, trends in the aa index of geomagnetic activity
display even better correlation than sunspot trends to terrestrial temperatures. When the aa index of geomagnetic activity rises, more galactic cosmic rays are deflected in interplanetary space, and fewer cosmic rays reach Earth.
The following shows correlation between temperature and Be-10 over the latter part of the Little Ice Age and then into the 20th-century Modern Warm Period:

Source:
http://www.appinsys.com/globalwarming/GW_Part6_SolarEvidence_files/image009.gif
The Be-10 cosmogenic isotope is frequently labeled a solar activity proxy, which is true, but, once again, it is also and more directly a cosmic ray proxy.
On the short term, solar activity in terms of total solar irradiance (TSI) changes only by around 0.1% typically over solar cycles, but the interplanetary magnetic field varies vastly more in percentage terms, with correspondingly substantial changes in cosmic ray flux.
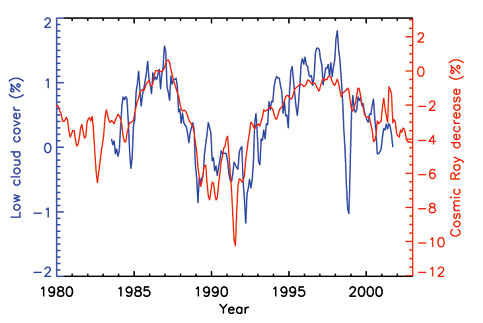
On Earth, tropospheric ionization changes by typically 5% over a single solar cycle (Shaviv, 2005). Global cloud cover has been observed to vary 3-4% in a solar cycle in a manner strongly correlating with cosmic ray flux change (Svensmark, 1997).
Cosmic rays are minuscule in direct energy delivered compared to sunlight but can seed clouds. Evidence supporting how cosmic rays contribute to cloud condensation nuclei has been discussed at Watts Up With That previously, including a last month’s update.
Some common mistakes can lead to missing observation of the effect of cosmic rays, discussed by Dr. Shaviv in remarks on the Hebrew University debate, another debate,
and a recent paper. (Also, counterintuitively, fluctuations in galactic cosmic ray flux matter little for the highest altitude clouds but more for lower altitude clouds, because the former are in an enviroment where GCRs are always in relative surplus and not the limiting nutrient, so to speak).
However, if those mistakes are all avoided, substantial correlation can be seen between cosmic ray flux variation and cloud cover variation, such as this illustration (discussed more at Dr. Shaviv’s site, following Marsh & Svensmark 2003):

Source: http://sciencebits.com/files/pictures/climate/crcFig3.jpg
There are other examples. For instance, as might be expected from cosmic ray variation slightly modifying average cloud cover, a study from a much different source notes a relationship between galactic cosmic radiation and tree rings:
“There was a consistent and statistically significant relationship between growth of the trees and the flux density of galactic cosmic radiation. Moreover, there was an underlying periodicity in growth, with four minima since 1961, resembling the period cycle of galactic cosmic radiation. We discuss the hypotheses that might explain this correlation: the tendency of
galactic cosmic radiation to produce cloud condensation nuclei, which in turn increases the diffuse component of solar radiation, and thus increases the photosynthesis of the forest canopy.”
An article by Dr. Svensmark on cosmoclimatology is excellent reading:
Cosmoclimatology: A new theory emerges (PDF)
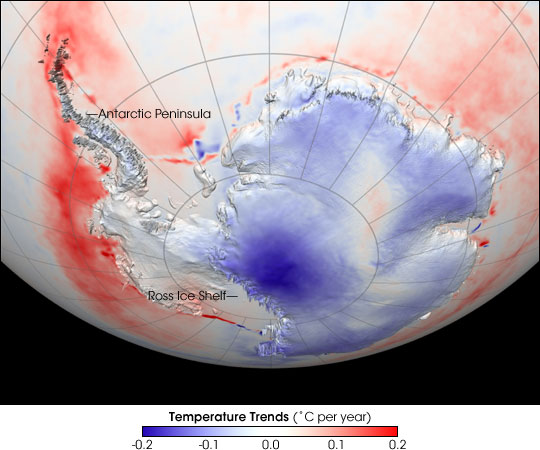
As implied there, a relative smoking gun of evidence exists for variations in cloud cover driving much of temperature change: Usually low-level cloud cover cools the surface, but cloud cover over the Antarctica ice sheet itself is the opposite situation, because the ice is such a particularly high albedo as to be literally more white (more reflective) than the cloud tops. The following NASA graph indirectly provides a rather good illustration if interpreted in that context:

Source:
http://eoimages.gsfc.nasa.gov/images/imagerecords/6000/6502/antarctic_temps.AVH1982-2004.jpg
Over the 1982 – 2004 period depicted above, there is a very sharp contrast between observed temperature trends over the exceptionally reflective continuous permanent ice sheet in Antarctica (cooled when average cloud cover decreased over that particular period) versus the less reflective surrounding ocean even a short distance away (warmed when cloud cover decreased).
Another NASA graph shows the past century of temperature variation on the opposite end of the world, the Arctic (which warmed far more in the late 20th century than more tropical regions):

Source:
http://earthobservatory.nasa.gov/Features/ArcticIce/Images/arctic_temp_trends_rt.gif
As can be seen, there was major decline in temperatures from the 1930s to the 1960s. CO2 emissions went up constantly meanwhile, in utter lack of correlation not fitting the theory of CO2 being the primary climate driver. What does fit for more correlation there is solar activity, both solar irradiance and the solar-driven interplanetary magnetic field affecting
comic rays:
Sources: http://www.appinsys.com/globalwarming/GW_Part6_SolarEvidence.htm
Even on a time scale of a century, CO2 trends do not correlate with temperature well. What about very “long” timescales in geological terms? Back in 2001, a study of atmospheric carbon dioxide levels for the last 500 million years (Rothman, MIT) remarked:
“Because the long-term evolution of carbon dioxide levels depends similarly [to a strontium-isotope record] on weathering and magmatism, the relative fluctuations of CO2 levels are inferred from the shared fluctuations of the isotopic records. The resulting CO2 signal exhibits no systematic correspondence with the geologic record of climatic variations at tectonic time scales.”
On those extreme long time scales, atmospheric CO2 levels are driven largely by geological processes other than the temperature-dependent release of CO2 from the ocean predominant on “medium” time scales. Accordingly there is lack of correlation between CO2 and temperature. The prior study also noted apparent long-period climate fluctuations, of around 135 million years, existing from some cause, with cycling between warm and cool modes several times over the past 600 million years.
Others have guessed that cause. Inthe words of Dr. Antonino Zichichi, president of the World Federation of Scientists:
“In the last half billion years, earth has lost, four times, its polar caps: no ice at the North Pole and none at the South Pole. And, four times, the polar caps were reconstituted. Man did not exist then, only the so-called cosmic rays, discovered by mankind in the early twentieth century. The last cosmic ice age started 50 million years ago when we entered into one of the galaxy arms.”
A non-coincidental match between a climate cycle of near 140 million years and the time it takes the Solar System to pass between spiral arms of the galaxy was observed by Dr. Shaviv after reconstructing past cosmic ray variation from iron meteorites:

Source: http://sciencebits.com/files/pictures/climate/crcFig5.jpg
Everything from ozone change to volcanoes, human activities, and ocean cycles has a non-zero effect on climate, but much of temperature history fits together well if changes in cosmic rays and solar activity have a major effect on climate. The preceding contrasts with those who would assume CO2 to be the primary climate driver and who, in practice, predominantly simply entirely ignore the effect of cosmic rays (aside from the occasional attempt at rebuttal to justify continuing to ignore them), acting as if solar activity variation only mattered for direct irradiance alone.
However, claims about massive forcing from CO2 variation have always been based not on its direct observed spectral effect but upon hypothetical major net positive feedback from water vapor vastly amplifying CO2’s small direct effect. Evidence supports rather a climate system with low climate sensitivity, with predominantly negative feedback.
sunshinehours1 says:
April 11, 2012 at 11:32 am
Leif: “Your argument is essentially that there are no decadal/century changes in climate because we don’t see them deep underground. ”
That isn’t my argument at all.
I read your argument as invoking a lag as so many others [if you don’t then I don’t follow you]. But if you do [and for all the whiners about lags and glorious correlations, here is my version of the 5th figure of the current thread: http://www.leif.org/research/SSN-SST-Disconnect.png
I updated the graph to the present and overplotted the SST [grey curve] and SSN [green]. Any lag would be less than a solar cycle if you want to contend there is a strong correlation and the correlation simply breaks down after 1980 [see red rectangle: green curve goes down to where it was around 1900, grey curve continues up].
So, I ask why nobody commented on that Figure [small lag, breakdown after 1980]? Hide the increase, perhaps. Or confirmation bias: it showed what you want to believe. At least, I’m not that gullible.
BTW, the claim that the Sun is responsible for most of climate variation is one of the strongest weapons in the AGW crew’s arsenal [explains variations before SUVs] and the disconnect in 1980 is proof positive of AGW. I’m at a loss, why opponents of AGW are playing into the AGW hands by conceding to them that weapon. Especially since the effects are as shaky as AGW, go figure…
Leif Svalgaard said:
> All that solar/geomagnetic/cosmic ray stuff related to temperature
> is simply falsified by recent data: the sun is now as quiet as it was
> a century ago, geomagnetic activity and interplanetary magnetic
> fields are at record lows, cosmic rays at record high, and yet
> temperatures are much warmer now than a century ago.
Leif,
Look at the recent Shakun paper — the graph of CO2 vs. combined temperature proxies taken from sources other than the ice cores (which generated the CO2 data) shows global temperatures rising SEVERAL HUNDRED years after CO2 is seen to increase.
Setting all the problems with the paper aside, let’s assume the observations from the Shakun paper believable.
By your logic, you should also believe that the several hundred years delay that occurs before temperatures are seen to increase falsifies the presumption that CO2 was the cause of the temperature increase at the end of last Pleistocene glaciation. True?
Extending your logic, then looking into paleoclimate observations, temperature increases should be observed as simultaneous with all corresponding increases in atmospheric CO2. Any deviation in this correlation, either forwards or backwards in time, falsifies the link between CO2 and global temperature. Correct?
http://wattsupwiththat.com/2012/04/08/did-shakun-et-al-really-prove-that-co2-precede-late-glacial-warming-part-1/
Only one remark here: I do agree (this time) with William Connolley that the temperature proxy graph is for the NH only, which is more land based, while CO2 releases are mainly ocean based. That is the reason that the temperature/CO2 graphs from jigh altitude inland Antarctic ice cores do show a much better correlation.
The MWP-LIA difference of ~0.8°C is visible in the medium-resolution (40 years) Law Dome DSS ice core with a lag of ~50 years after the onset of the cooling:
http://www.ferdinand-engelbeen.be/klimaat/klim_img/law_dome_1000yr.jpg
That gives about the same 8 ppmv/°C change in CO2 levels after temperature changes as over the glacials/interglacials for the past 800 kyr.
Max Phillis says:
April 11, 2012 at 12:56 pm
falsifies the link between CO2 and global temperature.
I think I have said several times that IMHO neither CO2 nor the Sun is responsible for the observed climate changes, so what are you trying to say or imply?
A+ for consistency then.
This article is why I read WUWT.
Spotless sun today
http://www.landscheidt.info/?q=node/50
Excellent article, thanks for the Paleoclimate link.
Leif Svalgaard says:
April 11, 2012 at 12:53 pm
…and the disconnect in 1980 is proof positive of AGW…
The entirety of which is adjusted in. Unless you are talking satellite data, which is indeed turning down.
Leif Svalgaard says:
All that solar/geomagnetic/cosmic ray stuff related to temperature is simply falsified by recent data: the sun is now as quiet as it was a century ago, geomagnetic activity and interplanetary magnetic fields are at record lows, cosmic rays at record high, and yet temperatures are much warmer now than a century ago. This does not mean that the rise is man made, just that it is not solar made.
The important words here are “a century ago”. Our actual detailed measurements of things like cosmic rays are over a small time scale, they do not include the Dalton or Maunder minimum even, much less older minimums. However…there is considerable evidence that the next solar cycle (when it ever gets here) will be a true minimum, perhaps about equel to the Dalton. Then we should be able to tell if a truly quiet sun makes for significant cooling.
Basically, we have not seen a sun quiet enough to count as really quiet, the minor variations we have seen over the last 100 years are just that, minor. If the sun really does go named minimum style quiet in a few years, then and only then will we be able to tell what effectsa a true quiet sun has on climate.
Of course, that’s an if, I have seen predictions before of what people were sure the sun would do, so far, few have been true. The only recent prediction, however, was of a queiter sun when everyone else predicted a noisy one, which then predicted a true minimum (as different from the very minor variations of the last 100 years) in a few years.
The good news, if this prediction of a truely quiet sun come true, Leif will have something really new to observe.
Leif,
Having just finished solar cycle 23, isn’t it a little premature to use projections for cycles 24 and 25 as indications of a dramatic drop in sunspot activity? It hasn’t occurred yet, let alone had time enough for thermal lag effects to show any temperature response.
peterhodges says:
April 11, 2012 at 2:27 pm
Unless you are talking satellite data, which is indeed turning down.
Just the usual straw man. The satellite data is not turning down: http://www.drroyspencer.com/latest-global-temperatures/
Legatus says:
April 11, 2012 at 2:41 pm
The important words here are “a century ago”.
Sunspots, Geomagnetic activity, Magnetic fields on the sun, UV radiation have all been well measured over the entire last century. So, we cannot blame anything on ‘poor’ data. And there were several good [and physically valid] predictions of a low cycle 24 as far back as 2003.
bones says:
April 11, 2012 at 2:48 pm
Having just finished solar cycle 23, isn’t it a little premature to use projections for cycles 24 and 25 as indications of a dramatic drop in sunspot activity? It hasn’t occurred yet, let alone had time enough for thermal lag effects to show any temperature response.
We are nearing maximum of cycle 24 and experience shows that once we have 3-4 years of data at the beginning of a cycle, the rest of the cycle is pretty well determined. Cycle 25 will likely be small too, but that is not critical to the argument.
bones says:
April 11, 2012 at 2:48 pm
let alone had time enough for thermal lag effects to show any temperature response.
If you look t all the papers cited, they all show a time lag of less than one solar cycle, so time lags are not important as activity has been ebbing for decades.
Ignoring whether CO2 causes or contributes to warming out of a glacial phase, the first graphic clearly shows that during the cooling out of an interglacial, CO2 lags temperatures, and thus doesn’t prevent cooling.
Its obvious but the effect of CO2 should be the same irrespective of whether the climate is warming or cooling. If CO2 is the primary driver of the warming phase then what over-rides it to cause the cooling? Milankovitch Cycles shouldn’t be enough on a 100k year cycle.
Too many people have fallen into the warmenist trap. CO2 is not the only GHG.
What happens when you melt ice? More H2O in the atmosphere.
Why didn’t this paper use water vapor and methane proxies too?
CO2 is not the #1 or only GHG. And knowing that dry areas cool off quickly at night (deserts) and humid areas do not, Co2 is quite impotent.
“Wind-driven upwelling in the ocean around Antarctica helps regulate the exchange of carbon dioxide (CO2) between the deep sea and the atmosphere, as well as the supply of dissolved silicon to the euphotic zone of the Southern Ocean. Diatom productivity south of the Antarctic Polar Front and the subsequent burial of biogenic opal in underlying sediments are limited by this silicon supply. We show that opal burial rates, and thus upwelling, were enhanced during the termination of the last ice age in each sector of the Southern Ocean.
In the record with the greatest temporal resolution, we find evidence for two intervals of enhanced upwelling concurrent with the two intervals of rising atmospheric CO2 during deglaciation. These results directly link increased ventilation of deep water to the deglacial rise in atmospheric CO2.”
http://www.sciencemag.org/content/323/5920/1443.abstract
Leif Svalgaard says:
BTW, the claim that the Sun is responsible for most of climate variation is one of the strongest weapons in the AGW crew’s arsenal [explains variations before SUVs] and the disconnect in 1980 is proof positive of AGW. I’m at a loss, why opponents of AGW are playing into the AGW hands by conceding to them that weapon. Especially since the effects are as shaky as AGW, go figure…
Perhaps they are arguing it because they think it is true, rather than because it fits the “correct” message?
Nature is spectacularly good at ignoring what Man wants it to do.
Mooloo says:
April 11, 2012 at 6:16 pm
Nature is spectacularly good at ignoring what Man wants it to do.
And Man is spectacularly good at ignoring what Nature tells him.
Leif Svalgaard says: “…I think I have said several times that IMHO neither CO2 nor the Sun is responsible for the observed climate changes, …”
As painful as I find it to let go the hope Michael Pacnik inspires in this piece I will throw my lot in with Leif and his “humble opinion” expressed in the quote above.
The integrity Leif has demonstrated time and again on WUWT? demands it — but, sheesh, I do wish it was as straightforward as Michael’s piece seemed to show.
It certainly would be useless to try and use GISS temperature anomalies to find any correlation with solar activity. It would be in NASA’s interest not to publish temperature data that might correlate with solar activity.
Leif Svalgaard says:
April 11, 2012 at 12:19 am
All that solar/geomagnetic/cosmic ray stuff related to temperature is simply falsified by recent data: the sun is now as quiet as it was a century ago, geomagnetic activity and interplanetary magnetic fields are at record lows, cosmic rays at record high, and yet temperatures are much warmer now than a century ago. This does not mean that the rise is man made, just that it is not solar made.
This conclusion is a fallacy. If it is true that the named stuff is simply falsified by recent (your) data, this does not mean in general that the rise is not solar made, because an alternative or more alternatives could exist of solar functions which can be correlate with the rises and falls of the terrestrial global temperature.
And there is in fact a simple solar function which has a weak relation to the terrestrial temperature proxies. The sun spot frequency is increased if the related terrestrial global temperature frequency is increased and vice versa. : Because the outer Sun is a fluid, it is possible that forces along the solar longitude, per example tide forces can shift the frequency of the outer solar fluid in respect to the fixed oscillator in a non linear way. The average frequency of the sun spot oscillator is f = 1/11.196 y-1. There is a significant agreement about the phases and polarities of the frequency shifts:
http://www.volker-doormann.org/images/sun_shift_buent.gif
It is clear that the low frequency of the sun spots cannot exhibit possible higher temperature frequencies than the sun spot frequency, but as argued since two years, higher solar tide function frequencies than the sun spot frequencies shows strong correlations with terrestrial proxies.
http://www.volker-doormann.org/images/ghi_6_lockwood_1.gif
An other evidence of a connection between solar functions and the terrestrial climate is the relation of the solar neutrino rate to the global terrestrial SST:
http://www.volker-doormann.org/images/ghi_had_sno_ghi8_2.gif
I think the problem with the Svalgaard method is treefold: i.) There are always only (personal) claims what is NOT, ii.) valid arguments on relations of solar functions to terrestrial climate proxies are ignored, iii.) his method never have explained or answered the questions from the historic proxies of the physical heat/cooling processes of 8K pp or minor, but discredits alternative arguments which claims Sun functions are involved in the terrestrial climate.
This method is not a method of science. It is a method of power claimed as peer.
V.
*****
Kev-in-UK says:
April 11, 2012 at 10:21 am
I agree – but the trouble is that there are several elephants and a multitude of kittens in the room (to use your phrase!).
*****
Hi Kev. If there was a significant “mass” of kittens, that should disrupt/decrease the correlation between the Milankovitch cycles/rate of ice melting. The correlation between those is something like 96+%! It doesn’t look like the kittens are having much effect….
For those invoking time-lags, I disagree. The ocean mass is huge, but is mostly stratified — the cold water below is rather effectively isolated from the air. So only a thin layer of warm water at the top participates in the atmospheric coupling (areas of ocean upwelling are exceptions, but these are only a small percentage of the total ocean area). Leif linked to a paper some time ago that showed fairly convincingly that the time-constant for the surface was only a couple yrs for land & 10 yrs or so for areas above deep oceans. So I discount decades/centuries for “lag times” — if you’re on continental land, it’s just a matter of a few years!
Volker, your mechanistic climate-Solar correspondance appears to be cloudy. Care to be clear on what it is? Exactly? With maths? And models? With a bit of physical science thrown in perchance? And maybe narrowed down to just one of your suggestions? In classical debate, Leif wins this hands down. You, on the other hand, appear to be handwaving.
Volker Doormann says:
April 12, 2012 at 4:33 am
It is clear that the low frequency of the sun spots cannot exhibit possible higher temperature frequencies than the sun spot frequency, but as argued since two years, higher solar tide function frequencies than the sun spot frequencies shows strong correlations with terrestrial proxies.
without detracting from the entertainment value of your comments, it seems reasonable [at least to me] to discount claims based on the tidal influences of Quaoar and Pluto. There are perhaps hundreds of other dwarf planets out there [some bigger than Pluto], perhaps you could improve the correlation [if not now, then certainly in the future] by taking their effect into account…
“What is not considered is the fact that the North American Glacier was so massive that it created it’s own weather. The run off of ground water was one thing. However, as the temperature warmed and the Ice Sheet Melted, there was an equally incredible amount of water vapor being released into the atmosphere.
” In fact, an ice sheet of this scale would have probably made its own local weather. Sudden cooling of warm, moist masses of Gulf air encountering the cold ice sheet would have created torrential summer rains and near-constant “glacier-effect” snow in winter.” Indiana Geological Survey
The atmosphere became saturated with water vapor. There would have been an almost incessant fog and raining from this vapor. Torrential rain fell over the entire Mississippi Drainage area, including the Ice Sheet itself. As this warmer rain fell on the ice pack, the ice sheet began to dissolve at an astonishing rate.
(see map above) This created an incredible run off into the Mississippi Valley. Both the massive runoff and the atmospheric moisture kept the Mississippi flowing with astonishing power. The Ice Age Mississippi was much more massive than todays river.”
http://www.losthistorypublishing.com/Catastrophe.html
Atmospheric moisture? Hey, isn’t moisture a GHG?