Guest post by Michael Pacnik
Especially in the context of recent discussion of the Shakun et al. paper, a look at other sources for temperature history versus CO2 can be helpful, examining timescales ranging from the past century to the past 11000 years and even the past 500 million years.
Recent discussion of the Shakun et al. (Nature 2012) paper has illuminated issues in its presentation of the history of CO2 versus temperature (commentaries here, here, here, and here).
In addition to those investigations, another helpful approach may be to take a step back and cross-check with other sources. In general, does CO2 correlate with temperature in climate history?
The answer is often yes on “medium” timescales, but no on “short” timescales and also no on the very longest timescales of all. If one looks at all three timescales, overall observations are consistent with temperature rise causing the oceans to release part of their dissolved CO2 after substantial lag time, yet not consistent with CO2 being the primary driver of climate.
Over the past few hundred thousand years of ice core data, a “medium” time
scale in this sense, CO2 superficially appears to change in step with
temperature if a graph is so zoomed out as to not show sub-millennial time
scales well:

Source: http://www.brighton73.freeserve.co.uk/gw/paleo/400000yearslarge.gif
Yet, what about a closer look at a “short” time scale, the past few thousand years instead?
Showing from 200 to 11000 years ago, the subsequent graph is based on ice core data, readily visible in files hosted on the servers of the U.S. National Oceanic and Atmospheric Administration (NOAA): GISP 2 and EPICA Dome C:

Source:
A lack of correlation between temperatures (in the above from a Greenland ice core) and atmospheric CO2 becomes very apparent at that timescale and level of detail.
With the focus on the bulk of the past 11000 years of the Holocene, the most recent rise in CO2 is not shown in the preceding because the EPICA ice core data ends in 1777 A.D., while the GISP 2 ice core temperature data extends up to a century ago.
Greenland is relatively indicative of changes in Northern Hemisphere temperature over time. Throughout the Holocene, warm periods have tended to have more warming in the upper Northern Hemisphere than nearer the equator (including the Modern Warm Period, a.k.a. global warming).
In the prior chart, much of around 7000 to 8000 years ago was particularly warm, more so than now. Such was part of the Holocene Climate Optimum. Research at Oak Ridge National Laboratory remarks (bolding added):
“By 8,000 14C y.a., the Earth was under a full interglacial climate, with conditions warmer and moister than present in many parts of the world. Tropical forest in Africa (and probably also Asia) was expanded in area, and the areas of desert in Africa and Asia were much reduced.”
Source: http://www.esd.ornl.gov/projects/qen/nerc.html
In fact, that atlas of palaeovegetation led to a conclusion which may surprise those used to hearing claims of how global warming would mean overall more deserts: When the climate was warmer, overall desert extent was actually less (because the ocean surface, 70% of Earth’s area, was warmed as well as land, causing more thermal-driven evaporation and circulation through rainfall of water onto land). Conversely, there was far greater
desert extent 18000 years ago during the cold Last Glacial Maximum, including polar deserts which are cold but have a lack of precipitation.

Sources: http://www.esd.ornl.gov/projects/qen/nerc.html
However, at the “short” time scales in the last ice core graph, showing fluctuations down to relatively small fractions of a millennia, atmospheric temperatures over Greenland would not be the same as ocean temperatures far below the surface, as the ocean depths can take centuries to warm much.
Only at greater time scales is there time for even seawater thousands of meters deep to fully warm and release more CO2. Accordingly, only at greater “medium” time scales does CO2 and temperature correlate highly, as can be seen contrasting the 400,000-year graph to the 11,000-year graph.
Evidence for how CO2 in ice core data lags temperature by centuries has been discussed before at Watts Up With That, including articles in 2009 by Frank Lansner and R. Taylor.
A simple Henry’s Law formula is applicable to a glass of water on a table releasing more previously-dissolved gas when warmed, but it is not literally valid when there are chemical reactions with the solute (CO2). The oceans are a far more complex system in general. However, still, more CO2 is released eventually when the planet warms. The atmosphere and the ocean surface (or shallow zones) warms much first, then deeper waters later.
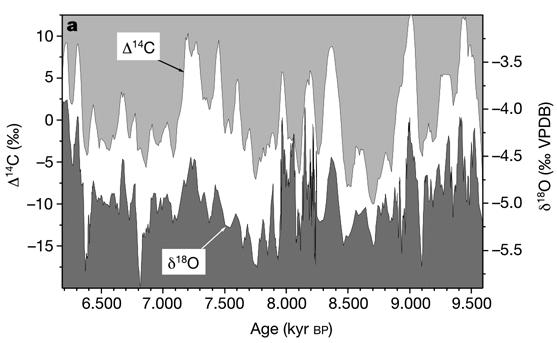
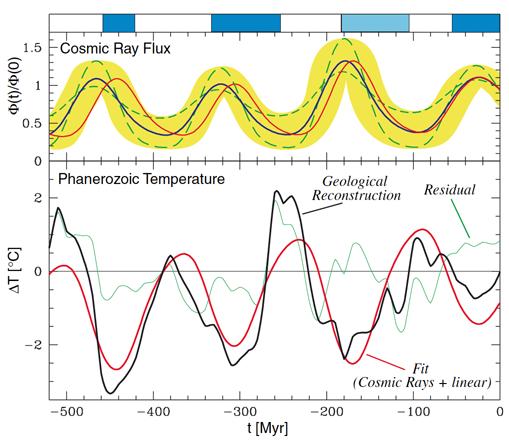
If CO2 does not usually correlate well with temperatures on the scale of variation over shorter time intervals, what does? A look at a reconstruction of Indian ocean temperatures is fitting:

Source: http://sciencebits.com/files/pictures/climate/crcFig1.jpg
Such is showing the history of temperature versus cosmic ray flux. The Oxygen-18/Oxygen-16 isotope ratio is a common temperature proxy, where the trends in it correspond to the trends in temperature.
Many papers describe Carbon-14 as a solar activity proxy, which it is indirectly, aside from some caveats on other time scales than depicted here. However, more directly, it is a cosmic ray proxy. Aside from more recent artificial sources, 20th-century atmospheric nuclear tests, carbon-14 is a cosmogenic isotopeproduced in nature by cosmic rays.
On these time scales, most variation in incoming galactic cosmic ray flux is caused by changes in the solar-driven interplanetary magnetic field. Those changes have a major relationship to sunspot trends but are not exactly identical in timing. For example, the authors of a paper by NASA’s JPL remark (terminology clarification in brackets added):
“Cliver et., (1998) has compared the minimum aa [index of geomagnetic activity] values with the Earth’s surface temperature record and found a correlation of 0.95 between the two data sets starting in 1885. The solar irradiance [solar activity] proxy developed from the aa minima continues to track the Earth’s surface temperature until the present (Cliver et al., 1998).
This is in marked contrast to reconstructions based on sunspot number [Solanki and Fligger, 1998 in which the irradiance and the temperature are not correlated after 1978. In a study of 14C [Carbon-14 history] Stuiver and Quay (1980) found that the cosmic ray flux at the magnetopause was anticorrelated with [the] aa [index of geomagnetic activity].”
With that said, there is significant correlation between sunspot number trends and temperature in many time periods, provided that an appropriate temperature indicator is utilized. One example is the following chart from the NOAA archive for 1860 – 1985, where the global mean sea surface temperature trend (SST) is fortunately not skewed by Urban Heat Island (UHI) effects on land:

Source: http://www.oar.noaa.gov/spotlite/archive/images/sunclimate_3b.gif
However, as noted previously, trends in the aa index of geomagnetic activity
display even better correlation than sunspot trends to terrestrial temperatures. When the aa index of geomagnetic activity rises, more galactic cosmic rays are deflected in interplanetary space, and fewer cosmic rays reach Earth.
The following shows correlation between temperature and Be-10 over the latter part of the Little Ice Age and then into the 20th-century Modern Warm Period:

Source:
http://www.appinsys.com/globalwarming/GW_Part6_SolarEvidence_files/image009.gif
The Be-10 cosmogenic isotope is frequently labeled a solar activity proxy, which is true, but, once again, it is also and more directly a cosmic ray proxy.
On the short term, solar activity in terms of total solar irradiance (TSI) changes only by around 0.1% typically over solar cycles, but the interplanetary magnetic field varies vastly more in percentage terms, with correspondingly substantial changes in cosmic ray flux.
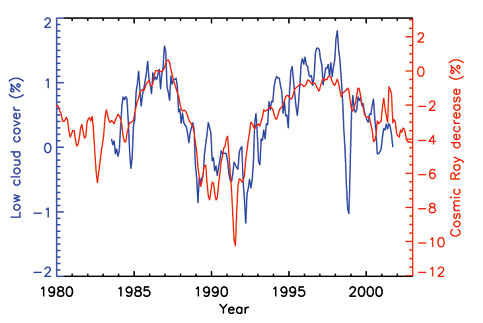
On Earth, tropospheric ionization changes by typically 5% over a single solar cycle (Shaviv, 2005). Global cloud cover has been observed to vary 3-4% in a solar cycle in a manner strongly correlating with cosmic ray flux change (Svensmark, 1997).
Cosmic rays are minuscule in direct energy delivered compared to sunlight but can seed clouds. Evidence supporting how cosmic rays contribute to cloud condensation nuclei has been discussed at Watts Up With That previously, including a last month’s update.
Some common mistakes can lead to missing observation of the effect of cosmic rays, discussed by Dr. Shaviv in remarks on the Hebrew University debate, another debate,
and a recent paper. (Also, counterintuitively, fluctuations in galactic cosmic ray flux matter little for the highest altitude clouds but more for lower altitude clouds, because the former are in an enviroment where GCRs are always in relative surplus and not the limiting nutrient, so to speak).
However, if those mistakes are all avoided, substantial correlation can be seen between cosmic ray flux variation and cloud cover variation, such as this illustration (discussed more at Dr. Shaviv’s site, following Marsh & Svensmark 2003):

Source: http://sciencebits.com/files/pictures/climate/crcFig3.jpg
There are other examples. For instance, as might be expected from cosmic ray variation slightly modifying average cloud cover, a study from a much different source notes a relationship between galactic cosmic radiation and tree rings:
“There was a consistent and statistically significant relationship between growth of the trees and the flux density of galactic cosmic radiation. Moreover, there was an underlying periodicity in growth, with four minima since 1961, resembling the period cycle of galactic cosmic radiation. We discuss the hypotheses that might explain this correlation: the tendency of
galactic cosmic radiation to produce cloud condensation nuclei, which in turn increases the diffuse component of solar radiation, and thus increases the photosynthesis of the forest canopy.”
An article by Dr. Svensmark on cosmoclimatology is excellent reading:
Cosmoclimatology: A new theory emerges (PDF)
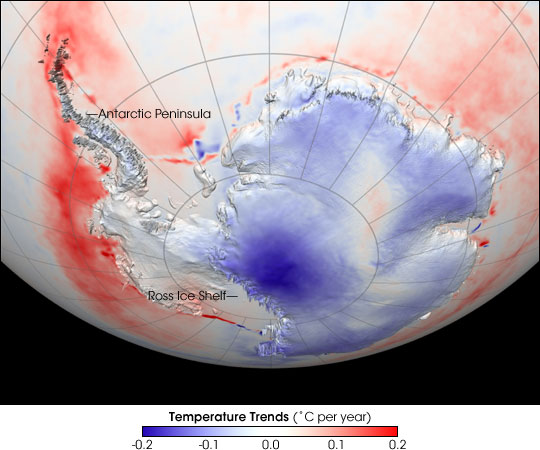
As implied there, a relative smoking gun of evidence exists for variations in cloud cover driving much of temperature change: Usually low-level cloud cover cools the surface, but cloud cover over the Antarctica ice sheet itself is the opposite situation, because the ice is such a particularly high albedo as to be literally more white (more reflective) than the cloud tops. The following NASA graph indirectly provides a rather good illustration if interpreted in that context:

Source:
http://eoimages.gsfc.nasa.gov/images/imagerecords/6000/6502/antarctic_temps.AVH1982-2004.jpg
Over the 1982 – 2004 period depicted above, there is a very sharp contrast between observed temperature trends over the exceptionally reflective continuous permanent ice sheet in Antarctica (cooled when average cloud cover decreased over that particular period) versus the less reflective surrounding ocean even a short distance away (warmed when cloud cover decreased).
Another NASA graph shows the past century of temperature variation on the opposite end of the world, the Arctic (which warmed far more in the late 20th century than more tropical regions):

Source:
http://earthobservatory.nasa.gov/Features/ArcticIce/Images/arctic_temp_trends_rt.gif
As can be seen, there was major decline in temperatures from the 1930s to the 1960s. CO2 emissions went up constantly meanwhile, in utter lack of correlation not fitting the theory of CO2 being the primary climate driver. What does fit for more correlation there is solar activity, both solar irradiance and the solar-driven interplanetary magnetic field affecting
comic rays:
Sources: http://www.appinsys.com/globalwarming/GW_Part6_SolarEvidence.htm
Even on a time scale of a century, CO2 trends do not correlate with temperature well. What about very “long” timescales in geological terms? Back in 2001, a study of atmospheric carbon dioxide levels for the last 500 million years (Rothman, MIT) remarked:
“Because the long-term evolution of carbon dioxide levels depends similarly [to a strontium-isotope record] on weathering and magmatism, the relative fluctuations of CO2 levels are inferred from the shared fluctuations of the isotopic records. The resulting CO2 signal exhibits no systematic correspondence with the geologic record of climatic variations at tectonic time scales.”
On those extreme long time scales, atmospheric CO2 levels are driven largely by geological processes other than the temperature-dependent release of CO2 from the ocean predominant on “medium” time scales. Accordingly there is lack of correlation between CO2 and temperature. The prior study also noted apparent long-period climate fluctuations, of around 135 million years, existing from some cause, with cycling between warm and cool modes several times over the past 600 million years.
Others have guessed that cause. Inthe words of Dr. Antonino Zichichi, president of the World Federation of Scientists:
“In the last half billion years, earth has lost, four times, its polar caps: no ice at the North Pole and none at the South Pole. And, four times, the polar caps were reconstituted. Man did not exist then, only the so-called cosmic rays, discovered by mankind in the early twentieth century. The last cosmic ice age started 50 million years ago when we entered into one of the galaxy arms.”
A non-coincidental match between a climate cycle of near 140 million years and the time it takes the Solar System to pass between spiral arms of the galaxy was observed by Dr. Shaviv after reconstructing past cosmic ray variation from iron meteorites:

Source: http://sciencebits.com/files/pictures/climate/crcFig5.jpg
Everything from ozone change to volcanoes, human activities, and ocean cycles has a non-zero effect on climate, but much of temperature history fits together well if changes in cosmic rays and solar activity have a major effect on climate. The preceding contrasts with those who would assume CO2 to be the primary climate driver and who, in practice, predominantly simply entirely ignore the effect of cosmic rays (aside from the occasional attempt at rebuttal to justify continuing to ignore them), acting as if solar activity variation only mattered for direct irradiance alone.
However, claims about massive forcing from CO2 variation have always been based not on its direct observed spectral effect but upon hypothetical major net positive feedback from water vapor vastly amplifying CO2’s small direct effect. Evidence supports rather a climate system with low climate sensitivity, with predominantly negative feedback.
As implied there, a relative smoking gun of evidence exists for variations in cloud cover driving much of temperature change: Usually low-level cloud cover cools the surface, but cloud cover over the Antarctica ice sheet itself is the opposite situation, because the ice is such a particularly high albedo as to be literally more white (more reflective) than the cloud tops. The following NASA graph indirectly provides a rather good illustration if interpreted in that context
Low level cloud cover changes drives much of the measured temperature change.
The reason for this is that minimum temperatures generally occur when solar insolation exceeds outgoing longwave radiation. This occurs some time after dawn as the sun rises.above the horizon. Low level cloud will block solar radiation and and allow longer for radiative cooling and thus lower minimum temperatures. Less low level cloud will allow less time for net radiative cooling and cause higher minimum temperatures.
All the warming on the Antarctic Peninsula has been in minimum temperatures.
There is a serious problem with rising air temperatures causing ice melt along the Antarctic peninsula. Which is, while the glacial icesheets (Larsen A,B and C) have indeed have retreated rapidly, the surrounding sea ice has rapidly increased in extent. Warmer air temperatures can not possibly cause ice from one source to rapidly retreat while ice from another source to rapidly expand.
Briefly, what is happening is that increased solar insolation from decreased low level clouds is melting the icesheets, which do not form over the ocean and are only susceptible to rate of melt. Whereas sea ice extent is determined by rate of formation and less low level clouds will overall increase heat loss from LWR and hence lower temperatures and result in more sea ice.
You may find this graph interesting. It shows how the graph displaying solar cycle lenght vs temperature may possibly be used to tell us something about the cause of the recent warming… Just a food for thought…
http://agust.net/images/Armagh-Solarcycle-Length-English-feb2010.jpg
(This is an updatet graph from an article I wrote for the Icelandic magazine Þjóðlíf and copied to my blog in May 2008. The name of the article is “Global Cooling Following Global Warming?”
http://agbjarn.blog.is/blog/agbjarn/entry/528875/ ).
I have been convinced by Murry Salby that net emissions of CO2 are independent of human emissions. I have believed that emissions were caused by warming of the oceans leading to outgassing. The Holocene interglacial is cooler than the previous four interglacials but we have more CO2? If humans are not causing this rise in atmospheric CO2 then where is it coming from? Are there mechanisms at work which we do not understand?
8.6 earthquake near Aceh, Indonesia. 8.2 aftershock. Tsunami alert for 28 countries. Cue the global warming prophets of doom, linking earthquakes and tsunamis to climate change.
The effect of lag times are important to consider but they are considered less often than I would like to see.
Some suggest the lag times are at least 2-3 years, others think 7-10, Hansen decided a few years ago it was exactly 50 years, others think it is as long as 200 to 1,000 years. These of course, also depend on whether you consider the deep oceans as well.
In another 15 years, I think we will have a much better handle on all of this. If it turns out the CAGW threat has been greatly exaggerated, do we get to harp on it and have daily diatribes for the next 20 years to match the last 20 years of hysteria? I somehow doubt it. Actually, I think that there are many who will downplay or ignore the fact that it was hyped and still keep it as a semi-truth in their own minds much like DDT or nuclear power or even communism today.
Leif,
I know you to be more intellectually honest than your post in this thread, so am having a hard time understanding why you wrote what you wrote. If you really believe a few years of low solar activity can instantaneously (less than five years) reverse SST’s to previous levels, I don’t know what to tell you. Maybe you just forgot the sarc at the end.
Leif…..you forget about time lags in ocean heat storage!
There was no ‘antrhopogenic’ global warming before 1950 (IPCC model runs demonstrate this though they don’t highlight the fact, and between 1950-1980, a natural down cycle meant global temperatures did not rise to 1950 levels until 1980 (roughly). The earlier contention that warming was obscured by sulphur emissions has been disproved (see my chapter in ‘Chill’ which reviewes the papers in Science and to which I still have no reply from people at the Metoffice).
Thus 1980-2000 is the global warming period that potentially is man-made, but during which the solar magnetic field did increase, as well as the UV flux – both of which may affect cloud cover – and cloud cover is recorded as falling by 4% over that time (International Satellite Cloud Climatology Programme) – quite enough to generate the rise in upper ocean heat content.
About 80% of all land temperature rise is due to heat transfer from the ocean (Compo and Sardeshmukh, NOAA labs). The heat is storedin the upper 200m.
In 2001, cloud cover recovered by 2% over the whole decade – thus global warming ‘stalled’ but the oceans were still warm (the lag) and are cooling slowly.
In 2006 the field fell to its current low, as did UV flux, and the jetstream has shifted the cloud cover such that it lowers insolation equatorially and accelerates heat loss poleward, and hence the North Atlantic and North Pacific have cooled significantly in the last five years. This will knock on to land temperatures. The changes are less marked int he southern hemisphere because there is more ocean and different gyre dynamics around the southern polar region.
So – keep an open mind and watch the future behaviour of ocean heat storage.
Indeed a strong post.
Anyone who looks at temperature at longer timescales is on the right track, IMHO.
For instance, the “sane” version of Jeff Masters looking at the last 110,000 years:
“Ocean and lake sediment data from places such as California, Venezuela, and Antarctica have confirmed that these sudden climate changes affected not just Greenland, but the entire world. During the past 110,000 years, there have been at least 20 such abrupt climate changes. Only one period of stable climate has existed during the past 110,000 years–the 11,000 years of modern climate (the ‘Holocene’ era). ‘Normal’ climate for Earth is the climate of sudden extreme jumps–like a light switch flicking on and off.’
In the other direction, we have the insane version of Jeff Masters looking at U.S. temperatures for a single month, namely March 2012:
“Yesterday (Tuesday), the analysis showed that Michigan experienced temperatures that were 4-5 climatological anomalies warmer than average (4-sigma to 5-sigma), the type of extreme that occurs between once every 43 years and once every 4,779 years.
“Of course, using 30 years of data to estimate extreme events with a return period of centuries is a sketchy proposition. However, keep in mind that had we used a century-long climatology instead of using the past 30 years, yesterday’s warmth would have been classified as much more extreme, since the climate has warmed considerably in the past 30 years.
“It is highly unlikely the warmth of the current ‘Summer in March’ heat wave could have occurred unless the climate was warming.”
Again, it’s as though these people don’t realize there’s an interweb.
Olavi says:
April 11, 2012 at 2:50 am
I also think Leif is being a little simplistic! Solar influences will be somewhat hidden in the timelag for any warming/cooling phases due to oceanic, atmospheric and land heat ‘content’. A cool sun will not have an instant effect on global temps.
In simple terms – the earth is one bloody big storage heater – which takes ages to warm up and also ages to cool down. I thus find it hard to believe that decadal scale solar changes/influences will be easily detectable within centennial or millenial palaeo proxies but that doesn’t mean they don’t occur or don’t have a cumulative effect!
Nothofagus dombeyi is a South American tree. It procuces pollen every year and the levels of pollen are a good proxy for the number of trees. We know that it likes things warm and wet, because we know where it grows today.
Looking at a biological proxy gives on an idea of what the growing conditions were like, its not a thermometer, but an ecology proxy.
Here is a pollen record from Patagonia, most are behind paywalls.
http://ars.sciencedirect.com/content/image/1-s2.0-S0277379111003519-gr4.jpg
Nothofagus dombeyi goes a 50 fold expansion in levels from 16000 to 9500 years before 1950.
This shows that Patagonia became warm and wet, Now when you have a huge change in the amount of carbon fixing trees, you have changes in the levels of other biotica, all of which fix carbon, and some fraction of that carbon ends up under ground or in marine sediments.
What is interesting is that ecosystems change long before CO2.
Where all the CO2 go?
Dung says:
April 11, 2012 at 3:57 am
To be fair, I think most geologists have taken that view in respect of AGW issues since geologists see ‘scale’ in dimensions both temporal and spatial. I have certainly been advocating the scale problem of anthropogenic CO2 since I first got to look into the AGW scam.
You simply cannot have the oceans and soil mass of the earth ‘sneezing’ up some CO2 (or sinking it back in?) and expect to detect a titchy anthropogenic signal on top. The AGW CO2 signal is based on an assumption that the rest of the much more massive CO2 cycle is entirely static, which is complete fantasy! (as simple things like algal or foraminiferal blooms, deforestation, etc, easily demonstrate).
In the words of Monty Python, Salby’s work in a sense, justy points out ‘the bleeding obvious’, but he backs it up with valid science IMO and should be far more prominently promoted in the media.
.
I see where Lief is going with this, but forgive me if I am repeating myself. The atmosphere surely acts more like the air in your house. You come home at 6pm, it’s cold & dark. No central heating on. You turn the heating on, & depending upon the efficiency of the insulations, the boiler, building materials, (feedbacks shall we call them?) etc, it could anything up to a hour or more before the temperature rises to a comfortable level. When you turn the heating off, the house doesn’t immediately turn cold for some while afterwards! If the Sun is quiet, & I don’t doubt that for one second, then it will take several years to demonstrate significant cooling of the atmosphere!
“The atmosphere and the ocean surface (or shallow zones) warms much first, then deeper waters later.”
….and most of the Shakun temperature proxies appear to be from coastal locations in shallow waters, representative of neither continents nor bulk oceans.
Kasuha says:
April 11, 2012 at 2:59 am
I never figured out what arguments exactly are his claims based on but if you want to prove him wrong, show where exactly is he wrong.
I would think just looking at the first graph showing that the last interglacials were all warmer than today with less CO2 should be sufficient. CO2 lacks the logical blame for temperature rise as it is neither necessary nor sufficient. Case closed.
The warning that needs heeding has to do with oscillation rhythms. In a system replete with oscillations of various speeds and variable time spans, correlation will occur. And when correlation occurs, it may take, depending on the oscillations being compared, many, many thousands of years to pass each other by. One must delve into mechanisms, mathematically determining the energy needed to create such couplings and keep them in sync. Without plausible (again with the maths) mechanism, this discussion is about two windshield wipers on a school bus that occasionally, and for several swipes of the glass, look to be connected.
This is interesting, but not that much. Does cosmic-ray intensity cause glacial/interglacial cycles? Those cycles have been shown to correlate tightly w/the Milankovitch orbital characteristics. Does cosmic-ray intensity correlate w/Milankovitch cycles? No. So tho I don’t discount cosmic-ray having an effect on clouds, it isn’t the elephant in the room, it’s just a little kitten. I’m mostly interested in the elephant.
Peter Taylor says:
April 11, 2012 at 4:34 am
Leif…..you forget about time lags in ocean heat storage!
Look at the ‘studies’ cited. How many of those incorporate a lag? and what is it?
Solar activity did not just drop a couple of years ago. Here is the average sunspot number per cycle the past 100 years: http://www.leif.org/research/Solar-Cycle-Average-SSN.png
RE spiral arms of the milky way and ice ages every 100.000 years:
Check out Veizer and Shaviv, GSA Today, July 2003 (EOS dumped all over it, so it must be good.)
http://stephenschneider.stanford.edu/Publications/PDF_Papers/shaviv-veizer-03.pdf
smu says:
April 11, 2012 at 3:12 am
…. And since most of the graphs are derrived from Wikipedia why not show one of the other ones…
_______________________________
Wikipedia information on climate is carefully massaged by the gatekeeper William Connelley.
Wikibullies at work. The National Post exposes broad trust issues over Wikipedia climate information- 12/19/2009
More on Wikipedia and Connolley – he’s been canned as a Wiki administrator – 12/19/2009
Wikipedia climate revisionism by William Connolley continues – 10/13/2010
At that point I lost all faith in Wiki as a source for anything as have most others here at WUWT.
> A lack of correlation between temperatures (in the above from a Greenland ice core) and atmospheric CO2 becomes very apparent at that timescale and level of detail.
But why do you expect correlation with Greenland T? CO2 is global. You need to look at global temperature, which you don’t have. You don’t see those spikes in the Antarctic record, for example.
> Greenland is relatively indicative of changes in Northern Hemisphere temperature over time.
{{cn}}
> http://eoimages.gsfc.nasa.gov/images/imagerecords/6000/6502/antarctic_temps.AVH1982-2004.jpg
Funny you should use that. You obviously wouldn’t want to use a more up to date pic:
http://earthobservatory.nasa.gov/IOTD/view.php?id=8239
Indeed, if you look at http://earthobservatory.nasa.gov/IOTD/view.php?id=6502 which uses your version, it helpfully says “(Editor’s note: This image was first published on April 27, 2006, and it was based on data from 1981-2004. A more recent version was published on November 21, 2007. The new version extended the data range through 2007, and was based on a revised analysis that included better inter-calibration among all the satellite records that are part of the time series.)” Put another way, your version is wrong. There is some discussion around this issue at http://en.wikipedia.org/wiki/Talk:Antarctica_cooling_controversy#Satellite_pic which you might find interesting.
David Middleton says:
April 11, 2012 at 3:02 am
======================================
Yes Sir, and solar activity, by any metric, stayed relatively high until recently. To expect instant changes in the long term massive residence time of the worlds ocean heat content, appears a little silly for one of Leifs qualifications. The burner on the large pot of water was set to medium, I turned it up to high for 20 seconds, then down to medium high for five minutes, gee the pot kept warming the entire time. The ocean is a very large pot indeed.
Leif: “and yet temperatures are much warmer now than a century ago. This does not mean that the rise is man made, just that it is not solar made.”
1) Temperatures are not much warmer than they were 68 or 70 Years ago,
HADCRUT3 – http://www.cru.uea.ac.uk/cru/data/temperature/hadcrut3gl.txt
Jan 1878 0.160
Jan 1942 0.215
Jan 1944 0.240
Jan 2011 0.194
Jan 2012 0.218
2) Sunshine is up.
http://i40.tinypic.com/xgfyok.jpg
I’m trying to read this great article, however, there is an amazingly horrible ad for “loyaltyradio” that just won’t shut up and go away. It keeps refreshing and turning on the sound.
SS number is not the only metric of solar activity
Dozens of peer-reviewed studies have found a very high degree of correlation (.5 to .8) between solar-magnetic activity and global temperature going back many thousands of years (Bond 2001, Neff 2001, Shaviv 2003, Usoskin 2005, and many others). In other words, solar activity “explains,” in the statistical sense, 50 to 80% of past temperature change. Far more then CO2
The high degree of correlation also suggests that solar activity is the primary driver of global temperature on every time scale studied (which is pretty much every time scale but the Milankovitch cycle).
Literally dozens of studies finding .5 to .8 degrees of correlation with temperature
Continuing man-made global warming fraud triggers a mass NASA rebellion. Rebels demand U.S. government pulls plug on the climate catastrophe cult. Dozens of top experts including astronauts and engineers trigger meltdown in American space agency.
http://johnosullivan.wordpress.com/2012/04/11/nasa-in-mass-revolt-over-global-warming-fraud/