Guest post by Michael Pacnik
Especially in the context of recent discussion of the Shakun et al. paper, a look at other sources for temperature history versus CO2 can be helpful, examining timescales ranging from the past century to the past 11000 years and even the past 500 million years.
Recent discussion of the Shakun et al. (Nature 2012) paper has illuminated issues in its presentation of the history of CO2 versus temperature (commentaries here, here, here, and here).
In addition to those investigations, another helpful approach may be to take a step back and cross-check with other sources. In general, does CO2 correlate with temperature in climate history?
The answer is often yes on “medium” timescales, but no on “short” timescales and also no on the very longest timescales of all. If one looks at all three timescales, overall observations are consistent with temperature rise causing the oceans to release part of their dissolved CO2 after substantial lag time, yet not consistent with CO2 being the primary driver of climate.
Over the past few hundred thousand years of ice core data, a “medium” time
scale in this sense, CO2 superficially appears to change in step with
temperature if a graph is so zoomed out as to not show sub-millennial time
scales well:

Source: http://www.brighton73.freeserve.co.uk/gw/paleo/400000yearslarge.gif
Yet, what about a closer look at a “short” time scale, the past few thousand years instead?
Showing from 200 to 11000 years ago, the subsequent graph is based on ice core data, readily visible in files hosted on the servers of the U.S. National Oceanic and Atmospheric Administration (NOAA): GISP 2 and EPICA Dome C:

Source:
A lack of correlation between temperatures (in the above from a Greenland ice core) and atmospheric CO2 becomes very apparent at that timescale and level of detail.
With the focus on the bulk of the past 11000 years of the Holocene, the most recent rise in CO2 is not shown in the preceding because the EPICA ice core data ends in 1777 A.D., while the GISP 2 ice core temperature data extends up to a century ago.
Greenland is relatively indicative of changes in Northern Hemisphere temperature over time. Throughout the Holocene, warm periods have tended to have more warming in the upper Northern Hemisphere than nearer the equator (including the Modern Warm Period, a.k.a. global warming).
In the prior chart, much of around 7000 to 8000 years ago was particularly warm, more so than now. Such was part of the Holocene Climate Optimum. Research at Oak Ridge National Laboratory remarks (bolding added):
“By 8,000 14C y.a., the Earth was under a full interglacial climate, with conditions warmer and moister than present in many parts of the world. Tropical forest in Africa (and probably also Asia) was expanded in area, and the areas of desert in Africa and Asia were much reduced.”
Source: http://www.esd.ornl.gov/projects/qen/nerc.html
In fact, that atlas of palaeovegetation led to a conclusion which may surprise those used to hearing claims of how global warming would mean overall more deserts: When the climate was warmer, overall desert extent was actually less (because the ocean surface, 70% of Earth’s area, was warmed as well as land, causing more thermal-driven evaporation and circulation through rainfall of water onto land). Conversely, there was far greater
desert extent 18000 years ago during the cold Last Glacial Maximum, including polar deserts which are cold but have a lack of precipitation.

Sources: http://www.esd.ornl.gov/projects/qen/nerc.html
However, at the “short” time scales in the last ice core graph, showing fluctuations down to relatively small fractions of a millennia, atmospheric temperatures over Greenland would not be the same as ocean temperatures far below the surface, as the ocean depths can take centuries to warm much.
Only at greater time scales is there time for even seawater thousands of meters deep to fully warm and release more CO2. Accordingly, only at greater “medium” time scales does CO2 and temperature correlate highly, as can be seen contrasting the 400,000-year graph to the 11,000-year graph.
Evidence for how CO2 in ice core data lags temperature by centuries has been discussed before at Watts Up With That, including articles in 2009 by Frank Lansner and R. Taylor.
A simple Henry’s Law formula is applicable to a glass of water on a table releasing more previously-dissolved gas when warmed, but it is not literally valid when there are chemical reactions with the solute (CO2). The oceans are a far more complex system in general. However, still, more CO2 is released eventually when the planet warms. The atmosphere and the ocean surface (or shallow zones) warms much first, then deeper waters later.
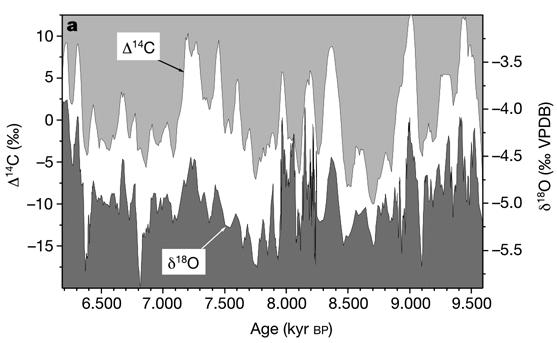
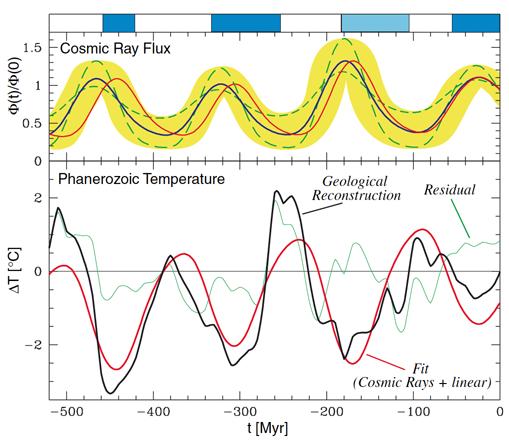
If CO2 does not usually correlate well with temperatures on the scale of variation over shorter time intervals, what does? A look at a reconstruction of Indian ocean temperatures is fitting:

Source: http://sciencebits.com/files/pictures/climate/crcFig1.jpg
Such is showing the history of temperature versus cosmic ray flux. The Oxygen-18/Oxygen-16 isotope ratio is a common temperature proxy, where the trends in it correspond to the trends in temperature.
Many papers describe Carbon-14 as a solar activity proxy, which it is indirectly, aside from some caveats on other time scales than depicted here. However, more directly, it is a cosmic ray proxy. Aside from more recent artificial sources, 20th-century atmospheric nuclear tests, carbon-14 is a cosmogenic isotopeproduced in nature by cosmic rays.
On these time scales, most variation in incoming galactic cosmic ray flux is caused by changes in the solar-driven interplanetary magnetic field. Those changes have a major relationship to sunspot trends but are not exactly identical in timing. For example, the authors of a paper by NASA’s JPL remark (terminology clarification in brackets added):
“Cliver et., (1998) has compared the minimum aa [index of geomagnetic activity] values with the Earth’s surface temperature record and found a correlation of 0.95 between the two data sets starting in 1885. The solar irradiance [solar activity] proxy developed from the aa minima continues to track the Earth’s surface temperature until the present (Cliver et al., 1998).
This is in marked contrast to reconstructions based on sunspot number [Solanki and Fligger, 1998 in which the irradiance and the temperature are not correlated after 1978. In a study of 14C [Carbon-14 history] Stuiver and Quay (1980) found that the cosmic ray flux at the magnetopause was anticorrelated with [the] aa [index of geomagnetic activity].”
With that said, there is significant correlation between sunspot number trends and temperature in many time periods, provided that an appropriate temperature indicator is utilized. One example is the following chart from the NOAA archive for 1860 – 1985, where the global mean sea surface temperature trend (SST) is fortunately not skewed by Urban Heat Island (UHI) effects on land:

Source: http://www.oar.noaa.gov/spotlite/archive/images/sunclimate_3b.gif
However, as noted previously, trends in the aa index of geomagnetic activity
display even better correlation than sunspot trends to terrestrial temperatures. When the aa index of geomagnetic activity rises, more galactic cosmic rays are deflected in interplanetary space, and fewer cosmic rays reach Earth.
The following shows correlation between temperature and Be-10 over the latter part of the Little Ice Age and then into the 20th-century Modern Warm Period:

Source:
http://www.appinsys.com/globalwarming/GW_Part6_SolarEvidence_files/image009.gif
The Be-10 cosmogenic isotope is frequently labeled a solar activity proxy, which is true, but, once again, it is also and more directly a cosmic ray proxy.
On the short term, solar activity in terms of total solar irradiance (TSI) changes only by around 0.1% typically over solar cycles, but the interplanetary magnetic field varies vastly more in percentage terms, with correspondingly substantial changes in cosmic ray flux.
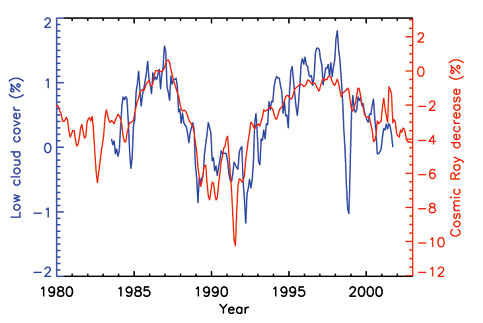
On Earth, tropospheric ionization changes by typically 5% over a single solar cycle (Shaviv, 2005). Global cloud cover has been observed to vary 3-4% in a solar cycle in a manner strongly correlating with cosmic ray flux change (Svensmark, 1997).
Cosmic rays are minuscule in direct energy delivered compared to sunlight but can seed clouds. Evidence supporting how cosmic rays contribute to cloud condensation nuclei has been discussed at Watts Up With That previously, including a last month’s update.
Some common mistakes can lead to missing observation of the effect of cosmic rays, discussed by Dr. Shaviv in remarks on the Hebrew University debate, another debate,
and a recent paper. (Also, counterintuitively, fluctuations in galactic cosmic ray flux matter little for the highest altitude clouds but more for lower altitude clouds, because the former are in an enviroment where GCRs are always in relative surplus and not the limiting nutrient, so to speak).
However, if those mistakes are all avoided, substantial correlation can be seen between cosmic ray flux variation and cloud cover variation, such as this illustration (discussed more at Dr. Shaviv’s site, following Marsh & Svensmark 2003):

Source: http://sciencebits.com/files/pictures/climate/crcFig3.jpg
There are other examples. For instance, as might be expected from cosmic ray variation slightly modifying average cloud cover, a study from a much different source notes a relationship between galactic cosmic radiation and tree rings:
“There was a consistent and statistically significant relationship between growth of the trees and the flux density of galactic cosmic radiation. Moreover, there was an underlying periodicity in growth, with four minima since 1961, resembling the period cycle of galactic cosmic radiation. We discuss the hypotheses that might explain this correlation: the tendency of
galactic cosmic radiation to produce cloud condensation nuclei, which in turn increases the diffuse component of solar radiation, and thus increases the photosynthesis of the forest canopy.”
An article by Dr. Svensmark on cosmoclimatology is excellent reading:
Cosmoclimatology: A new theory emerges (PDF)
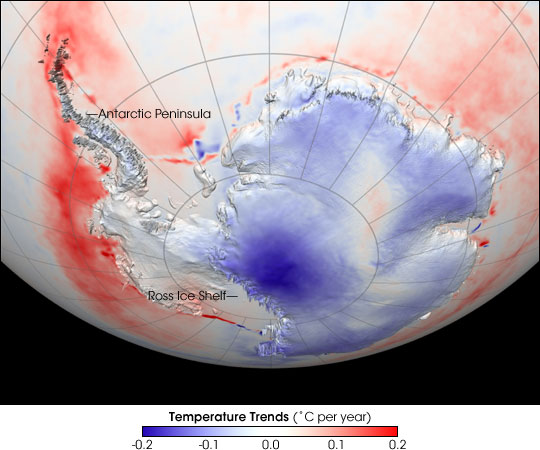
As implied there, a relative smoking gun of evidence exists for variations in cloud cover driving much of temperature change: Usually low-level cloud cover cools the surface, but cloud cover over the Antarctica ice sheet itself is the opposite situation, because the ice is such a particularly high albedo as to be literally more white (more reflective) than the cloud tops. The following NASA graph indirectly provides a rather good illustration if interpreted in that context:

Source:
http://eoimages.gsfc.nasa.gov/images/imagerecords/6000/6502/antarctic_temps.AVH1982-2004.jpg
Over the 1982 – 2004 period depicted above, there is a very sharp contrast between observed temperature trends over the exceptionally reflective continuous permanent ice sheet in Antarctica (cooled when average cloud cover decreased over that particular period) versus the less reflective surrounding ocean even a short distance away (warmed when cloud cover decreased).
Another NASA graph shows the past century of temperature variation on the opposite end of the world, the Arctic (which warmed far more in the late 20th century than more tropical regions):

Source:
http://earthobservatory.nasa.gov/Features/ArcticIce/Images/arctic_temp_trends_rt.gif
As can be seen, there was major decline in temperatures from the 1930s to the 1960s. CO2 emissions went up constantly meanwhile, in utter lack of correlation not fitting the theory of CO2 being the primary climate driver. What does fit for more correlation there is solar activity, both solar irradiance and the solar-driven interplanetary magnetic field affecting
comic rays:
Sources: http://www.appinsys.com/globalwarming/GW_Part6_SolarEvidence.htm
Even on a time scale of a century, CO2 trends do not correlate with temperature well. What about very “long” timescales in geological terms? Back in 2001, a study of atmospheric carbon dioxide levels for the last 500 million years (Rothman, MIT) remarked:
“Because the long-term evolution of carbon dioxide levels depends similarly [to a strontium-isotope record] on weathering and magmatism, the relative fluctuations of CO2 levels are inferred from the shared fluctuations of the isotopic records. The resulting CO2 signal exhibits no systematic correspondence with the geologic record of climatic variations at tectonic time scales.”
On those extreme long time scales, atmospheric CO2 levels are driven largely by geological processes other than the temperature-dependent release of CO2 from the ocean predominant on “medium” time scales. Accordingly there is lack of correlation between CO2 and temperature. The prior study also noted apparent long-period climate fluctuations, of around 135 million years, existing from some cause, with cycling between warm and cool modes several times over the past 600 million years.
Others have guessed that cause. Inthe words of Dr. Antonino Zichichi, president of the World Federation of Scientists:
“In the last half billion years, earth has lost, four times, its polar caps: no ice at the North Pole and none at the South Pole. And, four times, the polar caps were reconstituted. Man did not exist then, only the so-called cosmic rays, discovered by mankind in the early twentieth century. The last cosmic ice age started 50 million years ago when we entered into one of the galaxy arms.”
A non-coincidental match between a climate cycle of near 140 million years and the time it takes the Solar System to pass between spiral arms of the galaxy was observed by Dr. Shaviv after reconstructing past cosmic ray variation from iron meteorites:

Source: http://sciencebits.com/files/pictures/climate/crcFig5.jpg
Everything from ozone change to volcanoes, human activities, and ocean cycles has a non-zero effect on climate, but much of temperature history fits together well if changes in cosmic rays and solar activity have a major effect on climate. The preceding contrasts with those who would assume CO2 to be the primary climate driver and who, in practice, predominantly simply entirely ignore the effect of cosmic rays (aside from the occasional attempt at rebuttal to justify continuing to ignore them), acting as if solar activity variation only mattered for direct irradiance alone.
However, claims about massive forcing from CO2 variation have always been based not on its direct observed spectral effect but upon hypothetical major net positive feedback from water vapor vastly amplifying CO2’s small direct effect. Evidence supports rather a climate system with low climate sensitivity, with predominantly negative feedback.
The GISP2 ice core record is more than enough for demolishing the whole AGW BS. And the instrumental record in red should peak under the MWP one. There are still frozen Viking graves up there.
More, looking in detail, the modern GISP warming ocurred until 1940, then cooled, then warmed back to 1940s level. There is no relation with “human influcence”. Period.
All that solar/geomagnetic/cosmic ray stuff related to temperature is simply falsified by recent data: the sun is now as quiet as it was a century ago, geomagnetic activity and interplanetary magnetic fields are at record lows, cosmic rays at record high, and yet temperatures are much warmer now than a century ago. This does not mean that the rise is man made, just that it is not solar made.
I just love intelligent, measured, precise and completely devastating scientific debate.
Oops, sorry, the debate is over isn’t it?
A nice summary; thanks.
CO2 behaves like a dependent variable; back-forcing is a pain in the brain.
The problem is not convincing us, and scientists unconstrained by grant applications, but the givers of the “best scientific advice” that polititians are constrained to adhere to. There is a long list of acronyms of these advisors, and the enemy is within.
There are tales circulating about the sanity of our Prime Ministers’ by the time they leave office, (Australian) I can only think that that applies to Govt. Scientific departments, August Scientific Institutions and many Heads of State world wide.
A very solid investigation. I learned. Thanks.
Michael Pacnik sounds far too realistic, aka authoratative, to be taken seriously by the CAGW trash — or, perhaps, too frightening?
Thank you, Michael.
Ain’t, real scientific investigation wonderful? We get to see things in timescales hundreds and thousands of times our on lifespans… and we still believe we humans are significant.
Excellent post, many thanks.
So the prediction must be for the climate to get colder (in the short term), because of the inactive sun?
Wow. This is much more detailed that I did a decade ago. I simply went through the vostok ice core data in fairly small chunks to find that you could pretty much use it to plug any theory you liked. There are short periods where CO2 seem to lead temperature though most of the time it CO2 rises lag temperature. — John M Reynolds
From 1917 to 1937 the Arctic increase is double of the recent one(0.48 oC/decade) with one third of the global population
If the effect of cosmic rays is the main driver of global temperature changes as suggested, has anybody made any predictions for the next few years?
The Be-10 vs deltaT plot stops at yr 2000. Anybody know what cosmogenic Be-10 levels are doing now? Rising, signalling a potential cooling? Thanks
Oh – great article, by the way.
Leif Svalgaard says:
April 11, 2012 at 12:19 am
All that solar/geomagnetic/cosmic ray stuff related to temperature is simply falsified by recent data: the sun is now as quiet as it was a century ago, geomagnetic activity and interplanetary magnetic fields are at record lows, cosmic rays at record high, and yet temperatures are much warmer now than a century ago. This does not mean that the rise is man made, just that it is not solar made.
_____________________________________________________________________
BS.
Do you think, that warming what has happend in 60 – 100 years, disappears in two or five years. Because of oceans it takes at least 7 years before anything measureable happens, then at least one whole solarsycle to find how large influence Sun has to climate.
The sun is quiet now… Let us wait 5-10 years to see whether the temperature has dropped…
The problem of this article is that it does not stick to its own topic. If the topic is to prove CO2 is not correlated with temperatures, it should prove it instead of looking for other correlations. It shows the correlation exists on ice age timescales and is much lower on shorter time periods – and that’s all, the rest are statements which are either unsourced or unrelated to CO2.
“However, claims about massive forcing from CO2 variation have always been based not on its direct observed spectral effect but upon hypothetical major net positive feedback from water vapor vastly amplifying CO2′s small direct effect.Evidence supports rather a climate system with low climate sensitivity, with predominantly negative feedback.” – yes, that’s what I personally also wish to believe but I see no evidence for it in the article.
Hansen always claims that he’s got a proof of high climate sensitivity from the paleoclimatic record. I never figured out what arguments exactly are his claims based on but if you want to prove him wrong, show where exactly is he wrong. Pointing out all kinds of other correlations doesn’t do the trick.
The sun is weak now… Let us wait 5-10 years to see the effect on temperature…
Quote -“The isotopic composition of the water molecules in the ice cores does not only tell us about the local temperature back in time at the drill site. It also tells us about the conditions where the water initially evaporated. When water evaporates from an ocean or land surface, it is typically transported aloft in the atmosphere after which it follows the winds. Eventually it condenses and precipitates out as rain or snow a completely different place from where it evaporated. Because the history of the precipitation influences the isotopic composition, the isotopes can reveal past changes both at the source areas far from the drill site and in atmospheric circulation patterns. ”
From ‘Modelling Greenland Precipitation Sources’ http://www.iceandclimate.nbi.ku.dk/research/climatechange/modelling_dynamics/greenland_precipitation_sources/
Consider the same logic for the Antarctic, especially for drill core from near to the pole, or more particularly near to the centre of circulation of the polar weather system. Hypothetical. It is a cold era, the ice sheets over the oceans stretch far, far beyond the land mass of the Antarctic. The points of evaporation are closer to the equator and has been graphed by Willis Eschenbach so vividly, the tropical surface sea temperature tends to plateau at about 30 deg C. Evaporation of open water gives a mixture of isotope compositions which become well mixed and by convention are taken as a single figure at a given time at the point where evaporated waters form a solid at the future drill site. Alternative hypothetical. It’s a warmer era and there is essentially no ice over the ocean adjacent to the Antarctic. Evaporating water arises much closer to the pole and would be expected to average to a number different to hypothetical A.
Somehow, the complexity of these scenarios seems to have been lost as the story has been told. I can see no way in which a ratio of isotopes can be included in a linear expression relating only to temperature. Also, these are static scenarios that do not include the complex dynamics of a change from one to the other. Leads, lags, noise.
Been in an airplane many a time, and have yet to see the glass ceiling that stops convection.
There is, in reality, no such thing as the greenhouse effect in an open atmosphere. !!!!!
The Earth’s atmosphere is controlled by the combined gas laws, which lead to the lapse rate, which is based on the specific heat of the composition of the atmosphere.
Phase changes, such as the condensation of H2O, is the only thing that can affect the lapse rate because it changes the specific heat of the atmosphere (but still transports the same amount of energy).
Mnor increases in CO2 , if anything, speed up the lapse rate (by a tiny, tiny amount) that controls the upward transfer of energy within the atmosphere
The ~60-yr climate cycle doesn’t correlate with the amplitude of solar activity at any point in the instrumental record… SSN vs SST; but something caused a ~13 gazillion Joule increase in ocean heat content from 1910-1941. That heat had to have a source and I doubt it was geothermal and know it wasn’t CO2.
I do not have the full Beer paper yet so this is just a quote form the abstract
“These findings point to an active role of theSun in past climate changes beside other geophysical factors, internal variability of theclimate system, and greenhouse gases. In fact a non-linear regression model to separate natural and anthropogenic forcing since 1850 is consistent with a solar contribution of about 40% to the global warming during the last 140 years.”
Nobody disputes an effect of the sun on global temperatures. But clearly the authors state that GHG play a role are some of the key players. And since most of the graphs are derrived from Wikipedia why not show one of the other ones http://en.wikipedia.org/wiki/File:Temp-sunspot-co2.svg which is just making the point of J. Reynolds a few posts up.Yes the Sun is a key player in our climate but it is not the only one.
Regards
smu
Reblogged this on Climate Ponderings.
For me a fascinating article.
Interesting to see research confirming that cold causes more desert while warmth more
vegetation due to more rainfall. So many factors to be accounted for, sun spots, geomagnetic activity, changes in solar radiation, the effect of the interplanetary magnetic field, the activity of cosmic rays and the way they seed low clouds resulting in more photosynthesis affecting tree rings, the climate cycle of the solar system, the way Antarctica cools with less cloud cover and how they all interrelate.
If “those who would assume CO2 to be the primary climate driver and who, in practice, predominantly simply entirely ignore the effect of cosmic rays” were to relinquish their CAGW obsession there seems to be a tremendous amount of genuine research to be done into the factors affecting climate and many discoveries waiting to be made.