I found this post interesting, especially after looking at some of the images that show what appears to be a tight hot spot upwelling off the coast of Costa Rica. But I simply can’t see enough energy in this venting to account for the massive energies dissipating in ENSO events. But, let’s give it a shakedown. I welcome comments from readers on this topic. – Anthony
Argo Data Confirms El Niño/El Niña Caused By Underwater Volcanoes
Guest post by AJ Strata of The Strata-Sphere
Last week I postulated that the El Niño/El Niña effect was not due to solar or atmospheric conditions, but actually caused by underwater volcanic activity along ocean ridges off the West coast of South America. To see whether my theory held water I decided to look into the Argo Float data to see if there it was showing a warm upwelling of water in this region. I apparently was correct.
My initial assessment was that the frigid Humboldt Current that comes north from the Antarctic region along the west coast of South America (the mirror image of the current that drops down from the Arctic along the west coast of North America) could not be warmed so drastically in such a short time by sun and air alone. This is due to the physics of ocean currents and the massive amount of heat required to warm tons of cold water moving northward per second:
Gyres are caused by the Coriolis Effect; planetary vorticity along with horizontal and vertical friction, which determine the circulation patterns from the wind curl (torque).[1] The term gyre can be used to refer to any type of vortex in the air or the sea, even one that is man-made, but it is most commonly used in oceanography to refer to the major ocean systems.
…
The “South Pacific Gyre” is the Earth’s biggest system of rotating ocean currents, bounded by equator to the north, Australia to the west, the Antarctic Circumpolar Current to the south, and South America to the east.
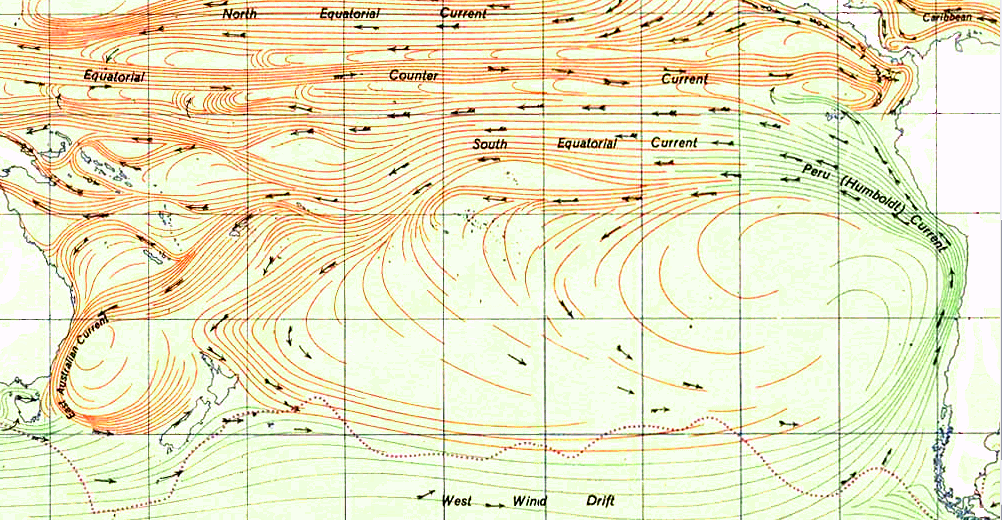
As can be seen in the graph above (click to enlarge), the Humboldt Current is one of the largest on the planet. It is infeasible that El Niño can arise from atmosphere and sun alone by warming this mass of water. Neither air temp or solar radiance change enough to cause this phenomena.
At this site you can watch animation of nearly 5 years of Argo data on the tropical region of the Pacific Ocean. It is fascinating and proves my earlier conclusion that the warm waters of El Niño arise from the eastern pacific and travel west – not the reverse as is the current (now defunct) theory. You need to set the start date on the left to the earliest date in 2007 and the end date to the latest in 2012.
I suggest you first watch the surface animation, then go the the 100m data. What you will see in the 100m is hot water upwelling off the coast of Costa Rica (which was not in the zone I originally predicted the upwelling would occur BTW). I have taken a few snaps of the data from Oct 2008 to Feb 2009 at 4 week interval to highlight what I discovered.
On this first image (click to enlarge) we see the very beginnings of the upwelling off the coast of Central America (area highlighted by red rectangle with a small blue dot). As time progresses the upwelling grows, moves west and another upwelling appears. The images are from 10_22_2008, 11_26_2008, 12_24_2008, 1_21_2009 and 2_25_2009.


Now some may ask why didn’t Argos detect the upwelling deeper (1000m)? The answer is in fluid dynamics. The hot spot is very narrow above whatever thermal vents are the source of this warming. The Argo floats are not very dense in this region. So the warm column of water upwelling has to spread out as it rises, making it more likely to be detected by the Argos floats. By the time it hits the surface the warm water really spreads out over top of the cooler layers below.
As this March 2009 surface image shows there are two upwellings in the area, but the one off Costa Rica is missed at the lower depths (again likely due to the density of sensors being so low in this area). And there appears to be a 3rd upwelling off the coast of Peru.

The activity of Nicaragua and Costa Rica is right along the Cocos Plate.

The Peruvian region I highlighted in the previous post and is linked to the Pacific Rise. Higher volcanic activity in these areas clearly cause more warm water to rise and heat the surface, creating the conditions for El Niño. Lower activity allows the cooler currents to dominate, bringing on El Niña.
Another thing to consider is as this hotspot was developing at 100km the surface temps were cooling off as well. Down welling of warm water with the upwelling of colder water.
http://www.nsof.class.noaa.gov/saa/products/search?sub_id=0&datatype_family=SST50&submit.x=27&submit.y=6
Homepage: http://www.nsof.class.noaa.gov/saa/products/welcome;jsessionid=FD720E08FE2E21F235ACCF8D28C0007F
Can click on SST data on the right.
Using this tool, you can set your parameters at 50km resolution for SST data for the time frame, and you can use your mouse to box the area on the map. Hit search and new page will give results. Drop down at top of page holds time frame links to move ahead in time.
Currents are quite variable in this area as depicted by this map.
http://www.open-ocean.org/?page=17
I would consider vortex in this area before hydrothermal activity.
feet2fire,
I discussed the lack of 1000m data – not enough floats, not enough data. Plumes are small a 10 times the depth of the 100m. Maybe 1/10 the size. So you need 10 times the floats to detect it.
Understand most of the swath of blue in that area is smearing of data. I think there may be 5-20 floats total in the area. Plus if you go East of the East Pacific Rise you don’t find any floats in that region – where you would see the small starts.
As someone noted, you have to use those animations with care.
AJ –
Point taken. I expect that you are completely correct on the plume thing. But from 100m to 0m there should be some reasonable similarity in the plume patterns and their surgings and recedings.
As to the 1000m readings, I have a question: If in Indonesia where there are no 1000m readings they show white, then why don’t show white in the east where are no readings?
In addition, at 100m I still don’t see any heat near the American coast. At that depth, there doesn’t seem to be any appreciable movement of the colder-warmer zones. Those hot points are real, but not significant, not in any way I can see. They leave the coast and merge, and don’t seem to have any effect. Yes, the surface temps have their surges, but I don’t see any of that emanating from below. I wanted to see it, but I don’t. I don’t see any way that proposed ocean bottom heat in that zone could possibly make it to the surface without showing up at the 100m depth. It has to show somewhat of the same activity; I don’t expect it to be as big, but I see none at all, other than those three hot points.
Although it was a good enough idea – one that needed to be asked – I don’t see it in the ARGO data.
Steve Garcia
For what it’s worth. I looked at Google Earth and focused on the Pacific ocean along Peru and up along Mexico. I don’t have any idea how accurate the ‘view’ is but it was fascinating. Somewhere off the coast of the Peru/Chile border there appear to be a cluster of sub-sea mounts that had a distinct shape of a volcano. If the elevations indicated on GE were correct I believe the water depth was 16k – 18k feet. The trench at the subduction was even deeper.
I was never able to find any info as to the speed of the Humboldt Current. Question is: If there were a powerful hot vent heating a plume / strand of water over 3 miles below the sea surface in a fast moving current, how long or far would it take for that plume to reach the surface?
Another interesting point was the sea floor just off Panama. There is a very large rise there that would have a major influence on any currents that may be present.
Check it out. It’s fascinating and much more so if accurate. If there is a link that would reference to the speed of the Humboldt Current, please advise.
When you look at the sea temperature anomaly maps from the NASA site file AMSRE_SSTAn_M it is clear the huge hot spots occur raising the temperatures by about five degrees in tight regions before dissipating in the way one would expect any localised heat source to do. Can anyone explain the mechanism whereby heat is transferred to these highly contained regions from hotter areas but then are unable to continue to contain them once released there?
Could it be that these hot spots are the actual location of the source of the warming especially that in the remaining areas there is a clear and undeniable cooling effect dominant?
How much has been spent on physical research into these regions compared to the lavish spend on computer modelling to eliminated the possibility of volcanic or other heat sources. Since we are told the science is incontrovertible it should be sufficiently large to be readily quantified?
Thanks, Strata, for a great post – very thought provoking.
Sandy says:
February 15, 2012 at 6:20 am
“I’d suggest that geothermal heat affects the West Pacific more. Warm salty waters collect in the abyssal deep held down by the less salty continental run-off. Eventually, like a lava lamp, globs of abyssal warm water contact the West Pacific Warm Pool and El Ninos predominate. After 30 years or so the abyss is drained and La Ninas dominate while the abyssal reservoir recharges, for 30 years on so.”
I agree. We know so little about what goes on in the depths of the ocean it’s hard to understand what we observe in shallower areas of the ocean and at the surface. I think both Strata and yourself have identified at least two areas of conjecture worthy of further research, but until we have some numbers for the magnitude of these effects, we are still just left with unknown unknowns and speculation.
Here is something that may be related.
At least 264 dead bottlenose dolphins have washed ashore over a stretch of Peru’s northern coast, officials said as they seek to discover what killed the marine animals. The dead dolphins were found over a 103 km stretch of sandy beach, Edward Barriga, an official with Peru’s Oceanic Institute, said. “We have taken samples to determine the cause of death,” said Mr. Barriga, speaking from the city of Lambayeque, adding that vast quantities of dead anchovies had also been found in the region. The dolphins may have been killed by the impact of off-shore oil exploration and drilling in the region, said Carlos Yaipen with ORCA, a non-governmental group that focuses on helping ocean creatures in the South Pacific. The mass dolphin deaths are a “very serious” issue, Mr. Yaipen said. The head of a Lambayeque group representing aqua-farmers, Jorge Cabrejos, said the anchovies appeared to have eaten contaminated plankton, which then sickened the dolphins that ate the small fish. Thirty-four of the world’s 81 cetacean species are found off the Peruvian shores, 17 of which are dolphins. Of those, the most common is the bottlenose dolphin.
http://www.ntnews.com.au/article/2012/02/14/288701_fishing.html
Mike K says:
The dolphins may have been killed by the impact of off-shore oil
Henry@Mike K
Let us keep and/or wait for the facts, before we start blaming,
otherwise we make the same mistake as previously,
blaming the (poor) CO2 (carbon dioxide) for global warming,
when the facts clearly showed me that it was not so.
http://www.letterdash.com/HenryP/more-carbon-dioxide-is-ok-ok
I once wrote a post here called The Trade Winds Drive the ENSO.
http://wattsupwiththat.com/2009/02/17/the-trade-winds-drive-the-enso/
It’s still working as outlined.
Eastern Pacific Trade Winds versus the ENSO.
http://img525.imageshack.us/img525/2231/ensovs175wtradewindsjan.png
Full Pacific Trade Wind Index versus the ENSO..
http://img513.imageshack.us/img513/5108/ensovstradewindsjan12.png
I think they are going to slow down soon and we’ll move into an El Nino (but that remains to be seen.)
Marine Mammals die for a lot of reasons some of which we are still quite clueless. Why do dolphins and whales of all kinds beach themselves to essentially commit suicide? Did they get bored with life and the futility of their existence? Is it a bacterial infection of some kind as some have suggested? Is it the changing magnetic lines of force from the earth that confuses them? What will happen when the poles shift their magnetic polarity?
Making claims the oil company did it is rather a far fetched assertion since we have been doing off shore drilling for decades without similar results. Sorry, it doesn’t pass the sniff test.
Strong Suggestion for Everyone: Take down the anomaly-blinders for just long enough to re-acknowledge the dominance of the year.
Bill Illis (February 17, 2012 at 7:07 am) is right. It’s about wind. Everyone here needs to read up on what climatologists call “thermal wind“. I can’t see the discussions at WUWT EVER advancing much if people don’t. I’ve posted a bunch of animations (will run on Firefox but not Internet Explorer) to help stimulate better multivariate awareness:
http://wattsupwiththat.com/2012/01/31/a-japanese-puzzle/#comment-882297
People who persist in an exclusive focus on TSI & the heat capacity of air are totally missing the boat. One gets the impression that most contributors here think the oceans just circulate themselves, without any input from wind. Such conception is fundamentally wrong. I encourage readers to make an effort to shed some ignorance. Start by just lifting a finger today. Watch the climatology animations comparatively and learn that ABSOLUTE (not anomaly) equator-pole temperature gradients drive the pressure gradient force that drives wind that drives ocean gyres. More details can come later, but people need to first understand that ocean surface currents are driven by wind. (Climatologists aren’t wrong about everything!) The animations should help people efficiently establish this MISSING connection in their conception. Vukcevic in particular: Please stop ignoring this; it’s FUNDAMENTAL. Best Regards.
Henry@Paul
Well, here are the facts, as I see them happening,
since 1974,
http://wattsupwiththat.com/2012/02/15/do-underwater-volcanoes-have-an-effect-on-enso/#comment-893299
Obviously you are unaware that the ozone layer is shielding us from at least 20-25% of all incoming sunlight?
The heat is coming from the other side of Central America, and the regions are small because the winds are passing through valleys and lowlands. The temperatures on the west side vary based upon the temperature on the east side and, literally, upon which way the wind is blowing.
Step through the animation at:
http://earthobservatory.nasa.gov/GlobalMaps/view.php?d1=AMSRE_SSTAn_M
You’ll see that the mountain jets on the west side of Central America reflect the temperature on the east side. The jet across Mexico in winter tends to be cold, because the Gulf of Mexico waters tend to be cool. When the water is warm on the east side, the wind hitting the water on the west is warm enough to offset the cooling effect of moving air.
Paul Vaughan says:
February 17, 2012 at 10:34 am
Thanks, Paul. Some ocean surface currents are indeed caused by wind. However, if there were no atmosphere at all, there would still be ocean currents, driven by things like thermal and thermohaline circulation … so while climatologists aren’t wrong about everything, if your claim is that climatologists think all ocean currents are driven by winds, you are wrong. Wind is most assuredly very important in the climate, but climatologists are well aware that things other than winds both create and affect ocean currents.
Finally, in general winds are a function of ∆T, a temperature difference between one place and another … and as such, if winds are as important as you claim (and I think they are), a focus on T and ∆T and TSI and the heat capacity of the air and a host of other wind-related questions must also be very important.
w.
The Trade Winds are directly related to the temperature of the equatorial Pacific in the upper 300 metres.
If it is colder in the East Pacific then there is little convection and little cloud and little rain in the eastern 2/3rds of the Pacific (almost none in fact). If the West is warmer, then there is more convection there and more rain and so on. So a cold East, warm West and the Trade Winds then blow stronger, which draws up even more cold water from below and then the winds blow even stronger and it becomes a self-reinforcing oscillation.
Eventually all the colder water is blown to the West, which pushes the warm water down and it recirculates back underneath in the Equatorial Pacific UnderCurrent which then eventually surfaces in the East at the Galapagos Islands. Now we have a warm East and a cold West and opposite convection cells. The Trade Winds then slow down and the warm water remains at the surface and even sloshes back to the East and viola, an El Nino.
http://img859.imageshack.us/img859/6401/ensoeuotavs175wtradewin.png
A self-reinforcing oscillation (up to a limit at which time it reverses and becomes self-reinforcing oscillation in the other direction).
The El Nino (which is now at 150 metres depth and between 135E and 160W) is coming sometime.
http://www.cpc.ncep.noaa.gov/products/analysis_monitoring/ocean/anim/wkxzteq_anm.gif
A few days ago I came across something about the radioactivity driving the tectonic plate movements, which was mentioned by gymnosperm says:
February 15, 2012 at 10:43 pm, I post for interest.
http://www.madsci.org/posts/archives/1998-10/905866177.Es.r.html
“Thank you to Mike Fox, who pointed out that radioactivity is the primary source of the roughly 10% excess heat that the Earth radiates, and further that radioactivity provides the heat which drives geophysical processes such as plate tectonics, the Earth’s internal dynamo, and other effects of convection within the Earth.”
I’ve been looking at the Holocene Maximum and came across this on ENSO – posting for interest:
http://www.fs.fed.us/ccrc/bibliography/5_3_holocene.shtml
^ topLoubere, P., M. Richaud, Z. Liu, F. Mekik (2003). Oceanic conditions in the eastern equatorial Pacific during the onset of ENSO in the Holocene. Quaternary Research 60 (2): 142-148
“ABSTRACT: Records from South America show that modern ENSO (El Nino-Southern Oscillation) did not exist 7000 cal yr B.P. and has developed progressively since then. There has been little information available on oceanic conditions in the eastern equatorial Pacific (EEP) to constrain explanations for ENSO onset. We report quantitative observations on thermocline and mixed-layer conditions in the EEP during ENSO start up. We found important changes in both the thermocline and the mixed layer, indicating increased upwelling of cooler waters since 7000 cal yr B.P. This resulted from change in the source and/or properties of waters supplying the Equatorial Undercurrent, which feeds upwelling along the equator and the Peru margin. Modeling shows that ENSO is sensitive to subsurface conditions in the eastern equatorial Pacific and that the changes in the thermocline we observed were driven by extratropical processes, giving these a role in conditioning the development of ENSO. This is in contrast to models that call for control of equatorial Pacific oceanography by tropical processes only. These infer stronger upwelling and cooler surface waters for the EEP during the mid-Holocene, which is not supported by our results.”
So could it be that glacial conditions suppress tectonic/volcanic activity and these resurface, as it were, after the peak of warming in interglacials? Will this start to reverse back as we return to glaciation? Or am I reading this wrong?
Willis, WUWT used to be graced by the comments of an oceanographer going by the online handle “sky”. Sky patiently explained on a number of occasions that the wind-driven ocean currents are an order of magnitude above the other types of currents. Almost everyone ignored sky on that important point, possibly an unfortunate consequence of widespread, excessive, & often even exclusive anomaly-think. Sky’s notes dovetail cleanly with patterns in EOP (Earth Orientation Parameters, not to be confused with earth orbital parameters) & AAM (atmospheric angular momentum). Anomaly-think blocks the conceptualization of newcomers (& perhaps even some veterans) from a more lucid awareness of a simple, dominant mode of variability: the year. This is part of the reason why I’m visually [ http://wattsupwiththat.com/2012/01/31/a-japanese-puzzle/#comment-882297 ] drawing attention to the HUGE quantities (climatologies) subtracted out to obtain anomalies. EOP & AAM are not drivers, but rather INDICATORS of climate; this is probably at the root of some of the misunderstandings that pop up every time we try to have a sensible discussion at WUWT about LeMouel, Blanter, Shnirman, & Courtillot’s (2010) seminal demonstration of the solar cycle in terrestrial wind. I’m sure it will take MANY more discussions before more are ready to understand how interannual variability masks the solar cycle envelope in semi-annual terrestrial wind. Hopefully sky will drop by again. In the meantime, people can watch the animations and note the crystal clear parallels between winds, water vapor fluxes, & the major ocean gyres [ http://wattsupwiththat.com/2012/01/31/a-japanese-puzzle/#comment-882297 ]. It could be VERY entertaining to see someone TRY to argue that no such parallels exist. Regards.
Paul Vaughan says:
February 17, 2012 at 4:49 pm
Willis, WUWT used to be graced by the comments of an oceanographer going by the online handle “sky”. Sky patiently explained on a number of occasions that the wind-driven ocean currents are an order of magnitude above the other types of currents. Almost everyone ignored sky on that important point, possibly an unfortunate consequence of widespread, excessive, & often even exclusive anomaly-think.
Like the
http://www.usatoday.com/weather/antarc/sun/2001-01-30-katabatic-winds.htm ?
I really don’t know what this argument is about, I was just browsing, but isn’t that wind a result of warming at the equator and if this is cold, and presumably deep, water flowing northward it will be displacing the warmer waters it meets which will add to the evaporation levels which in turn will strengthen it? Is it part of the Trade Winds pattern that Bill Illis mentions?
Paul Vaughan, thanks for all the puzzle pieces. The link on Low Level Cloud Cover explains a lot. Albedo.
http://i52.tinypic.com/auw1s0.png
The cure for ignorance is more vitamin K (knowledge).
So many variables, so little time.
@Bill Illis says:
February 17, 2012 at 7:07 am
Bill – Thanks for the link. I’ll first out myself as someone who has a lot of difficulty seeing how winds – which pack 1/200th the pushing power of water – blowing at the surface can ‘entrain’ water more than a few feet below the surface. Especially when we are taught that waves are not water moving laterally, but moving up and down in a cycloidal way – this implies that though stronger wind gives more amplitude to waves, it doesn’t do any more than that. And, yes, the more amplitude, the deeper the effect of the wind – but it still is not moving laterally. Or are there things they don’t teach us?
This comment is more for my education than anything, but these following questions I need to get a handle on.
I see what you are saying – there IS a really strong correlation between the Trade Winds and ENSO. As we discuss here fairly often, though, correlation isn’t cause and effect. Especially when you say this:
From my perspective those two facts – very good correlation and that you don’t know what causes the Trade Winds – suggests to me that they might have the equation backward.
From a strictly logical perspective, It seems as likely that the ENSO is driving the Trade Winds as the other way around.
Alternatively – and still just in terms of logic – both ENSO and the Trade Winds might be being driven by some third X factor.
Your uncertainty even carries over to the Western Trade Winds:
Tied together with my doubt that winds actually move water at all (other than up and down, according to the textbooks), the Trade Winds seem to only correlate with ENSO, not necessarily cause it. (Or cause other ocean currents, either.)
Again, I am commenting not to argue, but in order to be educated, with these seemingly contradictory ‘facts’ in my head preventing me from being able to accept this “winds cause currents” concept or “Trade Winds cause ENSO” concept, on the authority of what the climatologists tell us – even with such good graphs as you showed us.
The contradictions lead me to think the answer is not really known, but that someone is confusing correlation with ’cause-and-effect’.
Bill Illis –
I guess what I am saying is, more or less, a question of, “Which came first – the chicken or the egg?”
In the case of chickens and eggs, we know that both actually came from reptiles/dinosaurs.
But then that always begs the question of, “Which came first, the dinosaur or the egg?”
And it certainly applies to all life, as well.
And the life of ENSO, too.
There is a cycle, perhaps, like the carbon cycle or oxygen cycle, in which there is no start – or in which every step is its own start, based on what the local environmental variables are.
Steve Garcia
Paul Vaughan says:
February 17, 2012 at 4:49 pm
Paul, I read what you wrote, and I looked through a selection of the links that you linked in your “A Japanese Puzzle” post … and I came away totally confused.
Perhaps you could boil your main points down to about three, and just put them out there? I’m not going to wander around through the 29! links you posted and try to infer what you are trying to say.
In the classes I’ve taught I emphasize what I call “BCI”. That stands for “brief, clear, and interesting”. I suspect you have interesting points to make … I just don’t know what they might be.
w.
Myrrh says:
February 17, 2012 at 3:33 pm “…that radioactivity is the primary source of the roughly 10% excess heat that the Earth radiates…”
Some of the heat in the Earth’s core and mantle is the result of radioactivity, but more of it is simply heat of compression built up as the forming Earth accreted more and more material and grew larger. Much of that original heat is still contained in the core and mantle, but it tries to escape as it can. Direct conduction through the crust is not very effective – google “geothermal gradient” or go here:
http://www.geol.umd.edu/%7Ejmerck/geol100/lectures/10.html
More efficiently, the innards (asthenosphere) of the Earth are hot enough to flow and thus convect, and bring hot stuff directly to the surface in the spreading centers (mostly hidden in the ocean basins, but cutting through Africa in the East African Rift). In other places, the asthenosphere puts up small plumes of hot material, forming volcanoes as in Yellowstone or Hawaii. Finally, the asthenosphere heats and partially melts cold oceanic crust that is dense enough to sink back into it, and forms arc-related volcanoes, just like the line of volcanos AJ depicts in one of the figures at the top of this page.
That’s where the Earth’s inner heat is escaping, and it is nowhere near amounting to 10% of the Earth’s radiated energy. There is thorium and uranium and some other radionuclides in the Earth’s crust, but the heat they generate is a small number.
Myrrh says:
February 17, 2012 at 4:36 pm “…So could it be that glacial conditions suppress tectonic/volcanic activity and these resurface, as it were, after the peak of warming in interglacials? Will this start to reverse back as we return to glaciation? Or am I reading this wrong?…”
About the only thing glacial cover can do relative to a volcano is increase the pressure on the material beneath it. This pressure might stop a cool magma from reaching the surface (again go here and look at the discussion of “How do magmas form?”:
http://www.geol.umd.edu/%7Ejmerck/geol100/lectures/10.html
On the other hand, if the volcano melts its way through the ice, the pressure release may stimulate an even greater volcanic episode. Recall the situation last year in Iceland where a volcano went active beneath its glacial cap.
As far as tectonics, which I take to mean “plate tectonics” a glacier the size of Antarctica would probably have no measurable effect on the rate of one plate crunching into another, or subducting beneath another. If nothing else, the masses involved are likely different by orders of magnitude, and the glacier is the lightweight.