I found this post interesting, especially after looking at some of the images that show what appears to be a tight hot spot upwelling off the coast of Costa Rica. But I simply can’t see enough energy in this venting to account for the massive energies dissipating in ENSO events. But, let’s give it a shakedown. I welcome comments from readers on this topic. – Anthony
Argo Data Confirms El Niño/El Niña Caused By Underwater Volcanoes
Guest post by AJ Strata of The Strata-Sphere
Last week I postulated that the El Niño/El Niña effect was not due to solar or atmospheric conditions, but actually caused by underwater volcanic activity along ocean ridges off the West coast of South America. To see whether my theory held water I decided to look into the Argo Float data to see if there it was showing a warm upwelling of water in this region. I apparently was correct.
My initial assessment was that the frigid Humboldt Current that comes north from the Antarctic region along the west coast of South America (the mirror image of the current that drops down from the Arctic along the west coast of North America) could not be warmed so drastically in such a short time by sun and air alone. This is due to the physics of ocean currents and the massive amount of heat required to warm tons of cold water moving northward per second:
Gyres are caused by the Coriolis Effect; planetary vorticity along with horizontal and vertical friction, which determine the circulation patterns from the wind curl (torque).[1] The term gyre can be used to refer to any type of vortex in the air or the sea, even one that is man-made, but it is most commonly used in oceanography to refer to the major ocean systems.
…
The “South Pacific Gyre” is the Earth’s biggest system of rotating ocean currents, bounded by equator to the north, Australia to the west, the Antarctic Circumpolar Current to the south, and South America to the east.
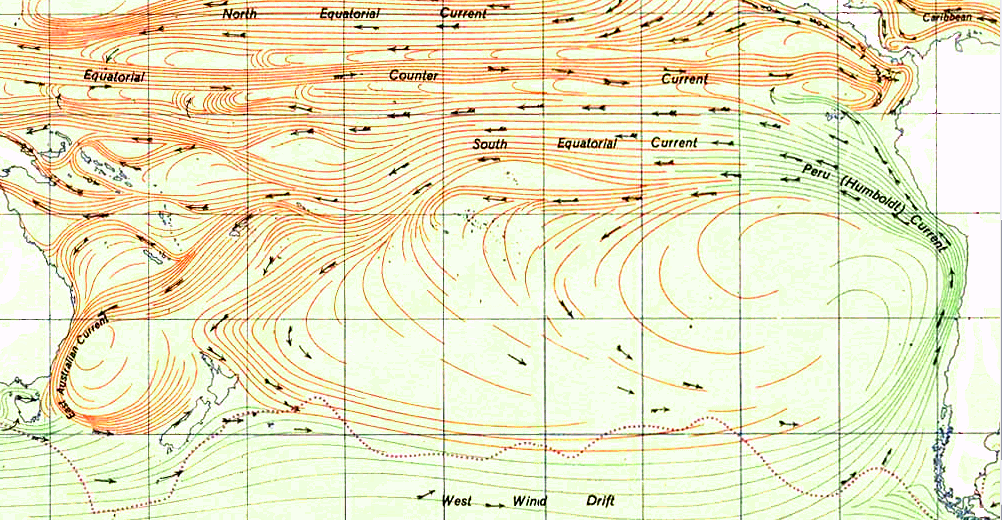
As can be seen in the graph above (click to enlarge), the Humboldt Current is one of the largest on the planet. It is infeasible that El Niño can arise from atmosphere and sun alone by warming this mass of water. Neither air temp or solar radiance change enough to cause this phenomena.
At this site you can watch animation of nearly 5 years of Argo data on the tropical region of the Pacific Ocean. It is fascinating and proves my earlier conclusion that the warm waters of El Niño arise from the eastern pacific and travel west – not the reverse as is the current (now defunct) theory. You need to set the start date on the left to the earliest date in 2007 and the end date to the latest in 2012.
I suggest you first watch the surface animation, then go the the 100m data. What you will see in the 100m is hot water upwelling off the coast of Costa Rica (which was not in the zone I originally predicted the upwelling would occur BTW). I have taken a few snaps of the data from Oct 2008 to Feb 2009 at 4 week interval to highlight what I discovered.
On this first image (click to enlarge) we see the very beginnings of the upwelling off the coast of Central America (area highlighted by red rectangle with a small blue dot). As time progresses the upwelling grows, moves west and another upwelling appears. The images are from 10_22_2008, 11_26_2008, 12_24_2008, 1_21_2009 and 2_25_2009.


Now some may ask why didn’t Argos detect the upwelling deeper (1000m)? The answer is in fluid dynamics. The hot spot is very narrow above whatever thermal vents are the source of this warming. The Argo floats are not very dense in this region. So the warm column of water upwelling has to spread out as it rises, making it more likely to be detected by the Argos floats. By the time it hits the surface the warm water really spreads out over top of the cooler layers below.
As this March 2009 surface image shows there are two upwellings in the area, but the one off Costa Rica is missed at the lower depths (again likely due to the density of sensors being so low in this area). And there appears to be a 3rd upwelling off the coast of Peru.

The activity of Nicaragua and Costa Rica is right along the Cocos Plate.

The Peruvian region I highlighted in the previous post and is linked to the Pacific Rise. Higher volcanic activity in these areas clearly cause more warm water to rise and heat the surface, creating the conditions for El Niño. Lower activity allows the cooler currents to dominate, bringing on El Niña.
I don’t see this as likely. The periodicity of the ENSO can’t be due to volcanic activity. I’d consider the possibility that volcanoes play a part, but I just done buy the major premise.
Richard C (NZ) says:
February 15, 2012 at 2:57 pm
It is a huge amount of energy, but it’s a much huger ocean … yes, the flows (60 MW) sound stupendous, it’s true. But the ocean is a mighty big place. And in the overwhelming, vast majority of the ocean, you know how much hot water is gushing out of the sea floor?
Zero. Zip.
It’s the same on land. Volcanos on land put out vast, stupendous, unimaginable amounts of heat. Think about the flowing magma on the Big Island of Hawaii … but on most of the planet the ground is, well, cold, not to put too fine a point on it.
It’s not hot. It’s not tepid. Not even slightly warm. It’s cold. No hot springs.
As a result, the total energy averaged out over the entire ocean is small.
There is another consequence of the hot water vents being concentrated in a small area of ocean. It puts a limit on the total heat coming from them. For example, if there is 400 terawatts of energy as your source claims, that’s about 1 W/m2 over the whole ocean.
But it’s not over the whole ocean. It’s over maybe at most 1% of the ocean. That means it would have a local intensity of 100 W/m2 or more for thousands of miles of length … and that would have the oceans bubbling and boiling above the hot vents in short order.
In other words, the concentration in such a small area puts a limit on the total heat flow.
To make claims like that without doing the numbers is … never mind.
The average global geothermal heat is often taken to be around tenth of a watt per square metre or less. In addition, it is a static flow by and large. By that I mean it changes more on geological than human time.
Since it is small and changes very slowly, I would ignore it in my model. And for the current generation of climate models, a fraction of a watt is way below their error bounds in any case.
w.
The superheated water (100 C plus) that has been measured already does not produce “bubbling and boiling” because the pressure raises the boiling point, see Superheated water http://en.wikipedia.org/wiki/Superheated_water
“I would ignore it in my model”
That is your prerogative Willis, others may be so dismissive.
BTW not far from where I live on the coast of NZ (Bay of Plenty volcanic region), geothermal energy is being exploited at pace. The same geology extends into the Pacific up through the Kermadec Trench, one of Earth’s deepest oceanic trenches, reaching a depth of 10,047 metres. A compendium of recent studies of it is here:-
‘The Kermadec volcanic region: An overview of geological discoveries from the last decade’
http://www.thekermadecs.org/symposium/abstracts
Including:
‘Submarine massive sulfide mineralization and hydrothermal activity along the Kermadec Arc, the world’s most hydrothermally active’
Matthew I. Leybourne,
GNS Science, Lower Hutt
“The Kermadec intra-oceanic arc is ~1,220 km long, the result of subduction of the Pacific Plate beneath the Australian Plate. Attention has only recently been given to arc systems as locations of hydrothermal activity and formation of significant submarine massive sulfide (SMS) mineralisation, compared to the mid-ocean ridges. Exploration along the Kermadec arc began in 1998, followed by three systematic hydrothermal exploration cruises in which the entire arc was surveyed – NZAPLUME I in 1999, NZAPLUME II in 2002 and NZAPLUME III in 2004. Additional cruises have explored the Havre Trough, the back-arc to the Kermadec arc, as well as submersible, ROV and AUV studies on specific volcanoes. Our exploration along the arc has shown that the majority of the volcanoes and calderas are hydrothermally active, ranging from diffuse low-temperature venting to robust black-smoker style venting, with temperatures up to >300 °C and with associated SMS mineralisation. Incidence of hydrothermal activity varies from ~67% of the volcanoes along the southern portion of the arc, to ~83% in the central portion, to essentially 100% in the northern part of the arc.
The primary exploration tool has been the mapping of hydrothermal plumes in the water column overlying submarine volcanoes”
So yes, “the ocean is a mighty big place” but it’s still being explored let alone any knowledge of the time frames of changes to oceanic geothermal heat outflows. We don’t even know the current figure with any certainty (“around tenth of a watt per square metre or less” = WAG) so how can we know the change?
I’m surprised that no one mentioned Kelvin Waves.
http://earthobservatory.nasa.gov/IOTD/view.php?id=43105
excerpt:
Where do Kelvin waves come from? Under normal conditions, the tropics’ prevailing easterly winds push Sun-warmed surface waters across the Pacific from the Americas toward Indonesia, creating a deep pool of warm water in the western Pacific. During an El Niño, the trade winds falter, and sometimes even reverse, for months. When the winds that maintain the warm pool falter, a large pulse of warm water from the western Pacific slides back toward the east.
The missing heat, according to Hansen, hides on the ocean bottom “still in the
pipeline”, as everybody knows, and these hot spots in the Pacific are NOT volcanoes
but pipeline leaks or one end of the PIPELINE! Volcano nonsense…. Its the
pipeline, stupid…….This is where the heat is coming out…..
…….and steaming….. Hansen is smart and detected this already before WUWT
got the clue…..as always….
AJSttrata says:February 15, 2012 at 4:12 am
Great post and thought provoking.
My first impression, when viewing the animation I am struck by the temperature differential between the Pacific side and the Caribbean side of Central America. One would expect solar gain in the protected/isolated Caribbean basin to achieve uniformly higher temperatures than in the Pacific that is exposed to wide ranging cold currents. Quite the contrary. The depths are not dissimilar. The shallower reaches between Honduras and Jamaica should be warmer yet are not. It is absolutely conceivable that there is something else contributing to Pacific temperatures. Where do I apply for our grant?
Just as global warming causes colder temperatures, maybe the reciprocal is true that colder currents cause warmer ocean temperatures /sarc.
People should bear in mind the distinction between hydrothermal venting and active vulcanism. There is widespread hydrothermal activity in the pacific northwest that is not associated with any active vulcanism. Isotope dating indicates that many of these waters are thousands of years old, indicating very slow recharge cycles if in fact there is surface recharge. Some is “new” water. We cannot think of aquifer recharge rates in human terms or lifetimes.
A sample inventory: 6,155 geothermal springs and wells are mapped in this publication.
http://pubs.usgs.gov/of/1995/of95-689/
“Digital Maps of Low- to Moderate-Temperature Geothermal Springs and Wells in the Pacific Northwest: A Contribution to the Interior Columbia Basin Ecosystem Management Project”
I have always thought that there is no way that the sun and atmosphere can heat the oceans to any depth at all other than in very shallow water, so the obvious cause is the heat coming from within the earth.
Could the periodicy be caused by some sort of tidal motion affecting the molten magma beneath the sea floor as it does the oceans causing more heat to be released during times when earths orbit brings it closer to the sun as it has been in the recent past I think.
Sorry no data, just gut feel.
I said this a LONG time ago, based on falsifying the assumption that the Earth-source heat values in the heat balance diagrams is zero. Plus the fact that they keep finding more vents. Plus the locations of the vents
PLUS, I kept asking what is the SOURCE of the El Niño heat? And EVERYWHERE I looked online, all I could find was that El Niñ was, itself, the source – if they even asked the question.. Which was ridiculous
I got zero response here, which was very disappointing.
I am glad that someone has taken it and run with it, though. Right or wrong, it is a question that NEEDS to be asked.
More comments later. This is something I’ve put a lot of thought into…
Steve Garcia
http://www.geostreamconsulting.com/papers/Leybourne_Oceans_Fin.pdf
Check above out.
and
http://chiefio.wordpress.com/2011/06/24/megaplumes-and-volcanic-gasses/
From ‘Megaplumes and Volcanic Gasses’:-
“The energy content is an order of magnitude greater [than ordinary plumes], and the thermal power may be many orders of magnitude greater,” Murton said.
“A normal hydrothermal vent might produce something like 500 megawatts, while this is producing 100,000 megawatts. It’s like an atom bomb down there.”
Recent studies have attempted to factor the heat from the world’s known hydrothermal ridges into ocean circulation models.
“Some studies estimate that for the Pacific, background thermal heating might increase ocean circulation by up to 50 percent,” Murton said.
==========================================================================
Looks like at least some of the modellers made a start if they “attempted to factor” the “known” hydrothermal heat into the models – but how much is known?
Gerlach, T.M., 2011, Volcanic versus anthropogenic carbon dioxide: Eos Trans. AGU, v. 92, n. 24, p. 201-202.
Gerlach, T.M., 1991, Present-day CO2 emissions from volcanoes: Eos Trans. AGU, v. 72, n. 23, p. 249 and 254-255.
http://hvo.wr.usgs.gov/volcanowatch/2007/07_02_15.html
http://www.agu.org/pubs/pdf/2011EO240001.pdf
This guy needs to be debunked. Seriously, this is USGS’s only main pillar that’s holding up the volcanoes don’t produce much CO2 myth (esp the 3million underwater ones…)
How can you measure all these things you don’t even see or monitor? How did we monitor Pinatubo and Iceland volcano?
http://www.agu.org/pubs/pdf/2011EO240001.pdf
Like this article, where is the material and methods? And why does it specially attack Ian Plimer? Whats the point, it’s a journal article is it not?
Willis Eschenbach says:
February 15, 2012 at 3:37 pm “…Volcanos on land put out vast, stupendous, unimaginable amounts of heat….” Yes they do put out lots of heat, over amazingly long periods of time. To us little humans – especially ones who aren’t geologists who have had to grapple with these things to some extent – the heat and time seem unimaginable – but they can be quantified (Willis, I’m just using your words as a springboard to get to a point).
The map that AJ shows of the volcanoes above the subducting Cocos Plate is interesting. Let’s pick one volcano – San Salvador in El Salvador. 3000 meters high (apparently lost a 1000 meters to an eruption), 14 kilometer base. Volume = ~155 cu. km.
Assume the magma chamber supporting that cone is 10X the volume = 1550 cu km
That’s ~1.6e18 cu cm of rock, with a density (we’ll assume basalt – although this guy erupts andecite-dacite material – because it’s a bit denser and hotter) of 2.8 gm/cm = 4.5e18 gm of hot magma. How hot? About 1200˚C. Basalt has a specific heat of about .95 j / g˚K.
Now let’s put it underwater and instantaneously – as opposed to tens of thousands or even millions of years – release that heat into the water, cooling the basalt from 1200˚C to 0˚C. This releases 4.5e18 gm x .95 j / g˚K x 1200˚K = ~5e21 joules into water. That will heat ~1e21 grams of water 1.0˚C. The ocean contains about 1.3e24 cu cm water; this heat will affect 7/10,000 of those cc’s. You will never detect it over the entire ocean; but it would have some, perhaps a great deal, of effect locally. (I’m glossing over density issues with water, just assuming 1g/cc).
Now I’ll wave my arms: All the submarine volcanoes in the world, including the volcanic activity along the seafloor spreading trenches, probably amount to no more than 10 times that kind of heat input into the ocean. And there is no heat leaking through the basaltic floor of the ocean from the asthenosphere, except at the trenches and seamounts. The seafloor is cooling and becoming dense so it can be subducted. Cold basalt is a very good insulator.
So the undersea volcanoes can’t heat the oceanic bathtub and neither can the solar hair dryer.
So what’s left?
this is something of a brain sail, derived from the brain storm and concept map notions.
I haven’t read much about it and have no doubt that my ignorant questions will test some participants. nevertheless there may be some considerations worth following up
I was viewing the area on google maps – a trench ends close by, there is a slight shelf, the area is tectonically dynamic. the equator is close by, is there orographic weather? I wonder about cloud cover over the area in question.
I wonder about geo magnetic considerations – harmonics, grid theory. I recall reading about peculiar events at magnetic equators, to wit, instability, loss of integrity. a quick search reveals ionospheric currents, toroidal fields, but not the schematic I’m looking for. is there possibly toroidal action or magnetic anomalies in the area of consideration? I wonder what goes on at the intersection of the magnetic equator and the trench?
I’m thinking that we are looking for similar rhythm patterns to el nino and la nina appearances.
a seasonal inquiry is reasonable. I understand el nino to be derived from seasonal influences. the accumulation of heat occurrs in a period of a few months and dissipates over a few years. conversely, la nina sends cold that dissipates in a shorter period.
sea currents are muchly set by land and sea floor. the sea floor under consideration does have the end of a trench in it, possibly allowing for dynamic mixing of water. it’s reasonable to assume the trench has a profile on the other side of it, with possibly similar dynamism, but a lot hotter.
my guess at this stage is that there are several events which lead to the formation of el nino. I’m leaning towards cloud free doldrum like conditions.
but my first question is what events show the same periodicity?
My spanish has grown weak. I cannot find the right information at http://www.ovsicori.una.ac.cr/sismologia/sismologia.htm
But, a hotspot with near surface magma would be seismically active. I cannot find references to that area having swarms of tremors that would confirm volcanic activity. While an interesting idea, other things may not bear it out. Did I miss a seismological record that infers this activity might be there?
Final comment on this post. If one goes to the website where the pictures posted at the beginning of this article come from:
http://bulletin.mercator-ocean.fr/html/produits/bestproduct/welcome_anim_en.jsp?zone=pa1
and watch the animations over a long enough time period, there is absolutely no doubt that the heat spreads from west to east (Indonesia to Central America). The hot spots along the Central American coast wax, wane and translate. They must represent some near-shore interaction of wind and water and sun, and I strongly believe they have no relationship to volcanism (that’s happening onshore in Central America, many miles to the east).
PDO, ENSO, and MJO all seem a bit of the same critter, albeit at different temporal and spacial scales. Since MJO is very clearly wind driven, propogating from East to West, it seems folly to discount the wind and Eckman transport in ENSO. Nevertheless, it has long been troubling that global average temperature seems responsive to PDO and ENSO. Why should GAT care which side of the Pacific the winds encouraged the abyssal waters to upwell on? Either our measurements are more biased than we can imagine, it is as simple as “who turned off the air conditioner”, ore something else is going on.
@Just The Facts Please 2:33 am:
“I think it’s pretty well established that changes in the trade winds are what cause the ENSO.”
Not meaning to be argumentative, but I’ve looked for anything that shows this to be anything but an assumption, without success. Can you possibly point at some paper?
Steve Garcia
I think this is a very interesting post. One of the charts (mar 2009) shows what appears to be two or possibly three point sources of heated water off South and Central America. The surface plumes affect regions both above and below the equator.
I read something earlier today (can’t find the link again) that showed a diagram w/ explanation of an expansion / tension zone in the Nazca tectonic plate. It showed a thinning of the oceanic crust located west of the typical trench and subduction zone along the Peruvian coast. I’m sure it was a theory or hypothesis. I’m only making ‘observations’ here and no claims.
Some observations and questions to ponder south of the equator along the Peru (Humboldt) Current came to mind as follows:
1. How fast would the Humbolt Current travel at depth?
2. A possible Nazca tectonic plate expansion / tension zone running in the same direction and under a very strong oceanic current releasing great amounts of heat into the water. The molten reservoir is much closer to the ‘surface’ of the Earth’s oceanic crust under the ocean as opposed to the land surface and would be continually opening with regards to width. Even one or more vents could have the same effect.
3. The cross sectional ‘shape’ of the heated current at laminar flow could likely become similar to an upside down teardrop over distance.
4. In a fast moving current the time for convection and conduction of a rising mass of water could travel a very long distance before reaching the surface and vary surface locations due to other surface and/or current factors.
5. This would not likely be the only factor in the upwelling far from its initial source(s) or regions of origin. Other factors such as trade winds, other ocean currents, underwater geography, etc would all be at play.
6. Consider volcanic activity on land. It can expel it’s content at atmospheric pressure with little resistance. Pressure must build to ‘blow the plug’. Most internal pressure would possibly be released explosively and rapidly.
7. Consider that volcanic activity at deep oceanic depths. It will be restricted to a release against a much greater pressure and viscous medium that may cause a more uniform release.
I’m making no claims, just saying. We don’t know what we don’t know until we know it.
“It is infeasible that El Niño can arise from atmosphere and sun alone by warming this mass of water. Neither air temp or solar radiance change enough to cause this phenomena. “
Wrong conceptualization & wrong variables. Be careful with anomaly-think. Conceptualization needs to be consistent with recorded Earth Orientation Parameters. Interesting article. There is coupling, but we’re not yet at a stage where we can discuss this efficiently. I apologize for not having time to comment in more detail. Best Regards.
It has long been thought that the Mesozioc was a time of unusal spreading of the Pacific and tectonic activity in general. Indeed, for the vast majority of earth history the continents have been swept into a pile by a predominant spreading center in a Panthalassic Ocean. The Pacific is in some sense a relict of the Panthalissic. The Tertiary (and Quaternary, our era) is extraordinary in the dispersion of the continents. This is largely due to the spreading of the Atlantic.Previously there was Tethys, but to nowhere near the extent. It seems like the opposite of a tug of war, a push of war, if you will, depending on which spreading center had a better grip on the continental margins.
The radioactive decay towards the core of our planet supposed to be driving all this is poorly understood, at best. Shame on us to presume anything. First, we need way more data.
If the seafloor is “cooling”, it is being cooled by something. That would be the water which is being warmed by the seafloor. It should be measurable in (missing) degrees Kevin. ;p
AJ Strata;
Edit: “this phenomenon“. It takes at least two to be phenomena. 😉
John Marshall says:
“I repeat, at the position of hot region that seems to originate from below the surface, off the coast of Costa Rica, there is no volcanic activity because of the subduction boundary.”
True, but there is a seamount along the Tehuantepec ridge at about 450 km from the coast that rises about 1818 meters above the ridge line.
It’s apparently similar to the Steel Vendor seamount along the Mendocino Ridge, which is about 420 km from the coast and rises 1806 meters above the ridge.
Dunno if either is volcanic.
GeoLurking’s February 15, 2012 at 10:57 pm
Continued:
Additionally, Costa Rica has several subsea peaks scattered around 7.67°N 85.86°W. One of the taller ones rises 1958 meters above the surrounding seafloor.
FYI –
At http://www.peteraldhous.com/vents.html is a map of the Earth’s undersea vents, including unconfirmed ones.
Almost all appear along plate boundaries, and all in that region appear to, at least of those known. It is possible that people are only looking only along plate boundaries (which makes sense). ONE appears right about where AJ points to. One vent does not seem within magnitudes of being able to do what AJ says volcanoes are doing, but where there is one vent, the map shows there sometimes are more. There are a running string of them on the western edge of the Nazca Plate, for example. It might be a matter of “we won’t know they are there until we look for them.” Even though we are just beginning to find them, thus far a LOT have already been found. How many there are in total is any person’s guess. And how many are along that trench, who knows right now?
That vent is for all purposes ON/IN a trench (the map may be showing its location or the trench location off a bit). This appears to belie what some are saying here, that vulcanism does not happen at subduction zones.
Steve Garcia
@Paul Vaughan 9:40 pm:
Paul, I would tend to disagree. If the sun and atmosphere alone could account for this, the climate guys wouldn’t be talking about “upwelling” of heat sequestered at depth (which I am certain is a speculation trying to explain it within current paradigms). While that sounds reasonable, it leads to further questions, like why is the (needed) huge amount of warm water at depth not rising or staying at the surface to begin with?
Correct – we are not at the stage where we can discuss this efficiently. It is the flounder stage of figuring something out, so it is inefficient by definition. We are looking for the right questions – and that is the most fun part of anything! We lack knowledge about most of it – among which are undersea volcano locations (and their heat output and if they are active in a cyclic way), undersea vent locations (numbers and locations – there is ONE known one, right there – and their heat output and cyclic nature, if any), how the currents mix with the convected heat plumes.
I think it may not be unconnected that Indonesia’s really active and wide seismic zone is right where that 30C water is located in the western Pacific. There may be similar things going on at that end, too. It is a question that cannot be ignore, I don’t think. If undersea vents/volcanoes are capable of causing heat plumes in the Costa Rica area, then the whole world is fair game for the same thing. But that would also be putting the cart ahead of the horse.