I found this post interesting, especially after looking at some of the images that show what appears to be a tight hot spot upwelling off the coast of Costa Rica. But I simply can’t see enough energy in this venting to account for the massive energies dissipating in ENSO events. But, let’s give it a shakedown. I welcome comments from readers on this topic. – Anthony
Argo Data Confirms El Niño/El Niña Caused By Underwater Volcanoes
Guest post by AJ Strata of The Strata-Sphere
Last week I postulated that the El Niño/El Niña effect was not due to solar or atmospheric conditions, but actually caused by underwater volcanic activity along ocean ridges off the West coast of South America. To see whether my theory held water I decided to look into the Argo Float data to see if there it was showing a warm upwelling of water in this region. I apparently was correct.
My initial assessment was that the frigid Humboldt Current that comes north from the Antarctic region along the west coast of South America (the mirror image of the current that drops down from the Arctic along the west coast of North America) could not be warmed so drastically in such a short time by sun and air alone. This is due to the physics of ocean currents and the massive amount of heat required to warm tons of cold water moving northward per second:
Gyres are caused by the Coriolis Effect; planetary vorticity along with horizontal and vertical friction, which determine the circulation patterns from the wind curl (torque).[1] The term gyre can be used to refer to any type of vortex in the air or the sea, even one that is man-made, but it is most commonly used in oceanography to refer to the major ocean systems.
…
The “South Pacific Gyre” is the Earth’s biggest system of rotating ocean currents, bounded by equator to the north, Australia to the west, the Antarctic Circumpolar Current to the south, and South America to the east.
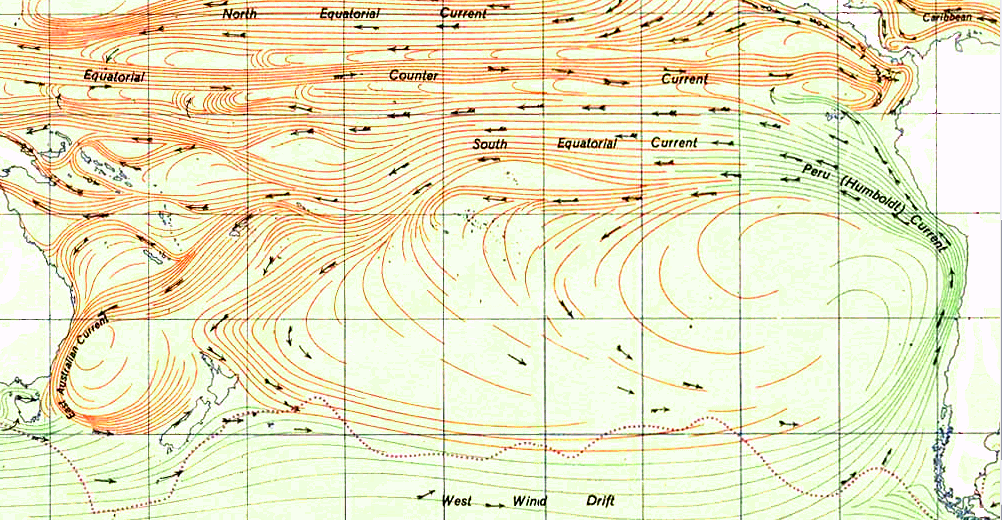
As can be seen in the graph above (click to enlarge), the Humboldt Current is one of the largest on the planet. It is infeasible that El Niño can arise from atmosphere and sun alone by warming this mass of water. Neither air temp or solar radiance change enough to cause this phenomena.
At this site you can watch animation of nearly 5 years of Argo data on the tropical region of the Pacific Ocean. It is fascinating and proves my earlier conclusion that the warm waters of El Niño arise from the eastern pacific and travel west – not the reverse as is the current (now defunct) theory. You need to set the start date on the left to the earliest date in 2007 and the end date to the latest in 2012.
I suggest you first watch the surface animation, then go the the 100m data. What you will see in the 100m is hot water upwelling off the coast of Costa Rica (which was not in the zone I originally predicted the upwelling would occur BTW). I have taken a few snaps of the data from Oct 2008 to Feb 2009 at 4 week interval to highlight what I discovered.
On this first image (click to enlarge) we see the very beginnings of the upwelling off the coast of Central America (area highlighted by red rectangle with a small blue dot). As time progresses the upwelling grows, moves west and another upwelling appears. The images are from 10_22_2008, 11_26_2008, 12_24_2008, 1_21_2009 and 2_25_2009.


Now some may ask why didn’t Argos detect the upwelling deeper (1000m)? The answer is in fluid dynamics. The hot spot is very narrow above whatever thermal vents are the source of this warming. The Argo floats are not very dense in this region. So the warm column of water upwelling has to spread out as it rises, making it more likely to be detected by the Argos floats. By the time it hits the surface the warm water really spreads out over top of the cooler layers below.
As this March 2009 surface image shows there are two upwellings in the area, but the one off Costa Rica is missed at the lower depths (again likely due to the density of sensors being so low in this area). And there appears to be a 3rd upwelling off the coast of Peru.

The activity of Nicaragua and Costa Rica is right along the Cocos Plate.

The Peruvian region I highlighted in the previous post and is linked to the Pacific Rise. Higher volcanic activity in these areas clearly cause more warm water to rise and heat the surface, creating the conditions for El Niño. Lower activity allows the cooler currents to dominate, bringing on El Niña.
I feel it is possible there could be some local effect in Nino 1-2, but a problem is the fact that variations in the trade winds always precede ENSO..this has been well documented.
What varies before the trade winds are various processes in the stratosphere, though I’m too strapped for time at the moment to explain myself. But in my view, the culprit clearly seems to be the magnetic sun.
There is an immediate mechanism, and a mechanism lagged 6 yrs involving CMEs. I’m strapped for time at the moment so can’t be detailed, but the immediate effect of a low AP index is more understandable, in modulation of various atmospheric circulation cells, seen after the 2005 AP index drop and systematic response…basically a more favorable regime for La Nina.
As for specific ENSO variation, I am firmly in tbe Landscheidt camp.
Phil –
Trade winds precede ENSO? Which phase? El Niño?
Steve Garcia
A 6-year lag time for some CME mechanism seems a bit of a stretch to nail down for a 2-5 year variable cycle time. They thought for a long time that tree-rings correlating with temps was valid, too. And after 70 years of non-correlation, they still insist it’s real. A CME 6 years ago does something in the eastern Pacific now? Why there? Why only there? I hope you don’t mind my politely being skeptical.
AJStrata says: “First off, that plume is 100 meters down not at the surface. So when you can explain how trade wins caused that to happen I am all ears.”
You’ve misinterpreted what I wrote earlier. I wrote, “You’ll have to discuss how that small plume of water [warm] water would weaken the trade winds in the western Pacific, which is what initiates an El Nino.”
The basic mechanics of ENSO are well understood. And one thing that’s certain, the warm water that’s seen during an El Nino does not come from Central American coastal waters. The warm water comes from the western tropical Pacific. During ENSO-neutral and La Nina periods, the trade winds “pile” warm water in the western tropical Pacific. The surface of the western tropical Pacific is about 0.5 meter higher in the west than it is in the east because of the trade winds. Gravity wants to erase that difference in height. When the trade winds relax in the western tropical Pacific, gravity causes the warm water there to slosh east. The Equatorial Countercurrent (Scroll up to your map.) increases in size and carries that warm water to the east. That’s a very basic description of how an El Nino starts.
You may also want to study confluences in the eastern tropical Pacific to see if you’re mistaking a confluence for a volcanic plume.
feet2thefire says: “Trade winds precede ENSO? Which phase? El Niño?”
And La Niña.
http://i41.tinypic.com/ifcsn7.jpg
Interesting observation which has led to fascinating discussion.
It seems clear that something is adding heat in the east, different from the back-slosh from the west. I was interested in Bill Issis’s comment, back at 3:46 on February 15, where he suggests, “The coastal upwelling is composed of three different upwelling gyres, Tehuantepec, the Costa Rica Dome and the Gulf of Panama. The thermocline is right at the surface in these three upwells and they alternate between warm and cold upwelling.” What I have trouble getting my mind around is the idea of a “warm upwelling.” Would that have to have a very shallow sourse? It gets pretty cold right below the thermocline.
Obviously what is needed is a cluster of Argo floats in the area of this phenomenom. Also some grologists studying the sea bottom there.
What a pity it is that Gore diverted money, away from Bill Gray’s grant applications, to Hansen’s dreary “adjustments” of old and musty data, back in the 1980’s. If Bill Gray had his way, we would have had Argo buoys twenty years earlier, and much more actual data.
Tisdale has done great work, just using the power of observed data. However I think there may be other factors effecting ENSO besides the ones he so wonderfully points out. Observations such as AJ Strata’s give us more to think about.
I ventured some ideas, couched in humor, concerning hydrolic influences, (which I mistakenly called Pneumatic,) in a WUWT post http://wattsupwiththat.com/2011/09/18/a-laymans-paper-pneumatic-effects-on-thermohaline-flow/
It doesn’t matter so much if our ideas are weak, or incorrect, as long as we are free to discuss them. You learn a lot, when you are humble, and don’t pretend “science is settled.”
Bob Tisdale says: February 16, 2012 at 2:28 am
Thanks for that helpful explanation, Bob.
Haven’t read all the replies here today..
Has anyone layered the maps into Google Earth to compare the structure found under the ocean at the locations of these upwellings?
Where’s Pam when you need her. If we take off ice/mass at the north pole of the planet, what is the tectonic response at the equatorial regions. North pole compressional, south pole extensional.
In Google Earth there appears to be a raised region north of the upwelling region. But south closer to S. America connection region its a mess. Could some of that pressure being released north?
Rhys Jaggar says:
February 15, 2012 at 3:03 am
“One thing to think about: Piers Corbyn has been saying (and is now making predictions based on it) that CMEs which hit earth’s atmosphere have effect on earthquakes..”
No he isn`t, he was using his weather event impact dates for EQ timing, but now, directly from my research, he is saying that it is when coronal holes are Earth facing, that means 3-4 days before the coronal hole stream will have reached us.
Maybe we should start looking for smoker patterns. in this region..
Ask me there’s quite a bit of pressure in that corner where central America meets South America. Shows weakness in size first off and in time frequent increases in fractures.
Wasn’t there a backwards quake at the Northern end of central America in Mexico back in hmm in 2008? Pressure and heat release hmmm….
ooops backwards quake was 2007. But check this..”Suddenly, in the latter half of 2006, the plate began moving the other way and quadrupled its speed, scientists announced today.”
In Surprise, Major Earthquake Fault Slips Backward
Robert Roy BrittDate: 02 August 2007 Time: 11:15 AM ET
A vast chunk of Earth sliding under Mexico has surprisingly reversed direction, puzzling geologists and leaving them wondering whether the ground might be poised to pummel Mexico City with a devastating earthquake.
The offshore tectonic plate had been sliding toward Mexico City at a rate of 1 inch per year, as recorded by Global Positioning System measuring stations near Acapulco and Guerrero, which is about 175 miles southwest of Mexico City.
That movement was normal, as predicted by theories of how Earth’s crustal plates should move. At subduction zones, like this one, an oceanic plate typically slides beneath a continental plate, and now and then major temblors occur.
Suddenly, in the latter half of 2006, the plate began moving the other way and quadrupled its speed, scientists announced today…..
http://www.livescience.com/4590-surprise-major-earthquake-fault-slips.html
So why does the warmest flush of surface water appear at the coast of Central America from every Vernal Equinox (with a weaker flush just after the Autumn Equinox) regardless of ENSO phase ?
Doesn’t it seem that 2012’s ‘missing’ Arctic ice is down current from Katla and her merry band of hotheads (aka Iceland)? If underwater vulcanism can change ENSO, wouldn’t it be able to affect Arctic ice and ‘decouple’ arctic ice from temperature (arctic or global)?
Sorry on a roll..
In the recent past as far as glacial iso rebound, permafrost and ice/mass loss Northern plate raising..coupled with Coriolis effect on central plate..causes backwards quakes?
J says:
February 16, 2012 at 6:18 am
~
I dunno, lots of interesting recent devopments though..
Surprise: Explosive volcanic eruption under the Arctic ice found
Posted on June 25, 2008 by Anthony Watts
..“The Vesuvius erupted in 79 AD and buried thriving Pompeii under a layer of ash and pumice. Far away in the Arctic Ocean, at 85° N 85° E, a similarly violent volcanic eruption happened almost undetected in 1999 – in this case, however, under a water layer of 4,000 m thickness.” So far, researchers have assumed that explosive volcanism cannot happen in water depths exceeding 3 kilometres because of high ambient pressure. “These are the first pyroclastic deposits we’ve ever found in such deep water, at oppressive pressures that inhibit the formation of steam, and many people thought this was not possible,” says Robert Reves-Sohn, staff member of the WHOI and lead scientist of the expedition carried out on the Swedish icebreaker Oden in 2007…
http://wattsupwiththat.com/2008/06/25/surprise-explosive-volcanic-eruption-under-the-arctic-ice-found/
Ulric Lyons asks:
So why does the warmest flush of surface water appear at the coast of Central America from every Vernal Equinox (with a weaker flush just after the Autumn Equinox) regardless of ENSO phase ?
The ITC, the convergence zone of the Trade Winds, passes Central America twice each year, very nearly at the equinox, since Central America is very near the Equator.
For anyone still interested, I have an update posted
http://strata-sphere.com/blog/index.php/archives/18096
This is my works:
http://expianetadidio.blogspot.com/2011/12/el-nino-e-un-effetto-del-vulcanismo.html
http://expianetadidio.blogspot.com/2011/12/el-nino-sotto-la-crosta-terrestre-ii.html
http://expianetadidio.blogspot.com/2011/11/el-nino-sotto-la-crosta-terrestre.html
http://expianetadidio.blogspot.com/2011/10/geotermiail-fattore-meno-conosciuto.html
http://expianetadidio.blogspot.com/2011/06/i-segni-di-un-grande-aumento-geotermico_12.html
what do you think?
I mentioned earlier it’s the mountain jet effect which happens during winter.
That great red spot on the charts above looks like this.
http://www.open-ocean.org/?page=16
This may very well be the result of a vortex. This gallery of pics at this website has some very interesting graphs concerning vortexes, and currents in general. Worth a look at them.
Another thing I noticed is the ocean current along the Central American coast is moving south while further out to sea the current is moving north. Depending on their strengths, that could whip up a strong vortex.
@Ulric Lyons 6:06 am:
“So why does the warmest flush of surface water appear at the coast of Central America from every Vernal Equinox (with a weaker flush just after the Autumn Equinox) regardless of ENSO phase ?”
Ulric, I noticed that, too. But it doesn’t seem to have much of the same effect south of the Equator. Odd, isn’t it? And probably instructive.
Though I think this is an important question to ask, late last night I stayed up and really, really got into looking at the animation cells (you can arrow down and up, one at a time.), and I found some things that seems to put it to rest.
1. If you look at the ‘surface’ animation, there are heat plumes doing all sorts of things. And they at times cover the entire -10°S to +10°N tropical Pacific.
2. If you look at the ‘100m’ animation, the boundaries don’t seem to change that much.
3. In the ‘100m’ animation the area where the hot spots arrive never seems to heat up overall due to them. That area overall stays quite cold. They just appear and then race across – still small – and join the large plume in the west and central tropical Pacific.
4. Those hot spots at 100m don’t seem to time well with the ones at the surface.
5. But most of all, if you look at the ‘1000m’ animation, the temps all across the Pacific are nearly completely flat, at about 4C-5C. (It is hard to be sure of the temp readings, because when the image does its small-to-large jump, the colors change and stay changed.) This holds true throughout, and from coast to coast, not counting where the water is too shallow in Indonesia.
Number 5 clinched the argument for me. If there were hot sources below – especially ones that affected very large areas – those should show up all the way up from the bottom.
What I see is that the massive changes on the surface do not come from down below, based on there being no warm areas at all at 1000m and no warming of the eastern areas at 100m, other than those small hot spots.
To me, these clinch it, and this idea – which I had written about myself months ago – seems to be falsified. No matter what kind of heat source might have been considered, there simply is no heat showing up at the deeper levels. Therefore, I conclude that the heat is not coming from below.
@Ulric Lyons 6:06 am:
“So why does the warmest flush of surface water appear at the coast of Central America from every Vernal Equinox (with a weaker flush just after the Autumn Equinox) regardless of ENSO phase ?”
One more thing on this:
The Sun is directly over the Equator on the NH spring equinox, and moves northward right after that. So, it will be directly overhead of this area in that time span each year. It will also be passing it again, going south, just before the NH autumn equinox. Perhaps in the NH summer its affect is delayed for some reason. No good explanation comes to mind on that aspect of it.