I found this post interesting, especially after looking at some of the images that show what appears to be a tight hot spot upwelling off the coast of Costa Rica. But I simply can’t see enough energy in this venting to account for the massive energies dissipating in ENSO events. But, let’s give it a shakedown. I welcome comments from readers on this topic. – Anthony
Argo Data Confirms El Niño/El Niña Caused By Underwater Volcanoes
Guest post by AJ Strata of The Strata-Sphere
Last week I postulated that the El Niño/El Niña effect was not due to solar or atmospheric conditions, but actually caused by underwater volcanic activity along ocean ridges off the West coast of South America. To see whether my theory held water I decided to look into the Argo Float data to see if there it was showing a warm upwelling of water in this region. I apparently was correct.
My initial assessment was that the frigid Humboldt Current that comes north from the Antarctic region along the west coast of South America (the mirror image of the current that drops down from the Arctic along the west coast of North America) could not be warmed so drastically in such a short time by sun and air alone. This is due to the physics of ocean currents and the massive amount of heat required to warm tons of cold water moving northward per second:
Gyres are caused by the Coriolis Effect; planetary vorticity along with horizontal and vertical friction, which determine the circulation patterns from the wind curl (torque).[1] The term gyre can be used to refer to any type of vortex in the air or the sea, even one that is man-made, but it is most commonly used in oceanography to refer to the major ocean systems.
…
The “South Pacific Gyre” is the Earth’s biggest system of rotating ocean currents, bounded by equator to the north, Australia to the west, the Antarctic Circumpolar Current to the south, and South America to the east.
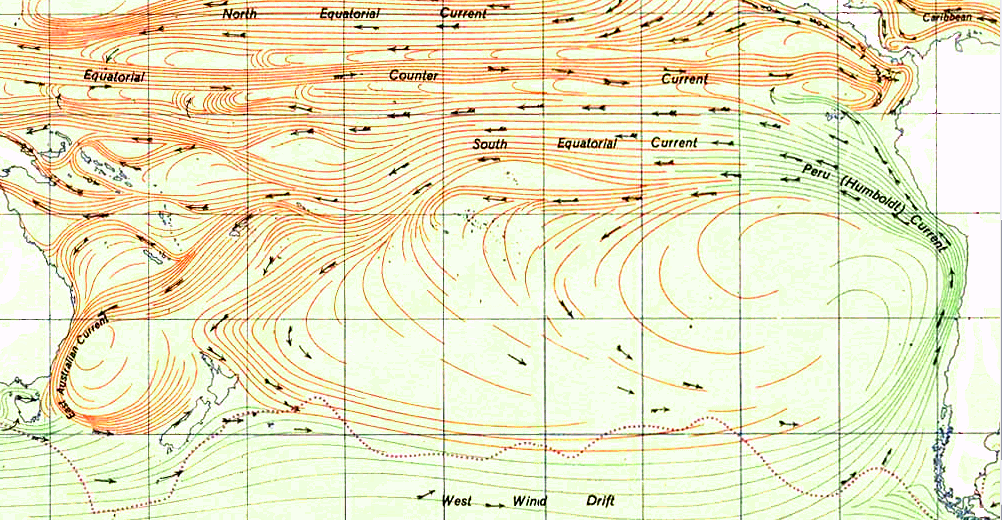
As can be seen in the graph above (click to enlarge), the Humboldt Current is one of the largest on the planet. It is infeasible that El Niño can arise from atmosphere and sun alone by warming this mass of water. Neither air temp or solar radiance change enough to cause this phenomena.
At this site you can watch animation of nearly 5 years of Argo data on the tropical region of the Pacific Ocean. It is fascinating and proves my earlier conclusion that the warm waters of El Niño arise from the eastern pacific and travel west – not the reverse as is the current (now defunct) theory. You need to set the start date on the left to the earliest date in 2007 and the end date to the latest in 2012.
I suggest you first watch the surface animation, then go the the 100m data. What you will see in the 100m is hot water upwelling off the coast of Costa Rica (which was not in the zone I originally predicted the upwelling would occur BTW). I have taken a few snaps of the data from Oct 2008 to Feb 2009 at 4 week interval to highlight what I discovered.
On this first image (click to enlarge) we see the very beginnings of the upwelling off the coast of Central America (area highlighted by red rectangle with a small blue dot). As time progresses the upwelling grows, moves west and another upwelling appears. The images are from 10_22_2008, 11_26_2008, 12_24_2008, 1_21_2009 and 2_25_2009.


Now some may ask why didn’t Argos detect the upwelling deeper (1000m)? The answer is in fluid dynamics. The hot spot is very narrow above whatever thermal vents are the source of this warming. The Argo floats are not very dense in this region. So the warm column of water upwelling has to spread out as it rises, making it more likely to be detected by the Argos floats. By the time it hits the surface the warm water really spreads out over top of the cooler layers below.
As this March 2009 surface image shows there are two upwellings in the area, but the one off Costa Rica is missed at the lower depths (again likely due to the density of sensors being so low in this area). And there appears to be a 3rd upwelling off the coast of Peru.

The activity of Nicaragua and Costa Rica is right along the Cocos Plate.

The Peruvian region I highlighted in the previous post and is linked to the Pacific Rise. Higher volcanic activity in these areas clearly cause more warm water to rise and heat the surface, creating the conditions for El Niño. Lower activity allows the cooler currents to dominate, bringing on El Niña.
You say:
“It is infeasible that El Niño can arise from atmosphere and sun alone by warming this mass of water. Neither air temp or solar radiance change enough to cause this phenomena. ”
And then list no supporting facts…you’re not very good at this whole ‘science’ thing, are you? Maybe more practice would help?
Information from 100m down card
2007 / 05-02
2007-2008 10-31 / 05-21
2008-2009 10-01 / 06-03
2009-2010 10-28 / 06-16
2010-2011 10-13 / 05-05
2011-2012 11-30 /
. Alway from October/ November until May /June.
“But I simply can’t see enough energy in this venting to account for the massive energies dissipating in ENSO events.”
The question you have to ask is how an undersea volcano change the trade winds. I don’t believe it can. Also, the Eastern Pacific has actually been trending cooler. But in any case, the change in surface temperature is quite consistent with the change in trade winds. When the trade winds pick up, surface evaporation increases and the equatorial pacific cools. Same things happen in the Atlantic. When the trades slacken, temperature at the surface increases. And as you mention, there just isn’t enough energy from a volcano to heat up that much water over that much area.
Also, when there is a La Nina condition, the Western Pacific Warm Pool increases in temperature. Does this imply that when one volcano in the Eastern Pacific stops, one in the Western Pacific cranks up and the two are exactly 180 degrees out of phase?
The point is that the temperature anomalies can be explained by wind anomalies. Take a baking pan and put a dish towel in it. Add a couple of cups of water. Shine a heat lamp on it. Take the temperature of the towel after it stabilizes. Now turn on a fan blowing on the towel. Take its temperature again.
This is not to say that there ISN’T significant volcanic activity under the ocean off of the West coast of equatorial South America as there very likely is. Where the Cocos and Nazca plates meet is a spreading center like the mid-Atlantic ridge is, only much shorter. Same with where the Cocos and Nazca meet the Pacific plate. This would have been the original “mid-Pacific ridge” but most of it has now subducted under North America in the Northern Hemisphere and only the Southern Hemisphere portion remains except for a few small bits off the coast of Oregon and Washington.
But I believe it is a bit of of a reach too far to say that any volcanically induced upwelling off the coast of South America is the CAUSE of these cycles. I would say that at times we might see such upwelling corresponding to a cycle, and at other times not. The cycles of the trade wind patterns match cycles of pressure gradient changes in the atmosphere which match changes in regional ocean surface temperature. My guess here is we have a case of mistaking a period of correlation with causation.
John F. Hultquist says:
February 15, 2012 at 9:20 am
——————————————
John, regarding Bermuda I recall a paper describing a drillhole 430 m deep that intersected two separate layers of volcanic rock, one age-dated to 90 Ma and the second to about 34 Ma. That paper suggested Bermuda was formed along the mid-Atlantic ridge when the Atlantic was much narrower. Problem is that the first pulse is explained but the second pulse would have the mid-Atlantic ridge over 1,000 km away. The second theory regards Bermuda as a mantle plume. Both pulses are explained as these hot-spots stay in the same place over a long period of time and originate deep below the crust (so they wouldn’t move by ridge spreading).
Back to the hot spot off Costa Rica … we have a real measurement that seems very discrete and I can’t see how it can be linked to circulating currents without additional heating. Whether it controls climate in any way we don’t really know. But the anomaly is still there waiting to be explained. Could there be a mantle plume forming a new volcanic island off the coast of Costa Rica?
Baa Humbug – Thanks much for the Hat Tip
JimF: yes, off by exactly three orders. I was thinking Calorie on one end of the calc and calorie on the other.
The one flag I will throw preliminarily is that the study attempts to show that gyers, and not solar output, causes el Ninos. Why place the theory in competition like this when the two aren’t mutual contradicting to begin with?
Maybe we need to establish whether the varying magnetic influence on the Earth by the Sun affects volcanism?
Tom Rude, Bob Tilsdale, et al –
First off, that plume is 100 meters down not at the surface. So when you can explain how trade wins caused that to happen I am all ears.
Also, when you run the surface animation – the currents are flowing East-West (as they do at 100 meters down).
Again, the trade wind model cannot explain this as far as I know.
Proper Analysis Required,
I noted the Argo data was sparse and why much of the other up wellings may have been missed.
Folks, this is not a scientific paper! It is a hypothesis with strong supporting evidence. I suspect some enterprising folks will have access to the right data to confirm or reject the idea. All I wanted to was open discussions and see if it made sense. Sounds like it is more than plausible, but not yet proven.
Rizzo,
LOL! Knock yourself out and show me how its done….
In fact, compute how much air/solar energy is required to warm the Humboldt current on the South and its companion in the north. Prove it – know one is holding you back!
When you’re done and you realize the amount of heat required to raise that much water that many degrees (and that deep down) would roast (or boil) most organic life, wel can have the next round.
Sorry, but go back to studying South America waters. The warming that you noticed on the west side of Central America is not from volcanoes.
It’s winter in Central America, and that means that it is mountain jet season. You’re not seeing the warming in deeper water because this heat is roaring between the mountains and down onto the surface of the water.
AJStrata says:
February 15, 2012 at 10:18 am “…It is a hypothesis with strong supporting evidence….”
I beg to differ. It has no supporting evidence – for virtually every element of it. I, as a geologist, like “arm-waving” but that’s when there is really no way to make a sensible calculation. Here, you have lot’s of data on which you can make some reasonable estimates. Instead, you ridicule those who tell you to pick up a pencil and do some googling, and then reiterate your “hypothesis”.
In my 10:50 post, “lot’s” should be “lots”.
If this hypothesis is correct, I would expect it to be correct in the form of a highly nonlinear amplification — the source of nucleating fluctuations that drive a global oceanic current oscillator with a very long period, whose actually primary energy input is probably solar.
The way it might reasonably work is by providing a nontrivial source of heat over “large enough” areas right at the bottom of the ocean. Ordinarily the temperature there is a boring and static 4K within a hair, but there may be enough heat to actually warm the water significantly above this temperature — that’s the kind of thing Argo data will eventually answer. Warmer water will of course experience an enormous buoyant force and create a large semi-permanent upwelling zone that bridges the thermocline and the depths.
Upwelling in one place has to balance downward transport everywhere else, so this sort of thing both facilitates the storage of solar energy in a larger volume of water and its eventual release. It might well act as a modulator in a global transport system that blocks transport of water from the tropics so it becomes anomalously warm, then suddenly gives way and lets a large bolus of it move through relatively quickly to suddenly warm a place that has cooled. This sort of chaotic semi-periodic oscillation is not uncommonly seen — or heard — in differentially heated flowing fluids with some sort of resonances in the convective roll dynamics.
However, that’s all talk. To move beyond the bullshit stage, it might be good to build a very simple toy “ocean” (one with a relatively simple geometry) and solve the Navier-Stokes equations, even approximately, numerically. Heated from the top and with only ordinary transport and no feedback, one might well end up with stable tropic-to-pole lateral convection on top of a nearly stable thermocline (what one in fact sees in most of the ocean, with the shape of the rolls determined by a lot of things and with variations in salinity and density being as important as just raw solar-driven differential heating and thermal expansion in helping to drive the system).
Turning on heating in selected areas on the bottom, one could at least get an idea of the kind of things the ensuing deep vertical transport (if it emerges) can do to the surface patterns. If driving chaotic semiperiodic oscillations with significant amplitudes is one of them, that would be close to a smoking gun.
That leads to fascinating co-hypotheses. Continental drift and tectonic subduction is perhaps at least partly driven by tidal forces and may well have resonances with the lunar cycle, not “monthly” but longer period variations in eccentricity driven by orbital resonances. If heat production in the hot zones is thus modulated, that could be all that is needed to provide the nucleating period that is then nonlinearly amplified in the global convective system.
In the meantime, I have no good feel for the orders of magnitude of the key numbers or the likely size of the effect. The pictures above are very interesting — they more or less prove that they are large enough to have a macroscopic impact on SSTs and affect the distribution of heat for much larger pieces of ocean than just the “hot spots” themselves. This isn’t quite evidence that they can feed back into a driven global resonance and help sustain it.
rgb
I’m also happy enough to bow to crosspatch, who sounds like he has thought about a lot of this more than I have and whose input I generally respect. My previous post was more in the line of a thought experiment — if the hypothesis “geothermal heating at the bottom modulates (some) global oceanic oscillations” how might it happen? and everything…;-)
I think there is general agreement that there isn’t enough heat to have any globally significant direct effect. El Nino is (almost certainly) not simply extra heat produced by the Earth, the energy it releases is solar energy one way or another. However, relatively small perturbations can make big global changes in turbulent convective flow, and small periodic perturbations can easily be phase locked and amplified if the potential for positive feedback in a bands of frequencies that includes the perturbation exists. You can demonstrate this with e.g. microphone-driven audio feedback pretty easily, but the idea is more general.
OTOH, trade winds or the solar cycle itself are just are reasonable sources for frequencies to feed back and amplify, although the former could be as much effect as cause, could they not? I rather like having an external frequency source to phase lock to, because the large decadal oscillations are quite perisistent and at least moderately stable. Since they are clearly so very important in the climate, it would be nice to know that ENSO isn’t going to spontaneously period double or period halve (as it might, if it is purely internal nonlinear feedback driving an essentially chaotic oscillation). An external driver or drivers can stabilize a system just enough that this sort of thing is rare, at least.
But as I said before, this is all really bullshit until someone does a lot more work, with Real Math
rgb
It doesn’t seem like underwater volcanoes can do much in terms warming the surface, but can they cool the surface and/or cause movement of ocean waters?
Could warmed deep water does cause plumes of rising water?
And by time very hot water get to surface it could colder than the surface water, so not warming as much a mixing, affecting various larger ocean streams.
Suppose warmed as body gains vertical velocity, and continues upward despite cooling to existing surrounding water- in this way hot volcanic water could cool ocean surface temperature.
AnonyMoose says:
February 15, 2012 at 10:30 am
It’s winter in Central America, and that means that it is mountain jet season. You’re not seeing the warming in deeper water because this heat is roaring between the mountains and down onto the surface of the water.
So I was right when I said:
Robertvdl says:
February 15, 2012 at 9:43 am
Alway from October/ November until May /June.
But I did not know the reason why. Thanks AnonyMoose .
J Storrs Hall says:
February 15, 2012 at 2:45 am
There might be an error there. Wikipedia puts the eruption of the Krakatoa volcano, one of the largest ever, at a hundredth of your number, 10^17J. But even taking 10^19J, I think you’ve made a mistake. I get a 2.5° warming to 20 feet over only about 50 thousand square km, not 50 million. Here’s my numbers.
1.00E+19 joules availble
4.00E+06 joules/tonne/degree
2.50E+12 tonnes raised by 1°
2.42E+12 cubic metres raised by 1° (sea water is slightly more dense than fresh)
1.21E+11 square meters 20 metres deep raised 1°
120,968 square kilometres 20m deep raised 1°
48,387 sq. km 20m deep raised 2.5°, or 0.01% (a hundredth of one percent of the ocean surface)
Check my numbers, but I think that’s correct. If so, even Krakatoa couldn’t do much … and that was one of the largest volcanoes in history. So I’d have to say the numbers are way, way too small for undersea volcanoes to affect El Niño.
w.
Karl Popper presents a falsification:
So how much energy are we talking about here? The parameters are 100 m deep of water, ? m^2 area and delta T. Fill in the blanks.
So on your back of the envelop calculation how much energy is required?
What is the average energy output of a volcano? How many average volcanoes would it take to equal the estimate? Is the result reasonable?
Before anyone says it’s possible or not possible, an informed estimation is in order otherwise you are not advancing the cause of science. Is it falsifiable? Can it be falsified? Is sunlight the only source of heat energy input to the oceans? If not, can the tidal (gravitational) energy of the sun and moon deforming the earth’s crust partially create the conditions observed via volcanoes? Is tidal energy cyclical? What are the cyclical periods? Do any of these periods show in the observed data?
Of peripheral relevance……….
‘Submarine Geothermics; Hydrothermal Vents and Electricity Generation’
http://www.iingen.unam.mx/es-mx/SitiosWeb/Proyectos/Impulsa4/Publicaciones/Documents/Submarine%20Geothermics%20Hydrothermal%20Vents%20and%20Electricity%20Generation.pdf
My synopsis (with added “rough” estimate):-
Of the 67 000 km of Ocean Ridges that are constantly recharging their thermal activity by the uprising of magma, so far 13 000 km have been studied representing 20% of the global ridges of the world. There have been reported 280 sites of hydrothermal vents along the ridges.
Hydrothermal vents in the ridges can be so extensive that plumes of heated water (60 °C up to as high as 464 °C) are continuous for upward of 100 km along axis.
13 000 km of explored ridges with a ph of 0.3 gives the equivalent of a long active ridge of 3 900 km long. An average width of this equivalent vent as 10 cm and a flow out at a velocity of 1 m/s at 250 °C, one gets a heat flow of 400 TW thermal using as a sink temperature 30 °C.
So a (rough) estimate of heat flow from the oceans hydrothermal vents is that 2,000,000,000,000,000 Joules (2 PJ) of heat is being pumped into the ocean PER SECOND.
Most of the hydrothermal vents are at a depth of 2000 to 2500 meters.
Krakatoa was a large explosion, but we’re discussing the amount of heat delivered, not the amount of rock moved by a steam explosion (in a very short period of time).
Actually, a better place to look for warming is probably over the spreading ridges in the center of the Atlantic. Those are known to be rather active and warm in places (Hello, Iceland!). However, it is arguable whether the spreading ridges are usually volcanoes rather than hot places…but it is probably an easier argument to conduct than finding many volcanoes off the coast of South America.
Personally, I know that molten rock contains a lot of heat, but it also takes a lot of heat to warm water, so I am skeptical of this idea and particularly near South America. Due to the subduction patterns on the west side of South America, I expect most volcanoes would be on land rather than underwater (and there are plenty on land there). I also haven’t had time to fetch the back of an envelope, but I see that others had a ready supply.
This is 46 days early!
Richard C (NZ) says:
February 15, 2012 at 12:49 pm
That’s an interesting paper. However, it’s not internally consistent. They say they have found 280 vents in the ~30% of the ocean surveyed, some as high as 60 megawatts thermal power. If we assume the average is half of that, 30MW, the total output from the 280 vents is 8.4e+9 watts.
Now a watt is one joule per second, so that’s somewhere around 8.4e+9 joules per second for the area studied, which they say is 30% of the total. That gives a total of about 3e+10 joules/sec for the whole planet … whereas you and they are claiming that the whole planet is putting out 4e+14 joules/second, which is about 10,000 times the figure calculated from numbers of vents.
So that would be the first question I’d have, why are their numbers so much greater than a calculation based on vent numbers? Even if we assumed that every single vent put out 60MW the number is still way smaller than their calculation.
Next, they say:
Now, that seems totally bogus. They are taking the amount of flow from the very fastest (“super fast”) vents, and assumed that the entire ocean is made up of that kind of vents. I would not describe that as “quite speculative”, I’d describe that as crazy assumptions.
In addition, the area of the ocean is right about 400 square terameters (358e+12 m^2). That means that by their calculations, the ocean is being heated from the bottom at an average of 1 Wm2 over the entire bottom … and I simply don’t believe that, it’s too big. Since that is only occurring a few places in the ocean the local heating would have been huge, and we would have seen it boiling and bubbling if that were the case.
Check my numbers …
w.
Yes Willis, I know that there’s some WAG assumptions and I can’t speak for Hiriart et al. or Baker and German but i think we can conclude that:-
a) There’s a huge amount of energy (by whatever estimate) flowing in to the ocean at depth and more attention should be given to it as AJStrata has done (with updates as new research progresses, not enough is known).
b) To neglect it as the Climate modellers have done in the O-GCMs is ludicrous.
Maybe a stupid question, but how is it this hotspot is just drifting along at 100 km and is retaining its heat for 2-3 months in rather cold waters?
That is my point – does observation of the ARGO floats validate the presence of these plumes in the areas you expect them to be? And what about the GRACE gravity footprint?