I found this post interesting, especially after looking at some of the images that show what appears to be a tight hot spot upwelling off the coast of Costa Rica. But I simply can’t see enough energy in this venting to account for the massive energies dissipating in ENSO events. But, let’s give it a shakedown. I welcome comments from readers on this topic. – Anthony
Argo Data Confirms El Niño/El Niña Caused By Underwater Volcanoes
Guest post by AJ Strata of The Strata-Sphere
Last week I postulated that the El Niño/El Niña effect was not due to solar or atmospheric conditions, but actually caused by underwater volcanic activity along ocean ridges off the West coast of South America. To see whether my theory held water I decided to look into the Argo Float data to see if there it was showing a warm upwelling of water in this region. I apparently was correct.
My initial assessment was that the frigid Humboldt Current that comes north from the Antarctic region along the west coast of South America (the mirror image of the current that drops down from the Arctic along the west coast of North America) could not be warmed so drastically in such a short time by sun and air alone. This is due to the physics of ocean currents and the massive amount of heat required to warm tons of cold water moving northward per second:
Gyres are caused by the Coriolis Effect; planetary vorticity along with horizontal and vertical friction, which determine the circulation patterns from the wind curl (torque).[1] The term gyre can be used to refer to any type of vortex in the air or the sea, even one that is man-made, but it is most commonly used in oceanography to refer to the major ocean systems.
…
The “South Pacific Gyre” is the Earth’s biggest system of rotating ocean currents, bounded by equator to the north, Australia to the west, the Antarctic Circumpolar Current to the south, and South America to the east.
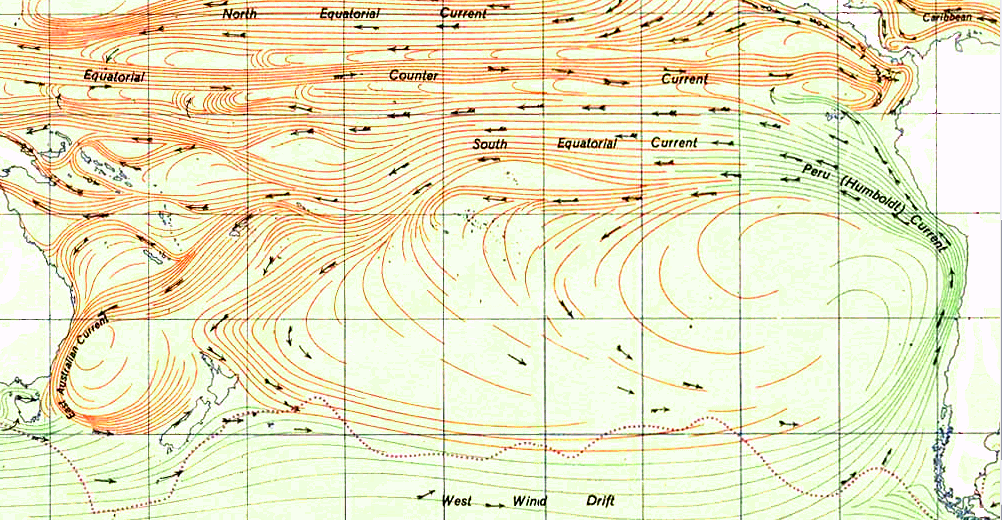
As can be seen in the graph above (click to enlarge), the Humboldt Current is one of the largest on the planet. It is infeasible that El Niño can arise from atmosphere and sun alone by warming this mass of water. Neither air temp or solar radiance change enough to cause this phenomena.
At this site you can watch animation of nearly 5 years of Argo data on the tropical region of the Pacific Ocean. It is fascinating and proves my earlier conclusion that the warm waters of El Niño arise from the eastern pacific and travel west – not the reverse as is the current (now defunct) theory. You need to set the start date on the left to the earliest date in 2007 and the end date to the latest in 2012.
I suggest you first watch the surface animation, then go the the 100m data. What you will see in the 100m is hot water upwelling off the coast of Costa Rica (which was not in the zone I originally predicted the upwelling would occur BTW). I have taken a few snaps of the data from Oct 2008 to Feb 2009 at 4 week interval to highlight what I discovered.
On this first image (click to enlarge) we see the very beginnings of the upwelling off the coast of Central America (area highlighted by red rectangle with a small blue dot). As time progresses the upwelling grows, moves west and another upwelling appears. The images are from 10_22_2008, 11_26_2008, 12_24_2008, 1_21_2009 and 2_25_2009.


Now some may ask why didn’t Argos detect the upwelling deeper (1000m)? The answer is in fluid dynamics. The hot spot is very narrow above whatever thermal vents are the source of this warming. The Argo floats are not very dense in this region. So the warm column of water upwelling has to spread out as it rises, making it more likely to be detected by the Argos floats. By the time it hits the surface the warm water really spreads out over top of the cooler layers below.
As this March 2009 surface image shows there are two upwellings in the area, but the one off Costa Rica is missed at the lower depths (again likely due to the density of sensors being so low in this area). And there appears to be a 3rd upwelling off the coast of Peru.

The activity of Nicaragua and Costa Rica is right along the Cocos Plate.

The Peruvian region I highlighted in the previous post and is linked to the Pacific Rise. Higher volcanic activity in these areas clearly cause more warm water to rise and heat the surface, creating the conditions for El Niño. Lower activity allows the cooler currents to dominate, bringing on El Niña.
The way I look at things, the main value of any hypothesis is the ability to foretell the future. Now, to date, the record of people forecasting what will happen to El Nino/La Nina is not very good. What does this hypothesis forecast for the future development of ENSO? If the forecast turns out to be consistently correct, then the hypothesis may have merit.
If any of this is true then there should be a lot of water out there that is less dense than the water around it. GRACE should see that, and the sea level should show a depression in the plume area. Other knock-on effects – the ARGO floats should reveal uncharted waters – there’s no way an ARGO float is going to remain in the area of plumes – they will be pushed aside, and even in the plume the energy level to maintain depth against rising warm water should show up in the energy budget of the floats. There are more dots to connect before this story can get traction.
Color me skeptical.
This subject is very interesting. Daniel Walker, now retired, published several articles suggesting that El Ninos were highly correlated with increased vulcanism on the sea floor in the East Pacific Rise, in particular near Easter Island, where he had installed instrumentation to measure earthquake activity, a likely proxy for increased volcanism on the sea floor. Here is a link to a 1995 article on the subject, “Hot Vents in the Sea Floor May Drive El Nino”:
http://www.nytimes.com/1995/04/25/science/hot-vents-in-the-sea-floor-may-drive-el-nino.html?pagewanted=all
Walker’s theory has yet to be accepted, but perhaps it will be at some point.
As Bob Tisdale correctly points out, the east Pacific rise near Easter Island, where Walker put his seismographs, is thousands of miles from the coast of Costa Rica. So there is the obvious difficulty of no direct relationship that we can see between warming of very deep waters well south of the equator and warming surface waters off western Central America.
But this might be too simplistic a criticism. Suppose that a large increase in warmth of deep waters rose to the surface in the areas south and east of the Galapagos. This would essentially cut off the rise to the surface of the cold Humboldt current, which in La Nina makes waters around the Galapagos cold. Looking at the animation we can click on, in El Nino years, the Humboldt current cold area is limited to a narrow band of the Chilean and Peruvian coast.
There might be something here, but we need more explanation. If it turns out that El Ninos are driven by vulcanism, is there a cause for the rhythm of volcanism in the East Pacific Rise?
I really do appreciate the work done by people like A J Strata, especially since they do it unpaid on their own time. So thank you A J and Anthony for giving this conjecture air time.
My understanding of the ENSO phenomena is as follows:-
There is continual upwelling of cold water along the coasts of Chile and Peru. These cold waters travel along the deep only to rise up due to the shallow coast line.
The default condition for the equatorial Pacific is one of very warm surface waters due to the strength of solar insolation. El Nino is the default condition if you will.
When the upwelling along the SA coast increases (reasons as yet not fully understood), those cold waters spread out and away from the coast line and begin to affect the atmosphere above, causing the trade winds to strengthen.
These trade winds push the cold surface water westward, with the warm water ahead of it piling up against the coasts of Australia and Papua New Guinea. This ‘warm pool’ can be as much as one metre higher than the ocean further east.
These trade winds also have a strong cooling effect on the surface water.
When the cold upwelling slows down to ‘normal’, trade winds subside and can even reverse. In fact this is what’s happening right now.
http://www.pmel.noaa.gov/tao/jsdisplay/plots/gif/sst_wind_anom_5day_jsd.gif
As the trade winds die down, the previously piled up warm water along the Aus PNG coasts start to slosh back eastward.
Eventually, almost all of the equatorial Pacific surface water returns to a warm phase.
When the PDO is positive, it enhances El Nino conditions as it has done late in the 20thC
When the PDO is negative, it enhances La Nina conditions as it has done with the 2011 and 2012 La Ninas and those in the 60s and 70s.
If and when we understand what causes the upwelling along the SA coast to change and the time line involved, we’ll have a better grip on the ENSO phenomenon.
CO2 has nothing to do with ENSO, and I’m afraid volcanos and underwater vents are in the same boat until and unless more evidence is presented as Bob Tisdale suggests at 5:03am Feb 15th
But, … he didn’t correlate it with volcanic activity yet. I mean, if you’re going to correlate A with B, then it’s not simply a case of showing measurements of A and assuming that it must be correlated with B. You also have to show measurements of B. That’s what correlation is all about, and that’s not even the science part yet: proving that the correlation between A and B is caused by A or B. Apart from saying that there are fault lines in those areas, the blogger hasn’t shown any volcanic activity figures/statistics. And even if (a really big if) there was a correlation between El Nino and volcanic action (which would require cyclical volcanic action!), it’s a long, long road to proving, in a scientific sense, that the correlation is caused by volcanic action.
Megaplumes from the Carnegie Ridge cause El Niños?
In 1988 we published a book on seabed features dealing with fluids leaking up from the sub-seafloor, including so-called hydrothermal vents. By 1988, the first ‘Megaplume’ had been observed in the East Pacific Ocean (see Anderson, 1987), over the Juan de Fuca spreading ridge. A large plume of anomalously warm water was discovered measuring 19 km across and about 1 km in height (above the seafloor).The top of the plume was about 1.3 km below the ocean surface. The enormous excess heat in the plume was estimated to represent about 10 billion kWh of energy. The venting, which terminated after about 10 days, was found to be equivalent to the yearly output from 2000 small (normal) hydrothermal vents. Based on this observation, we speculated that there may be a close link between mantle convection, and/or the subduction of heated ocean crust slabs, and regional ocean surface warming (Hovland and Judd, 1988, p. 258),.
Thus, the main driver for for the El Niño would be hot water contained in the a-seismic Carnegie Ridge, located between Galapagos and mainland Equador. The warm water mass would be released as a 10-fold Megaplume due to a regional earthquake or some tectonic disruption. The erratic nature of the El Niño is also a reason supporting this hypothesis.
References:
– Anderson, I., 1987. ‘Megaplumes’ tips the balance in the oceans. New Scientist, 112, 1540/1541, 24.
– Hovland, M., Judd, A.G., 1988. Seabed pockmarks and seepages: Impact on Geology, Biology and the Marine Environment. Graham and Trotman, London, 295 pp.
For further information on Megaplumes see also:
– http://news.nationalgeographic.com/news/2005/12/1212_051212_megaplume.html
– http://discovermagazine.com/1999/mar/megaplumes
– http://www.sott.net/articles/show/210023-Ocean-Warming-Not-Global-Warming-Hydrothermal-Megaplume-Found-in-Indian-Ocean
And on the Carnegie Ridge:
– http://adsabs.harvard.edu/abs/2005AGUFM.T13D0506D
– http://www.sciencedirect.com/science/article/pii/0012821X72900209
John Marshall,
This does not have to be a volcano in this region to be the source (I think volcanoes off the coast of Peru and the Pacific Rise are the more likely source). I see more of the Yellowstone model, with cyclic ‘boil ups’ through the cracks of the subduction zone.
I agree with John Marshall. There’s no significant submarine volcanic activity off the coast of Costa Rica. The Central American peninsula lies where it is because that is where the subduction melts rise to the surface above the subducting oceanic slab, far east of the subduction trench.
More to the point: El Nino-La Nina temperature patterns are defined in space and time across the equatorial Pacific and they oscillate with observable frequencies. There is no spatial/temporal correlation between submarine volcanism and El Nino-La Nina, and no known decadal periodicities for volcanic activity.
The discussion about volcanic heating of sea water is immaterial to the El Nino-La Nina patterns
Those who speculate that the atmosphere heats the oceans (in any significant way) should try warming the bath water with a hair dryer. Good luck with that.
Perhaps KNOWLEDGE of the atmospheric circulation in Central America would be of help? May I suggest Dr. Emmanuel Barbier PhD thesis and the argo “hot spot” may find a more mundane explanation…
http://tel.archives-ouvertes.fr/docs/00/04/73/65/PDF/tel-00007550.pdf
The dynamic of weather and climate in Central America
The Central American isthmus is characterised by a lowering of the relief which supports the aerological communication between the Atlantic and the Pacific. Because of their power and drain exerted by the relief, the Moving Polar Highs (MPHs) penetrate deeply in the tropical zone. The displacement of the MPHs and their progressive deceleration in direction of the Tropics, the meeting of the continents and their relieves and the effects on the mass flow form Anticyclonics Agglutinations. The MPHs get agglutinated and the Lines of Pulsation become gradually the trade winds and/or monsoon circulation. Tropical flows of the two weather hemispheres meet along the Meteorological Equator. The Central American isthmus constitutes a single climatic crossroads in the world. The study of the disturbances gives the key of dynamic analysis of weather and climate in Central America. Recent climatic evolution shows a modification of the style of general circulation since the Seventies.
mots-clés en anglais : Mobile Polar High (MPH) – Anticyclonic Agglutination (AA) – Pulse Line (PL) – Trade/Panamanian Monsoon – Meteorological Equator (ME) – Vertical Meteorological Equator (VME) – Inclined Meteorological Equator (IME) – Nortes/Northers – Temporales – Cordonazos
OT, but important nevertheless…
[snip see the thread on the main page ~mod]
Strata has shown an obvious change. To Anthony’s question: “Do underwater volcanoes have an effect on ENSO?” the answer must be “Yes” – by the butterfly effect.
The more important question is whether the effect is detectable or how significant it is.
Bob,
Yes, the next step is to stitch theory to hard data. I began to dig into earthquake and volcanic data to see how it maps in. I was going to look at specific Argo float data until I saw this and realized it answered the first question – is there hot upwelling.
Recall the hotspot seen at 100m down is the size of a large county or small state. When it finally bursts to the surface it will spread out.
Now, do I have the time to take this home? No. My first day job is running a small aerospace company. Second one is getting satellites on orbit. 3rd, family. 4th, family …
What I hope is someone takes this home and gets the credit for knitting it all together. I have enough space system, planetary experience to know this is the right answer and will be proven. While circumstantial, it is overwhelming.
Among the major problems with this idea are (1) the volume of water required to heat is huge relative to the amount of possible heat from a volcano (like trying to heat a bathtub with a cigarette lighter), (2) volcanoes erupt sporatically for only a year or two, and are then dormant for long periods, and (3) volcanoes don’t turn on and off with a regular cycle like ENSO (which has been going on for a long time). Volcanic eruptions causes of climate change just don’t work because of this. Look elsewhered for the cause of climate change.
You’re naively using data (or, more properly, a visualization) produced by someone else, this is not a good idea. There’s ~3500 Argo floats in the entire ocean, so there’s a lot of interpolating going on between casts made by those floats (they’re presumably using things like the TOGA TAO array along the equator too). Interpolation routines are prone to artefacts, and sometimes produce little “bullseyes” where there’s no data if the interpolation is too fine. That’s most likely to occur near the coast too, which is where the density of floats is generally lowest (they don’t go up on the continental shelf). If you wish to be credible, you should look at the data yourself – it’s freely available on the web.
Take this with a grain of salt. I was wondering if these underwater volcanoes influence the strength of a La Nina or an El Nino. Was the El Nino of 1998, for example, an ordinary one but which had the enhancement of some strong and well timed underwater volcanoes to make it a super El Nino?
DP,
Willis posted a few days ago on Argo Floats and noted how they do not stay in this region due to upwelling:
http://wattsupwiththat.com/2012/02/06/where-in-the-world-is-argo/
“In other areas, such as off the westernmost point of South America and the area on the western side of South Africa, the cause for the lack of samples seems to be the local upwelling in the areas. Presumably, since the water is radiating outwards at depth as well as at the surface, the floats are moved away from that area.”
It was this comment that led me to Argo data.
And if you follow the floats in the area (3900878-3900791) you see his is correct.
J Storrs Hall says:
February 15, 2012 at 2:45 am “…By a hurried back-of-the-envelope, it’s not totally ridiculous….”
Slow down, and do an unhurried back of the envelope calculation. Your mega-volcanic blast, with all that heat going to raise the temperature of water, is off by at least three orders of magnitude. 10**19 joules volcanic heat; 10**21 ml water; spec. heat water 4; 2.5˚C increase in T.
A very interesting line of research. An excellent Doctorial thesis. Should also look at the biologic activity associated with the ocean floor hot spots/black smokers. There may be enough combined energy in the geologic/biologic systems to modify ocean currents.
I don’t want to sound negative, but before everyone goes off on a tangent, there is one other point to consider,
and that is that we must assume that for the past 3 or 4 decades the volcanic activity has been more or less constant, or why should it have increased? So it cannot be directly pointed to as a source or reason for global warming. In fact I can prove what is causing the global warming that is not global.
I have now statistically analysed the daily results of 22 (surface) weather stations,
randomly chosen, balanced by latitude & 70-30 sea-land
and the results show me that, since 1974,
Maxima have risen by 0.047 degrees C per annum in the SH and by 0.027 degrees C per annum in the NH
Average temps have risen by 0.000 C per annum in the SH and by 0.029 C per annum in the NH
Minima have declined by -0.017 C/yr in the SH and increased by 0.034 C/yr in the NH.
http://www.letterdash.com/HenryP/henrys-pool-table-on-global-warming
So, what happened? Note the results for maxima.
the extra heat from the sun (due to higher intensity sunshine and/or less clouds and/or less ozone/ etc)
is going into the SH oceans and it is taken by weather and wind and currents to the NH.
In the NH, some of it is trapped, as witnessed by increasing minima, partly due to it having a bigger landmass and increasing greenery.
Your premise is that the sun and atmosphere cannot warm the Humbolt current that much and that it requires volcanic activity. However, the Humbold current heads west off the coast of Peru, not Costa Rica or SW Mexico where the Argo data indicates the strongest hot spots. Revise your premise.
Volcanic heat can certainly play a part in warming the ocean, witness the Antarctic peninsula warming from the undersea volcanic activity there. However, both Costa Rica and SW Mexico are north of the equator and El Nino, LaNina is primarily a SH phenomenon.
Bill
I will remain skeptical of this idea. el Nino/la nina are way too periodic. The effects way too broad
AJ Strata “…It is infeasible that El Niño can arise from atmosphere and sun alone by warming this mass of water. Neither air temp or solar radiance change enough to cause this phenomena….”
It would seem that the map you post is a perfect test bed. In the space of an area 10˚ lat x 10˚ long the water goes from green to orange, whatever that signifies in actual temperature. Willis has posted some stuff here showing that area and the water in it could receive 500 to 1500 watts/meter**2 for maybe 10 hours per day – and lose some back to cooling all the rest of the day.
The numbers are in the link here:
http://wattsupwiththat.com/2011/08/14/its-not-about-feedback/
Given some reasonable assumptions you should be able to calculate whether or not that kind of change related to solar heating can occur in that distance. I’ll guarantee you that volcanism has not one thing to do with it. Go take a look at J Storrs Hall’s (February 15, 2012 at 2:45 am) post and do the math there.
I’ll side with John Marshall and Bob Tisdale, and so won’t repeat the things they have written.
It appears to me, though, that folks need a better grasp of Earth with regards to (a) shape & size, (b) volumes & flows, and (c) time. I do not know of single papers that present expositions of the first two of these. They just require lots of reading. On the last of these (time), the essays of Stephen Jay Gould might do, as in his writing on “Deep Time.”
—————————————
Regarding what John Marshall wrote @ur momisugly 6:27: Bermuda is explained in the link below. Its build-stage began about 45 million years ago.
http://www.bermudaislandfacts.com/index_files/Geology.htm
For a time context, the land link between North and South America (Isthmus of Panama) formed about 3 million years ago.
And for context regarding temperature at depths and heat flow:
In northern Idaho’s Silver Valley, at several thousand feet under the surface (been there), rocks are so hot they can’t be touched with your bare hand. 10 feet under the surface layer the ground is cool to the touch. At the surface, in June, one might question how all that hot rock down there passed heat to the surface without warming your deep garden soil !? In late December, the ground surface is frozen and snow covered. Therefore, I think that one has to discount the internal heat as a significant factor for ocean and atmospheric heating. Geologists have examined this issue – search with “geothermal gradient”, and investigate.
May I ask something, following Socrates mayeutics?. And what does it cause such an increase in volcanic eruptions?
Maybee this solar systems gravity push and pull changes(planetar instabilty,)gravital instability, is responsible for both Solar changes and earth teknotinic changes, at the same time?