 Reposted from Jo Nova’s site
Chinese 2485 year tree ring study shows shows sun or ocean controls climate, temps will cool til 2068
A blockbuster Chinese study of Tibetan Tree rings by Lui et al 2011 shows, with detail, that the modern era is a dog-standard normal climate when compared to the last 2500 years. The temperature, the rate of change: it’s all been seen before. Nothing about the current period is “abnormal”, indeed the current warming period in Tibet can be produced through calculation of cycles. Lui et al do a fourier analysis on the underlying cycles and do a brave predictions as well.
In Tibet, it was about the same temperature on at least 4 occasions — back in late Roman times — blame the chariots, then again in the dark ages — blame the collapse of industry; then in the middle ages — blame the vikings; in modern times — blame the rise of industry. Clearly, these climate cycles have nothing to with human civilization. Their team finds natural cycles of many different lengths are at work: 2-3 years, 100 years, 199 years, 800 years, and 1324 year. The cold periods are associated with sunspot cycles. What we are not used to seeing are brave scientists willing to publish exact predictions of future temperatures for 100 years that include rises and falls. Apparently, it will cool til 2068, then warm again, though not to the same warmth as 2006 levels.
On “tree-rings”
Now some will argue that skeptics scoff at tree rings, and we do — sometimes — especially ones based on the wrong kind of tree (like the bristlecone) or ones based on small samples (like Yamal), ones with abberant statistical tricks that produce the same curve regardless of the data, and especially ones that truncate data because it doesn’t agree with thermometers placed near airconditioner outlets and in carparks. Only time will tell if this analysis has nailed it, but, yes, it is worthy of our attention.
Some will also, rightly, point out this is just Tibet, not a global average. True. But the results agree reasonably well with hundreds of other studies from all around the world (from Midieval times, Roman times, the Greenland cores). Why can’t we do good tree-ring analysis like this from many locations?
Jo
Amplitudes, rates, periodicities and causes of temperature variations in the past 2485 years and future trends over the central-eastern Tibetan Plateau [Chinese Sci Bull,]
 Figure 5 Prediction of temperature trends on the central-eastern Tibetan Plateau for the next 120 years. Blue line, initial series; orange line, calibration series, 464 BC–834 AD; purple line, verification series, 835–1980 AD; red line, forecasting series, 1980–2134 AD. (Click to enlarge)
There are beautiful graphs. Have a look at the power spectrum analysis and the cycles below…
ABSTRACT:
Amplitudes, rates, periodicities and causes of temperature variations in the past 2485 years and future trends over the central-eastern Tibetan Plateau
Amplitudes, rates, periodicities, causes and future trends of temperature variations based on tree rings for the past 2485 years on the central-eastern Tibetan Plateau were analyzed. The results showed that extreme climatic events on the Plateau, such as the Medieval Warm Period Little Ice Age and 20th Century Warming appeared synchronously with those in other places worldwide. The largest amplitude and rate of temperature change occurred during the Eastern Jin Event (343–425 AD), and not in the late 20th century. There were significant cycles of 1324 a, 800 a, 199 a, 110 a and 2–3 a in the 2485-year temperature series. The 1324 a, 800 a, 199 a and 110 a cycles are associated with solar activity, which greatly affects the Earth surface temperature. The long-term trends (>1000 a) of temperature were controlled by the millennium-scale cycle, and amplitudes were dominated by multi-century cycles. Moreover, cold intervals corresponded to sunspot minimums. The prediction indicated that the temperature will decrease in the future until to 2068 AD and then increase again.
…
Figure 1 Tree-ring-based temperature reconstruction for the central-eastern Tibetan Plateau during the past 2485 years (gray line), the 40-year moving average (thick black line) and the 40-year running standard deviation (thin black line); the horizontal line is the mean temperature for the 2485 years. (Click to enlarge)
…
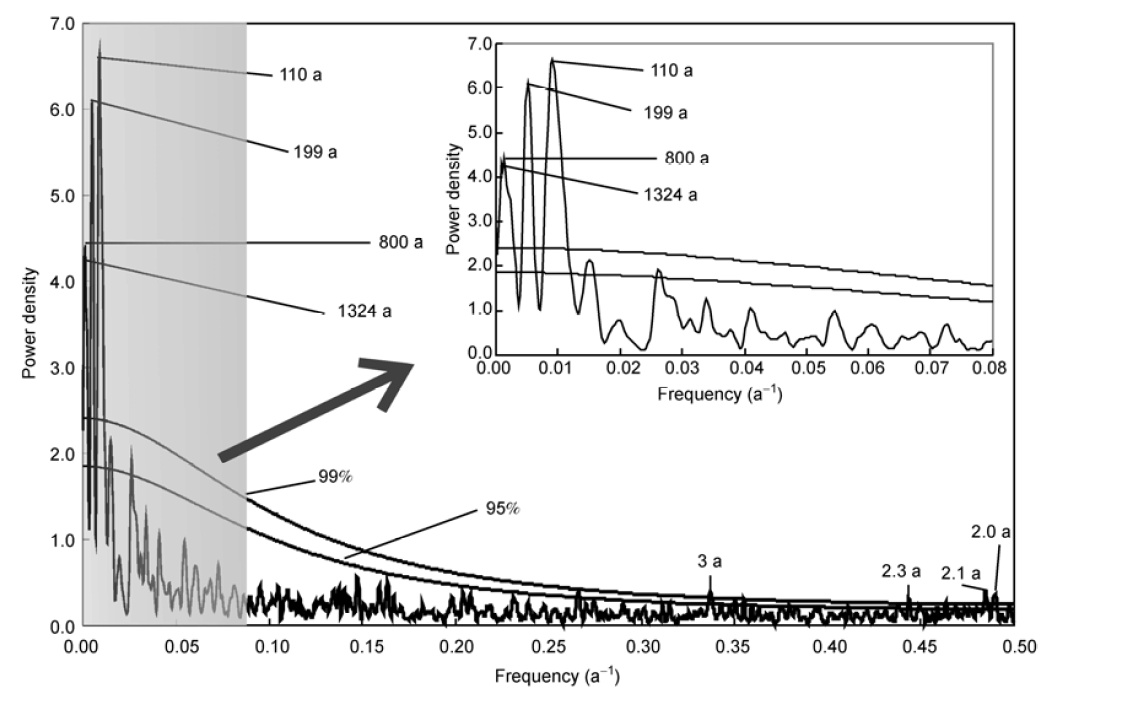 Figure 2 Power spectrum analysis of the 2485-year temperature series. (Click to enlarge)
…
 Figure 3 Millennium-scale cycle in the temperature variation during the last 2485 years. (Click to enlarge)
…
 Figure 4 Decomposition of the main cycles of the 2485-year temperature series on the Tibetan Plateau and periodic function simulation. Top: Gray line,original series; red line, 1324 a cycle; green line, 199 a cycle; blue line, 110 a cycle. Bottom: Three sine functions for different timescales. 1324 a, red dashed line (y = 0.848 sin(0.005 t + 0.23)); 199 a, green line (y = 1.40 sin(0.032 t – 0.369)); 110 a, blue line (y = 1.875 sin(0.057 t + 2.846)); time t is the year from 484 BC to 2000 AD. (Click to enlarge)
…
…
Conclusions
Climate events worldwide, such as the MWP and LIA, were seen in a 2485-year temperature series. The largest Figure 6 Temperature comparison between the forecast and observation data taken from seven stations on the central-eastern Tibetan Plateau (seven stations: Delingha, Dulan, Golmud, Lhasa, Nagqu, Dachaidan and Bange). amplitude and rate of temperature both occurred during the EJE, but not in the late 20th century. The millennium-scale cycle of solar activity determined the long-term temperature variation trends, while century-scale cycles controlled the amplitudes of temperature. Sunspot minimum events were associated with cold periods. The prediction results obtained using caterpillar-SSA showed that the temperature would increase until 2006 AD on the central-eastern Plateau, and then decrease until 2068 AD, and then increase again. The regularity of 600-year temperature increases and 600-year decreases (Figure 3) suggest that the temperature will continue to increase for another 200 years, since it has only been about 400 years since the LIA. However, a decrease in temperature for a short period controlled by century- scale cycles cannot be excluded. Obviously, solar activity has greatly affected temperature on the central-eastern Plateau. However, there are still uncertainties in our understanding of climate change, and the concentration of CO2 affects the climate. Further investigations are thus needed. –
————————–
REFERENCES
Liu Y, Cai Q F, Song H M, et al. Amplitudes, rates, periodicities and causes of temperature variations in the past 2485 years and future trends over the central-eastern Tibetan Plateau. Chinese Sci Bull, 2011, 56: 29862994, doi: 10.1007/s11434-011-4713-7 [ Climate Change over the Past Millennium in China.] … Hat Tip: Geoffrey Gold.
Wow… Just Wow!!
“NotTheAussiePhilM says: December 8, 2011 at 1:50 am
Finally! Tree rings you can believe in!
Do Chinese tree rings track local temps (unlike Russian ones)?”
What a statement – boils down to: I believe that data – is that data valid !!!!!! all in a couple of lines!
Magically treemometers are accurate in China but just garbage when in Russia.
Wow.. Just Wow!
Tree rings are still poor proxies for climate. Too many variables leading to soft conclusions.
I would rather concentrate on the more important subject matter: who is funding the NGO’s and what is their agenda.
“Fourier analysis on time series may be a lot of fun but until physical background of identified cycles is demonstrated it’s not more than just playing with numbers with zero predictive potential.”
To which I would add that the FT of a 2400 timeseries is going to be dominated by modes with period 2400, 1200, 800, 600, 400… very nearly a priori — you’d have to have a rather special curve (one orthogonal to these modes by construction) in order for this NOT to be so. I’d be a lot more impressed if the mode amplitudes were not so obviously artifacts, if an UNUSUAL peak showed up somewhere.
Two other observations. The MISSING peaks are the ones at 11 years and 22 years. Watt’s Up With That? Is Tibet completely immune to the straight up solar cycle, El Nino and La Nina variations in rainfall? Where are there peaks that might be associated with decadal oscillations in general — Arctic, Pacific both might be expected to contribute? The PDO — maybe — has a bump.
A very few of the peaks do seem “close” to named solar cycles, but again the range works against one. Hallstatt (2300 years) is almost the length of the interval decomposed and hence is invisible. Suess might be there, but 210 years is almost an integer factor of 2400 and (I think) suspect as at least partly an artefact. Gleissberg actually does appear to be there, and although 30×80 = 2400, that’s out there far enough that I’m willing to believe that this might well be signal and not artefact/noise. I’m not claiming that these cycles are or should be causal, BTW, only that there is solar physics (known or unknown) behind at least some of these cycles and if one postulates a solar-climate connection it isn’t unreasonable to look for the signals in the climate reconstruction.
In the end, though, I would have to completely agree — if predicting a chaotic timeseries were as easy as FT’ing the past and extrapolating the series into the future, I’d get rich on the stock market in no time at all. FT’s are useful to be sure, but one has to be aware that things peaks at certain modes (especially modes that are related to the interval length) are very likely to be artefacts. So I would have to say that I expect the extrapolative predictive behavior of most of these low lying (long period) peaks to be “low”, and expect most of the rest of the FT to be “noise”.
There is a little-known paper by Demetris Koutsoyiannis called “Nonstationarity vs scaling in hydrology” that should be required reading for people who work in climate research. The beginning of the paper has nothing to do with actual climate research — instead he presents a short vignette on why this sort of analysis is difficult, especially why making egregious claims on the basis of a window onto a timeseries is dangerous. He shows a lovely picture of a simple “cosine variation” law (which can be interpreted as one of the fourier components, hmm, above) with white noise superimposed on it and shows how somebody looking at different windows onto a time series might interpret them. A short window on an upward trend gives you a (completely false) linear trend. A somewhat longer window from a minimum might fit a parabola or exponential (gasp — a runaway result, out of control!). It isn’t until the window is longer than a period that the cosine emerges. Or has it! Perhaps even this cosine is just local noise on a rule with a still longer timescale.
This is why it is so very important to not only have the physics, but have the physics at a level that is predictive across the entire interval being fit in order to make any sort of conclusion. Without the physics, we don’t know the time scales that should be important, that should be modulating the timeseries signal. In the case of climate, we don’t know what the temperature “should” be if we tweak just one of the many knobs that contribute.
This limits the conclusions that can really be drawn from this quite lovely study to the following:
* Presuming a reliable link between tree ring width and temperature, not confounded by “noise” such as e.g. drought and wet cycles, early vs late spring cycles, cycles in the availability of nitrates (connected e.g. to thunderstorm frequency) OR assuming that these are all covariant with temperature in some average way, there is nothing particularly special about today’s temperatures in one part of China.
* Several of the named historical warm and cold periods that are well-documented in at least some parts of Europe and North America were also warm or cold in at least one part of China.
* To the extent that this is true, and to the extent that those named periods are quasi-synchronous with solar variations as represented in various proxies, it adds a bit more inferential support to the hypothesis that solar cycles are a major driver of climate change through physical mechanisms both in the sun and in the sun-earth coupling that remain obscure (partly because they are damned hard science to work out or measure!)
* To the extent that one adds weight to the solar mechanism, one must remove it from competing theories or multivariate theories, as one cannot increase one effect without decreasing others to remain normalized to the observational data. Hence the “CO_2 dominant” hypothesis becomes a bit weaker, or if you prefer, the degree of dominance must be reduced.
* Pure Bayesian reasoning (connected to the first observation above) suggests that the need to panic is significantly reduced by every study such as this one that shows no anomalous 20th century warming independent of all possible causes. To put it another way, if you didn’t know what the figure represented and were asked if there was any reason to think that the 20th century uptick (perhaps in the frequency of influenza deaths worldwide) was reason to believe that a crisis was immanent (human resistance to flu was breaking down), the answer would almost certainly be “no”. This is no hockey stick, indeed.
rgb
Liu Yu,
Director of Earth Environment Institute of the Chinese Academy of Sciences,
Would you be willing to take a student on board and show him a few `tricks` on how to do tree ring research ?,
his name is Mike Mann, he currently lives in America and would probably love to do a bit of travelling right now.
Observer says:
December 8, 2011 at 4:25 am
Liu Yu, Director of Earth Environment Institute of the Chinese Academy of Sciences, was interviewed about his paper by the South China Morning Post (Dec 4, 2011)….
….
….To quote Professor Zhu Kezhen , the father of climate change studies in China: “The big changes in the earth’s climate have been controlled by solar radiation, but the small changes by atmospheric circulation.”
=====================================================================
It will be most “interesting” if the CAGW types at CRU, etc. end up being ‘schooled’ by Chinese scientists….
Observer:
The SCMP interview was very interesting. However, I agree with others who advise caution until methods and validation data is available to verify that these tree rings are measuring temperature as opposed to “growing” conditions.
The Zhou introductory piece, “The characteristics and regularities of the climate change over the past millennium in China’ (p.2985), for the 8 articles in the Chinese Scientific Bulletin makes the following statement:
“The scientific argument on climate change is involved in the theories of the stochastic dynamics of a complicated climate system that are still only in early stages of development. The earth’s atmosphere interacts closely and nonlinearly with oceans, land surfaces, ice and snow, and ecology. Together, they all make up a complicated nonlinear climate system. Under the influence of a changing solar system, the earth’s climate has evolved in a complicated non-stationary process from its formation billions of years ago to its current status. We still know little about the characteristics, regularities, and mechanisms of climate evolution that is driven by external forces varying over time. Although the field of short-range numerical weather forecasts based on physical models is quite mature and serving society efficiently, climate methods prediction on the basis of the same physical models is less reliable and in fact no better than climate predictions based on empirical statistical methods.”
Philip Stott was correct that climate change is governed by hundreds of factors.
Trenberth was right too; it is a travesty that “we can not account for what is happening in the climate system”. But the travesty is not in our lack of knowledge, it’s just a travesty for Trenberth & Co.’s that they can’t simply pin it on CO2.
“What these results show is that there are cycles in the climate between good growth conditions and poor growth conditions for that species of tree in Tibet. “…
…and with some average synchronicity with similar good and poor conditions that affected trees elsewhere in the world, and that are also correlated with some other proxies or historical accounts of temperature.
Don’t forget Bayes. Data like this doesn’t stand alone — it is linked by Bayes to other datasets.
rgb
To several,
It does appear that that Mann’s Hockey stick is in there. It is odd though, that Mann’s stick actually drooped before he spliced it, and this one does not. To my mind it shows that the recent warming is not unprecedented.
As for for the incorrect error range, I think someone deduced the error amount from zero instead of the plotted vale. If that was deduced from the plotted value, it would show a band the same shape as the plotted curve but broader, which is sort of what you’d expect if you did not increase or decrease error value over time. An easy mistake to make with long columns of seemingly random data in a spreadsheet IMO.
The Institute of Earth Environment Chinese Academy of Sciences (IEECAS) was established in Xi’an in 1999, it is based on the Stay Key Laboratory of Loess and Quaternary Geology, CAS, which was founded through the efforts of Prof. Liu Tunghseng, An Zhisheng and others in 1985. http://english.ieexa.cas.cn/
Jono – For information of CAS Earth Environment Institute on management of post-doctorate, such as application procedures, application form and application, etc, please contact Zhang Yingwen at zyw@loess.llqg.ac.cn.
Matt – Liu Yu, male, born in 1963, doctor, research fellow, doctor tutor and Director of Earth Environment Institute, CAS; winner of National Fund for Outstanding Youth and the State Council’s special allowance for experts with outstanding contributions. Mainly in climatologic research of tree ring; published more than 70 Chinese and English papers; his research results of tree-ring stable isotope were appraised as the “Curve most reliable in Asia and favorably comparable with tree ring isotope results from other three major continents in the world” by international authoritative experts in the field; he chaired more than 20 topics, including Class II topic of major topic under National Fund Committee, key topic, outstanding youth fund and Class II topics under 973 Program of the Ministry of Science & Technology, etc. He also keeps close international cooperation with Sweden, US, Germany, Russia and Korea, etc. He chairs the Institute in all aspects, with specific duties on Party affairs, education, supervision and audit.
Actually, thinking about the error bands, my last post is wrong. It is a pretty gross error if that is what happened. The error amount deduced from zero would be a flat line. They just reversed the sign on the +ve error plot, which is ludicrous. And peer-reviewed? By whom, I’d have top ask.
Um, i don’t know, I think I still see a hockey stick at the end there …Just a little bit of a hockey stick….I think so… at the end there… see it?..Its there I’m pretty sure…
This is a very telling email – 3234.txt
From Richard Alley to Ed Cook?
http://www.ecowho.com/foia.php?file=3234.txt&search=divergence
“Unless the “divergence problem” can be confidently ascribed to some cause that
was not active a millennium ago, then the comparison between tree rings from
a millennium ago and instrumental records from the last decades does not seem
to be justified, and the confidence level in the anomalous nature of the recent
warmth is lowered. This is further complicated by the possible small influence
of CO2 fertilization.”
“I was just
looking at some of the recent Mann et al. papers, and at the
Osborn and Briffa paper from this year. In that one, as nearly as I can tell,
there are 14 long records, of which 2 extend to 2000, 8 end in the early to
mid 1990s, 1 in the early to mid 1980s, 2 in the early to mid 1970s, and one
in the late 1940s. That looks to be a pretty small data set by the time you
get into the strongest part of the instrumental warming. If some of the
records, or some other records such as Rosanne’s new ones, show “divergence”,
then I believe it casts doubt on the use of joined tree-ring/instrumental
records, and I don’t believe that I have yet heard why this interpretation is
wrong.”
“But, I think you
have a problem coming, that it involves the IPCC and particularly chapter
6 and paleo generally, that I really should let
Susan know what is going on (if you’ve seen all the increasingly publicly
disseminated emails, you know the story).”
JThoms says:
December 8, 2011 at 4:48 am
Wow… Just Wow!!
“NotTheAussiePhilM says: December 8, 2011 at 1:50 am
Finally! Tree rings you can believe in!
Do Chinese tree rings track local temps (unlike Russian ones)?”
What a statement – boils down to: I believe that data – is that data valid !!!!!! all in a couple of lines!
Magically treemometers are accurate in China but just garbage when in Russia.
Wow.. Just Wow!
====================================================
Can I presume that you have no idea as to what the issue is with Russian temperature collection?
Larry Fields says:
December 8, 2011 at 12:19 am
“The regularity of 600-year temperature increases and 600-year decreases (Figure 3) suggest that the temperature will continue to increase for another 200 years, since it has only been about 400 years since the LIA.”
Is this part: “about 400 years since the Little Ice Age a typo?”
————————————————-
I’m half way through “The Little Ice Age” by Brian Fagan – an excellent, albeit depressing read.
His parameters are as follows:
Little Ice Age begins ca. 1300
Coldest period of Little Ice Age 1670-1710
Little Ice Age ends ca. 1850
So maybe a typo, or maybe a very rough approximation from the deepest depths of the cold.
One more thing – has anyone applied Mannian statistics to this data set ?? Would love to see the result.
Thanks Observer, that interview was gold. The original post is interesting too of course.
I still think I’d take tree-rings over ice-cores as proxies, sure they are proxies, but if we had actual temperature measurements for the last 2000 years I reckon someone should be publishing them…
As for being just curve-fitting (and it does look pretty good curve fitting). 1. It raises real questions about the effect of CO2 as a ‘driver’ of tibetan climate because the current warming over the time series is not unprecedented whereas the current CO2 apparently is. 2. If the curve fitting identifies cycles and a plausible physical mechanism exists for those cycles, you then have a predictive, and hence falsifiable hypothesis.
As for lack of known short cycles, they’d be hard to pick up in a slow-growing, long-lived tree is my guess (you can have short, hi-res, or long low-res).
Matt says:
December 7, 2011 at 11:48 pm
“Does Bull stand for bulletin or bullshit? – I mean, where’s the magic word? Is it peer reviewed, is this a respected publication outside China? You were furious about Muller, obviously, because you didn’t like the conclusion. And now? Obviously, this time you like the conclusion – but what about peer review”
I do not think Lin Yu considers Mann, Jones, and the whole team peers. Did not one of the team members do a China study, but they lost the records<or their dog ate them or something.
Observer says:
December 8, 2011 at 4:25 am
Liu Yu, Director of Earth Environment Institute of the Chinese Academy of Sciences, was interviewed about his paper by the South China Morning Post (Dec 4, 2011):
IF this is a real interview, then this analysis was also based on a single tree:
“…We recently found one that is close to 2,000 years old, but less than 8 metres tall…”
Skeptics have severely criticized other tree-ring analyses based on small sample size (among other things), so if my interpretation is correct, should have a large dose of skepticism for this paper.
Of course, if there are WUWT followers who have complete access to the paper and can tell us how many trees were used, I am happy to be corrected.
bill says:
December 8, 2011 at 12:05 am
I see a comment like this and I immediately KNOW the Chinese are onto something important. Thanks, bill.
I’m pleased to see others using a wave analysis technique on proxie data similar to what I have been doing. Even more so in that their results are also similar. Take a look at my plot of SST anomalies based on ice core data. http://www.kidswincom.net/climate.pdf.
Before claims like this can be made, I think these dendro-thermometers need to be calibrated, perhaps with individual instrumentation at each tree to show how they are affected by local environmental temperatures at various sites over a multi-year period. Perhaps this should be coupled with a study of how the other parameters affecting tree growth tend to correlate with temperature.
I personally think isotopic analysis of the wood in each ring, particularly the O16 to O18 ratio would yield more reliable global temperature information.
@ur momisugly Peter Plail “whatever else tree rings show, they are a good proxy for human well-being.”
Good point! Very good point.
@ur momisugly crosspatch and eyesonu “That they were well aware of the 60 year cycle and pushed so hard for regulations and now that time has run out would fully explain the last ditch effort we are seeing now. ”
Yeah, that has been my suspicion as well. The push for CAGW has been so well coordinated, so well funded, so well supported by the media, and such a good investment for those who desire more money and power — at some point collusion and planning becomes the simplest and most reasonable explanation.
The mathematician in me finds the power spectrum curve most informative. Those peaks in Figure 2 which can be declared to represent real cycles with 99% or greater certainty, the 2.0, 2.1, 2.3, 3 years, 100 years, 199 years, 800 years, and 1324 years help account for a LOT. The *causes* of these cycles may be debated until the next Ice Age, but the*data* indicates they are present and Mmust be included in any discussion of climate. The 100 and 199 year cycles I have personally observed in a power spectrum of the sunspot numbers, but my confidence was low because the sparseness of the data did not permit assigning a 99% confidence limit to their presence.
Interestingly the 11+ year sunspot ‘cycle’ itself is not present, suggesting that the 100 & 199 year cycles may drive both climate and sunspots, but that the sunspots themselves do not drive climate per se. The physical mechanism of the 11+ year sunspot cycle appears confined in its direct effects to the sun, and does not significantly affect the earth’s climate directly.
I cannot support the conclusions until I see the original data, the methodology used, the assumptions made and can replicate the results.
I am old enough to realise that I can be fooled easily, especially by results which appear to confirm substantially my own beliefs.
http://www.worldwildlife.org/wildworld/images/profiles/terrestrial/pa/lg/pa1002a_lg.jpg
What trees ?, there are no trees. They were all cut down for fuel and can’t grow back for lack of Co2. We burn yak dung instead now but still can’t get the Co2 high enough to regrow them. We need more coal fired power plants. Then we can plant new trees and not cut them down.