There’s a saying, “timing is everything”. After reading this, I think it is more true than ever. In other news. Paul Vaughn is giving Bob Tisdale serious competition in the contest over who can fit the most graphs into a single blog post. ☺ There is a helpful glossary of symbols and abbreviation at the end of this post that readers would benefit from reading before the essay. A PDF version is also available via link at the end of the article. – Anthony
Guest post by Paul L. Vaughan, M.Sc.
Lack of widespread awareness of the spatiotemporal nature of interannual terrestrial oscillations is perhaps the most paralyzing bottleneck in the climate discussion.
North Pacific Pivot
Elegant factor analyses by Trenberth, Stepaniak, & Smith (2005) concisely chart the limits of linear climate exploration, providing strong clues that the North Pacific is a globally pivotal intersection.

D – T = -SOI (an index of El Nino / La Nina – details below in “Data & Symbols” section)
WUWT readers are well-acquainted with Tsonis, Swanson, & Kravtsov (2007). Recently Wyatt, Kravtsov, & Tsonis (2011b) shared the following on Dr. Pielke Senior’s blog:
“PNA participates in all synchronizations.”
Orientation for ENSO- & PDO-centric readers:

Complex Correlation
Simple linear correlation can do a part-way decent job of summarizing the preceding intrabasin relations, but properties of interbasin & interhemispheric multiscale spatiotemporal relations clarify the need for complex summaries. For example:

Limitations of linear methods are emphasized by Maraun & Kurths (2005). A mainstream audience might not appreciate their beautifully concise section 3 primer, but there’s a simple way to look at interannual spatiotemporal phasing.

The ~2.37 year signal which is so prominent in the equatorial stratosphere is also easily detected in the troposphere, but there’s clearly “something else” contributing to interannual tropospheric variation.

Note that when iNPI’ doesn’t “go with” iAAM & iLOD, it “goes against” them, much like a switch that is either “off” or “on”. Specialists like Maraun & Kurths might speak of coherence and illustrate the nonrandom distribution of phase differences.
Multiscale complex correlation (for example using adjacent derivative based complex empirical wavelet embeddings) can measure complex nonstationary relations where simple linear correlation fails catastrophically. Naive investigators unknowingly encounter Simpson’s Paradox by falsely assuming independence and blindly running linear factor analyses (such as PCA, EOF, & SSA) without performing the right diagnostics.
Northern Hemisphere Inter-Basin Interannual Coherence
Nonrandom phase relations explored by Schwing, Jiang, & Mendelssohn (2003):


Interannual Solar-Terrestrial Phase-Relations
Terrestrial phase relations with interannual [not to be confused with decadal] rates of change of solar variables, including solar wind speed (iV’), are nonrandom:


Inter-Hemispheric Interannual Phase-Relations
For those wondering how AAO & SAM fit in:


Global Synchronicity
Synchronicity’s the norm. Orientation, configuration, amplitude, & extent of globally constrained & coupled jets & gyres are pressured while network monitoring remains stationary. Regional temporal phase summaries are intermittently flipped by the stationary spatial geometry of monitoring networks in the turbulent global context.

Note particularly (in the last 2 graphs) the strong & stable interannual synchronicity of northern annular, southern annular, & global modes for the decade beginning ~1988. The commencement of the pattern coincides with concurrent abrupt changes in Arctic ice flow (e.g. Rigor & Wallace (2004) Figure 3) and European temperature (e.g. Courtillot (2010)).
Local Connection
Here’s how NPI relates to minimum temperatures at my local weather station:


Concluding Speculation
Terrestrial geostrophic balance is affected by the concert of changes in:
a) interannual (not to be confused with decadal) solar variations.
b) decadal amplitude of semi-annual Earth rotation variations – [see Vaughan (2011) & links therein].
c) solar cycle length – [see links in Vaughan (2011)].
Nipping Potential Misunderstandings in the Bud
“So you’re claiming the North Pacific controls global climate?”
No.
Why do I hear the same places mentioned every rush hour on the traffic report? Bottlenecks are easy places to detect changes in pressure & flow (whether global &/or locally intersecting), even using the simplest methods. Methods such as those suggested by Schwing, Jiang, & Mendelssohn (2003); Maraun & Kurths (2005); and Tsonis, Swanson, & Kravtsov (2007) help expand our vision towards the rest of the network. We have a lot of work to do (both exploratory & methodological).
Further Reading
Everything written by Tomas Milanovic at Dr. Judith Curry’s blog Climate Etc.
Vaughan, P.L. (2011). Solar, terrestrial, & lunisolar components of rate of change of length of day.
Referenced Above
Courtillot, V. (Dec. 2010). YouTube Video (~30min): Berlin Conference Presentation.
http://www.youtube.com/watch?v=IG_7zK8ODGA
Maraun, D.; & Kurths, J. (2005). Epochs of phase coherence between El Nino-Southern Oscillation and Indian monsoon. Geophysical Research Letters 32, L15709. doi10.1029-2005GL023225.
http://www.cru.uea.ac.uk/~douglas/papers/maraun05a.pdf
Rigor, I.; & Wallace, J.M. (2004). Variations in the age of Arctic sea-ice and summer sea-ice extent. Geophysical Research Letters 31. doi: 10.1029/2004GL019492.
http://iabp.apl.washington.edu/research_seaiceageextent.html
Schwing, F.B.; Jiang, J.; & Mendelssohn, R. (2003). Coherency of multi-scale abrupt changes between the NAO, NPI, and PDO. Geophysical Research Letters 30(7), 1406. doi:10.1029/2002GL016535.
Trenberth, K.E.; Stepaniak, D.P.; & Smith, L. (2005). Interannual variability of patterns of atmospheric mass distribution. Journal of Climate 18, 2812-2825.
http://www.cgd.ucar.edu/cas/Trenberth/trenberth.papers/massEteleconnJC.pdf
Tsonis, A.A.; Swanson, K.; & Kravtsov, S. (2007). A new dynamical mechanism for major climate shifts. Geophysical Research Letters 34, L13705.
http://www.nosams.whoi.edu/PDFs/papers/tsonis-grl_newtheoryforclimateshifts.pdf
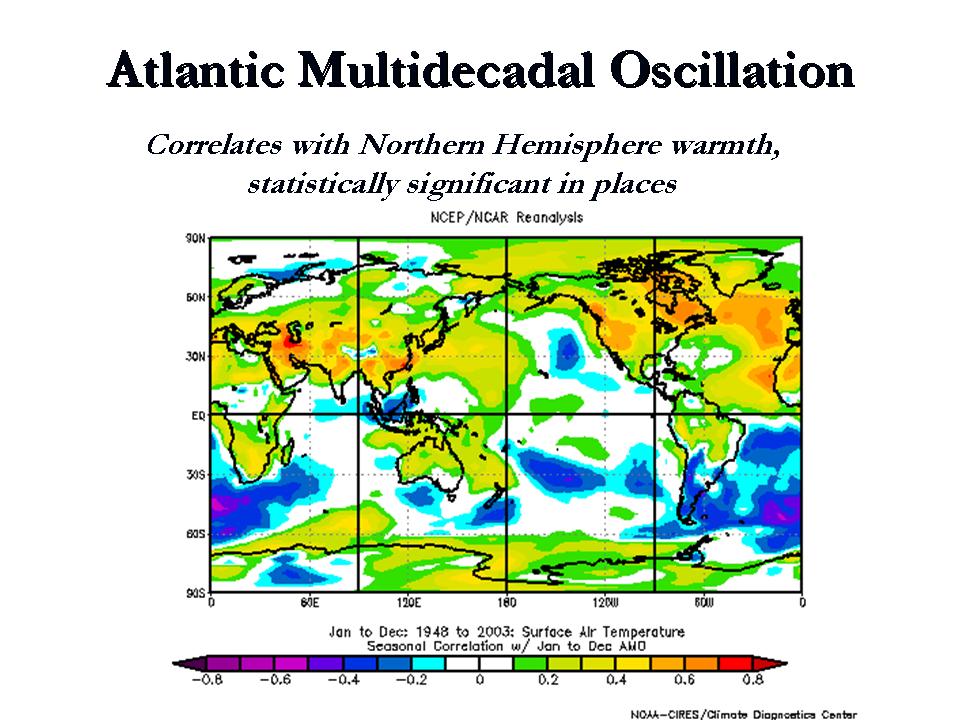
Wyatt, M.G.; Kravtsov, S.; & Tsonis, A.A. (2011). Atlantic Multidecadal Oscillation and Northern Hemisphere’s climate variability. Climate Dynamics. doi: 10.1007/s00382-011-1071-8.
Since (to my knowledge) there’s not yet a free version, see the conference poster and the guest post at Dr. R.A. Pielke Senior’s blog for the general idea:
a) Wyatt, M.G.; Kravtsov, S.; & Tsonis, A.A. (2011a). Poster: Atlantic Multidecadal Oscillation and Northern Hemisphere’s climate variability.
https://pantherfile.uwm.edu/kravtsov/www/downloads/WKT_poster.pdf
b) Wyatt, M.G.; Kravtsov, S.; & Tsonis, A.A. (2011b). Blog: Atlantic Multidecadal Oscillation and Northern Hemisphere’s climate variability.
Important Note: While Wyatt, Kravtsov, & Tsonis (2011) are likely to stimulate a lot more discussion once a free version of their paper becomes available, it needs to be pointed out assertively & clearly that the cross-correlation approach, while informative, is patently insufficient for determining the full nature of terrestrial spatiotemporal phase relations.
Appendices
In the appendices that follow, attention is concisely drawn to key items that are consistently underappreciated in climate discussions.
Appendix A: Spatial Influence on Phase – Important
Nonrandom phase relations demand careful focus on the spatial dimension. Temporal evolution isn’t the only thing driving apparent phase.
If features grow, shrink, rotate, change shape, reflect, or move relative to the stationary windows in which they are measured, phase is affected.


The effect on summaries is plain & simple. (Anyone previously puzzled by “integration across spatiotemporal harmonics” might now get the general idea.)
Appendix B: Reversals in Temperature-Precipitation Relations
Blink between winter & summer panels of Figure 6:
Trenberth, K.E. (2011). Changes in precipitation with climate change. Climate Research 47, 123-138. doi: 10.3354/cr00953.
http://www.int-res.com/articles/cr_oa/c047p123.pdf
Temperature-precipitation relations are a function of absolutes, not anomalies. This is fundamentally important.
Insight from my local (ABC) example:


Appendix C: Global Distribution of Continental-Maritime Contrast
High-amplitude regional variance leverages global summaries, but multidecadal variations often draw misguidedly narrowed focus to the North Atlantic Ocean when it is the global distribution of continental-maritime contrast (in relation to flow patterns) that should be attracting the attention. Noting the position of the relatively small North Atlantic in this broader context, carefully compare:
1. http://icecap.us/images/uploads/AMOTEMPS.jpg
2. Figure 10 here:
Carvalho, L.M.V.; Tsonis, A.A.; Jones, C.; Rocha, H.R.; & Polito, P.S. (2007). Anti-persistence in the global temperature anomaly field. Nonlinear Processes in Geophysics 14, 723-733.
http://www.icess.ucsb.edu/gem/papers/npg-14-723-2007.pdf
Data & Symbols
‘ indicates rate of change
[ ] indicates time-integration
AAM = Atmospheric Angular Momentum
AAO = AntArctic Oscillation
ABC = Agassiz, British Columbia (west coast of Canada near USA border)
AO = Arctic Oscillation
COWL = Cold Ocean, Warm Land index
D-T = -SOI = – Southern Oscillation Index = pressure difference between Darwin & Tahiti (an indicator of El Nino / La Nina cycling)
ENSO = El Nino / Southern Oscillation
i = interannual
LOD = Length Of Day
NAO = North Atlantic Oscillation
NPI = North Pacific Index
PDO = Pacific Decadal Oscillation
PNA = Pacific North America index
PPT = PreciPiTation
QBO = QuasiBiennial Oscillation
SAM = Southern Annular Mode
SOI = Southern Oscillation Index
T = Temperature (°C)
V = solar wind speed
x = extreme
Data links available upon request.
Acknowledgements
Sincere thanks to Anthony Watts, the WUWT Moderation Team, readers, and all those who make valuable contributions towards a deeper understanding of nature.
==========================================================
PDF Version of this essay available here Vaughan, P.L. (2011). Interannual Terrestrial Oscillations (375KB)
Paul Vaughan says:
May 22, 2011 at 12:59 pm
Nonsense. You’re now suggesting physicists calculate neither p-values nor confidence intervals?
You didn’t show where “I demanded statistical inference”…
And of course, we calculate significance values, but we don’t believe the prove anything. As I said they might be indicative, that’s all.
Paul Vaughan wrote (May 17, 2011 at 7:30 am)
“The annual & semi-annual signals (phase-locked to the terrestrial year) are on my radar […]
Leif, twice you accused me of not saying this. Now more of this ‘he said, she said’ stuff (on stat inference). There’s no value in being ‘tied up at committee’ on such impractical frivolities.
Paul Vaughan says:
May 22, 2011 at 12:06 pm
Now [sic] more of this ‘he said, she said’ stuff (on stat inference).
What happened to: “I have objectively noted the inconsistency.”
Show where.
“The annual & semi-annual signals (phase-locked to the terrestrial year) are on my radar […] Leif, twice you accused me of not saying this.
No, I have asked you how if the solar wind having a component phase-locked to the terrestrial year [but otherwise random] would create a spurious correlation. No answer, of course.
Leif, I haven’t volunteered to participate in an administrative dispute. That would require $70G per year.
Paul Vaughan says:
May 22, 2011 at 5:49 pm
Leif, I haven’t volunteered to participate in an administrative dispute.
True to form, you chicken out. You do seem to have volunteered to ad-hom attacks. I guess some people are like that and do it for free.
When someone instead of stating an objection once, twice, or 3 times repeatedly harasses, certainly there does become an objection to the person (you in this case).
http://wattsupwiththat.com/2011/05/22/arctic-cycles-amopdo-corresponds-to-arctic-station-group/#comment-666101
Paul Vaughan says:
May 22, 2011 at 9:41 pm
When someone instead of stating an objection once, twice, or 3 times repeatedly harasses
And trying to get answers to legitimate questions has now become harassment…
A way of dealing with that is to be responsive rather than abusive (you in this case).
Asking once, twice, or 3 times is acceptable, but please respect that volunteers set the terms on which they choose to respond or not respond.
http://wattsupwiththat.com/2011/05/22/arctic-cycles-amopdo-corresponds-to-arctic-station-group/#comment-666101
Paul Vaughan says:
May 23, 2011 at 7:39 am
Asking once, twice, or 3 times is acceptable, but please respect that volunteers set the terms on which they choose to respond or not respond.
The honorable thing to do would be to acknowledge the request and then perhaps respond with one of
1) I retract what I said
2) I cannot give a meaningful response
3) I don’t give a rat’s ass
The sensible thing to do is agree to disagree efficiently.
http://wattsupwiththat.com/2011/05/22/arctic-cycles-amopdo-corresponds-to-arctic-station-group/#comment-666101
Paul Vaughan says:
May 23, 2011 at 9:36 am
The sensible thing to do is agree to disagree efficiently.
We are not talking about disagreements, but about clarifications. Not wanting to clarify is not sensible, nor honorable.
ferd berple says:
May 21, 2011 at 5:21 pm
the value of science is not in “understanding”, it is in our ability to predict accurately, no matter how this is accomplished. If history is a guide, 500 years from now everything we think we “understand” about the physical world will have long since been dumped into the rubbish bin.
Far be it from me to get into an argument with someone who can’t spell check his own name, but I profoundly disagree with your characterisation of what the value of science is.
While it’s true that our current theory will be replaced in due course, this does not mean that working on and thinking about the concepts which underpin our current conceptualisation of the universe is a waste of time and effort. It has not only got us to the point where we can predict a great many things, which is a useful ability, though not an end in itself; it has also led us towards a deeper understanding and appreciation of the cosmos, and our own minds and being.
Paul Vaughan’s self set vocational task is to find possible connections between disparate phenomena. This is an activity which precedes theorisation and the discovery and quantification of mechanism, which he humbly leaves to others more practised in those arts. We should commend him for ‘making no claims’ and thank him for the interesting discoveries he has shared.
Thanks tallbloke.
=
What the mainstream appears to have overlooked is very simple:
Solar max interrupts the semi-annual heat pump. The frequency of pump outages controls multidecadal oscillations (via hydrology). Interannual spatiotemporal chaos makes this difficult or impossible to see using linear methods.
=
[ For those needing background info:
1. http://wattsupwiththat.com/2011/04/10/solar-terrestrial-lunisolar-components-of-rate-of-change-of-length-of-day/
2. http://wattsupwiththat.com/2010/12/23/confirmation-of-solar-forcing-of-the-semi-annual-variation-of-length-of-day/ ]
Paul Vaughan says:
May 23, 2011 at 1:28 pm
Solar max interrupts the semi-annual heat pump.
There is no evidence for that. How would that happen?
http://wattsupwiththat.files.wordpress.com/2011/04/vaughn_lod2_fig7.png
http://wattsupwiththat.files.wordpress.com/2010/12/vaughn_lod_fig1a.png
http://wattsupwiththat.files.wordpress.com/2010/12/vaughn_lod_fig1b.png