Hot summer after a cold winter
Joe D’Aleo, ICECAP
Washington DC and many cities of the east and south had a warm to record warm summer (while parts of the west had a cold to record cold) with the average for the nation the 4th warmest on record. For Washington, it broke many of the records set in 1980 and 1988. It tied with the number of 90F days set in 1988 and fell just 12 days short of the number of 90F days for the year (a few additional still possible) set in 1980.
A hot summer is very typical when a strong La Nina follows a strong El Nino winter (1999, 1988, 1966) or when record strong arctic blocking in winter fades (1977). This past winter we saw a record for negative Arctic Oscillation (AO) beating out 1976/77 and 1965/66

The summer was 2.2F above normal for the nation, ranking it as fourth warmest. See map:

That matches how much last winter the US averaged below normal (2.2F). Last winter was coldest in the south and southeast (in a few spots, coldest ever). Colder to the south of DC but recall DC and surroundings had a record seasonal snowfall.

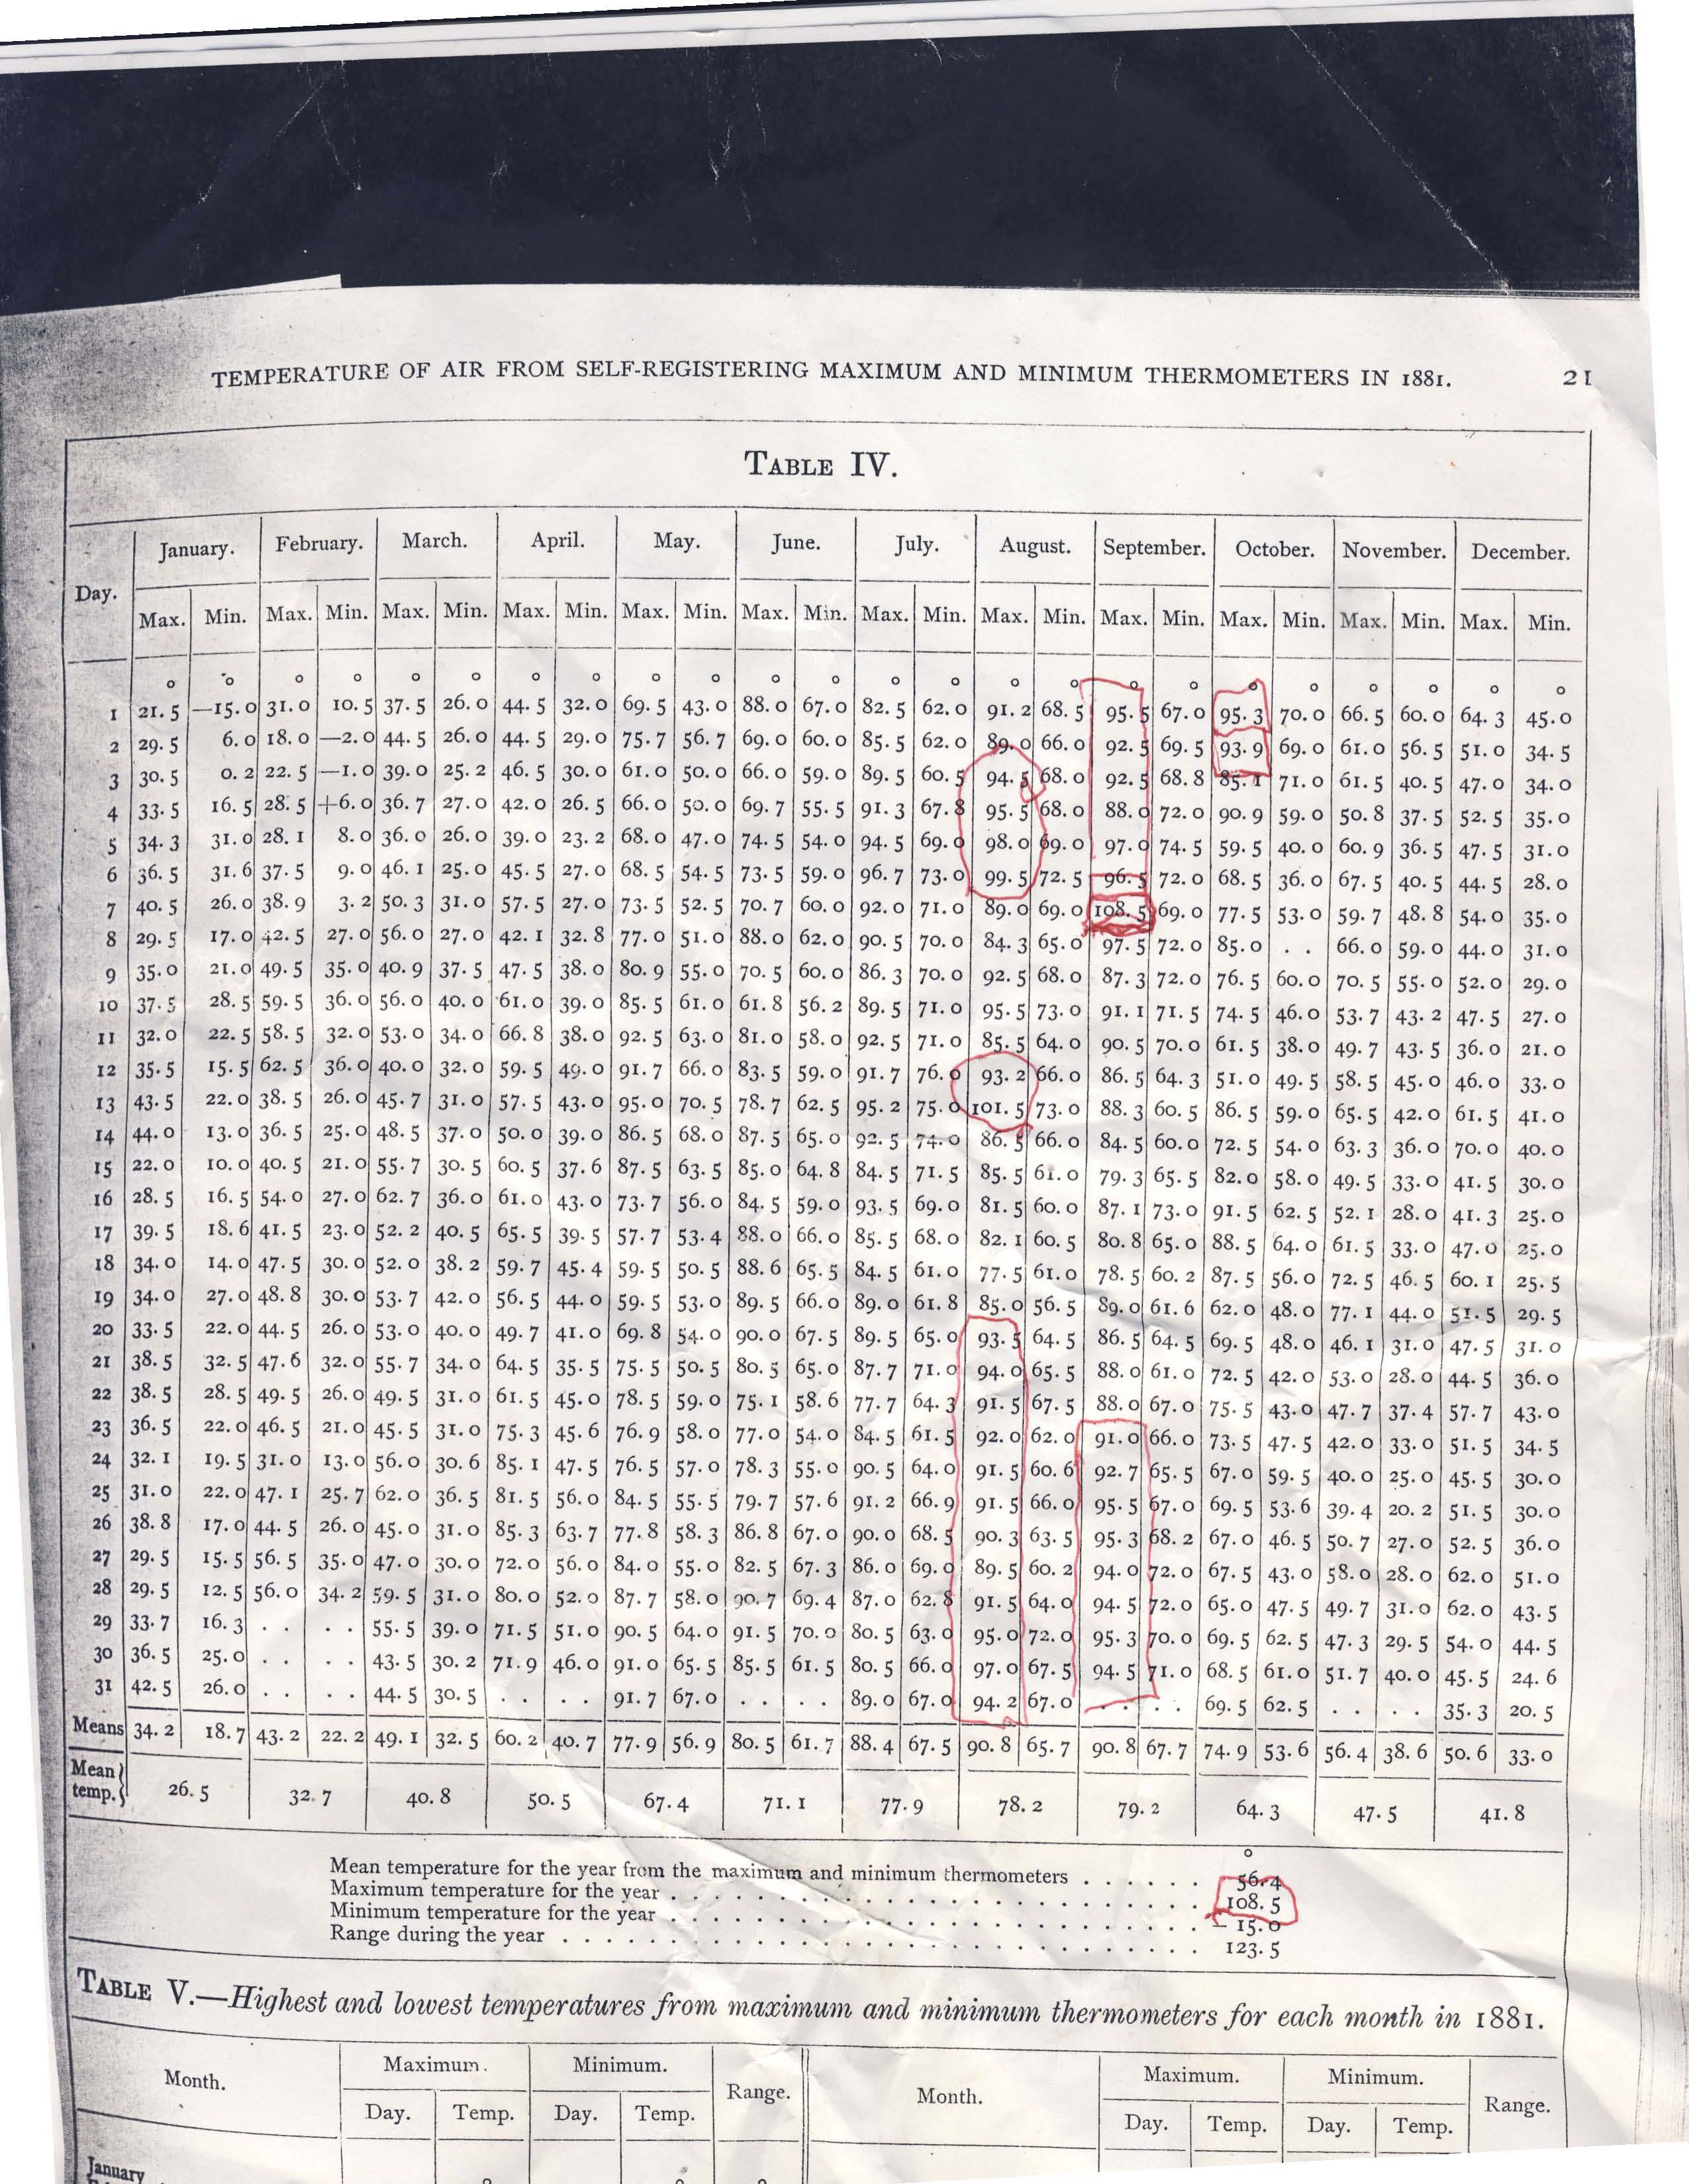
Besides 1980, 1988, other hot summers included 1881, where this record from “Andy” out of the Naval Observatory shows an amazing summer following a very cold January/winter. He writes:
I am attaching a rather rare document, Washington DC weather records for the year 1881 taken at the Naval Observatory.
I have highlighted an incredible late summer, early autumn heat wave that got started on August 20th and did not really end until October 4th. There has never been anything remotely approaching the intensity and duration of this heat wave for so late in the year in modern times.
An unbelievable temperature of 108.5 was recorded on the very late date of September 7th! Also the average September average high temperature of 90.8 dwarfs anything you can find in recent years. One could argue that the site or thermometer might reflect a warm bias. Examining the data, June was actually quite cool and July was about average. And back then, no one was pushing an agenda!
The summer this year was characterized by hot days with high humidities and thus very warm nights. Nighttime lows were especially above the normal. Ironically many of the same areas with warmth this summer had very cool summers the last two years with a record/near record cold July in 2009.

That was consistent with a summer after a La Nina winter, one with low solar and high latitude volcanic activity. Last summer and last winter we were told that was weather not climate. This makes any claims that a hot summer this year is indicative of a warming world disingenuous. With La Nina coming on, look for a cool summer again next year. With a negative PDO look for colder years ahead. This will accelerate when the Atlantic cools. The active hurricane season will remove some of the heat built up in the Atlantic by the El Nino suppressed activity last year and reduced winds (mixing) and increased sunshine with a suppressed jet stream, weakened suppressed subtropical high pressure due to record blocking this past winter.
Theo Goodwin says:
September 18, 2010 at 9:45 am
anna v says:
September 17, 2010 at 9:18 pm
Your url gives me an error. Would you try again, please?
try without the last bit?
http://neo.sci.gsfc.nasa.gov/
it is funny, but the search
The average daily temperature in Orlando was above average in both July and August, but daily highs in Orlando were below normal. This seeming contradiction is due to the fact that while the daytime highs were cooler than normal, the nighttime lows were much warmer than normal. So, is this a sign of overall warming or cooling? Could it be that there has been an increase in the cloud cover which reflects more sunlight during the day, but then holds in more temperature at night like a blanket?
The important question to me in this regard is this: When an increase in the cloud cover keeps the daytime high cooler than normal, what would the predicted impact of that increased cloud cover be for nighttime temperatures? (How much should one predict that the daytime heat would be retained during the night, thereby increasing the nighttime lows by slowing the escape of heat?)
It seems intuitive to me that an increased cloud cover would affect the temperature, but that the impact would be greatest on the nighttime temperature. If that is true, then the fact that the average daily temperature here in Florida was above average in both July and August, that would not necessarily indicate an increased heat inventory in the entire atmospheric column, just in the atmosphere near the ground (below the cloud cover). It would be possible to have a cooling atmosphere (as measured from the ground to the top of the atmosphere) and yet have a warming average for the atmosphere near the ground.
To illustrate, during the winter when it is cold inside at night, I pile on the blankets. Although the average temperature of the entire room is much colder than during the summer nights, the temperature under the blankets is actually toastier during the winter than during the summer.
Chad Woodburn says:
September 18, 2010 at 1:21 pm
Hello Chad.
You have pointed up the significance of a point I made a while ago in another thread but which went largely unnoticed.
It related to the importance of layering in the oceans and atmosphere and the potential for differential warming and/or cooling in each layer.
For example a cooling ocean releasing more energy to the air will warm the troposphere even as the oceans cool.
Warming sea surfaces will occur even as the lower ocean layers are losing energy upwards.
A cooling stratosphere appears to occur when the higher layers of the atmosphere are warming from a more active sun and now that the higher layers are cooling from a less active sun the stratosphere seems to be warming slightly.
There are lots of layers in oceans and air all capable of warming or cooling at different speeds in response to both changes in the rate of energy release by the oceans and the net energy flux to space which seems to be affected by the level of solar activity.
A warming troposphere tells us little in itself as regards the net effect on the energy content of the system as a whole.
Surface thermometer readings are therefore not a true representation of total system energy content and even satellite readings only tell us the total energy quantities arriving or leaving from moment to moment but nothing about the changing energy content of the numerous individual layers of ocean and atmosphere.
Applying that to the subject of this thread I would say that the current conflicting signals are due to the combination of the recent El Nino releasing energy faster to the air so that the troposphere warms whilst at the same time the less active sun allows the stratosphere to start warming once more which enhances the polar oscillations to push the jets more equatorward despite the opposing effect of that El Nino and thereby reduces upward energy loss to space.
Thus for a short time only we have a build up of energy in the troposphere from both the El Nino pushing energy upward and the quiet sun slowing the loss of energy to space.
However the more equatorward jets allow much more looping of the jets and blocking of the normal west to east airflows producing persistent areas of both anomalous warmth and cold.
Meanwhile in the background the more equatorward jets have increased global albedo which reduces solar shortwave into the oceans to ensure that the balance of energy throughput changes to the negative overall but the effects will only become fully apparent as the negative PDO progresses and will become apparent more quickly if at any time the sun gets significantly more active so as to accelerate the upward energy flux once more.
Currently during the interglacial I contend that generally over longer timescales (500 to 1000 years at a time) the solar and oceanic effects generally offset one another to minimise climate swings and hopefully that will continue otherwise we will have a lot more than CO2 to worry about.
It could be that the whitewashes that we have seen so far were not primarily intended to be PR exercises, but rather to be used as ammo in US court cases to shoot down challenges to the IPCC’s credibility. It’s good, therefore, that the two recent dissections of those whitewashes have been posted.
After doing some number crunching it appears that our sun spot and magnetic indicators we could well be in for a 70 to 110 year cool spell. if you follow the regression charts and indicators we could well be on our way to a Maunder or Dalton event..
Boy that didn’t read very well… this is what happens when you try to do 5 things at once..
Doug in Seattle says:
September 18, 2010 at 12:18 am
I am pretty sure that the IPCC reported in its last report that they were really sure that the sun had only a negligible effect on climate.
………………………………………………………………..
interestingly, the IPCC and its very FLAWED report don’t hold much credibility any more…
I predicted that 2010 would be a very hot summer in the eastern USA (I live in Florida) owing to the cold January and February.
My reasoning was rather subjective owing to the most memorable snowfall of my youth occurring in February/March 1947 in Pembrokeshire, south Wales. In a county that seldom sees snow and has many palm trees, there was six feet of snow that hung around for six weeks!
The summer of 1947 was the warmest I can remember with high temperatures and very few cloudy days.
Can we blame Welsh weather on El Nino or the PDO?
—you say (to paraphrase) that a hot summer usually follows a cold winter. I’ve noticed this in England as well. For instance, at the age of 8 I remember the exceptionally cold and snowy winter of 1947 which was followed by an incredibly hot summer. In fact, although this pattern also followed in 1963 I cannot remember a colder/hotter year than 1947. For instance, in that summer I clearly remember two photos from a tabloid paper my family used to take: on the front of one edition, over a picture of a London park with sunbathers, was the headline: Phew, 100F in the shade! And in another there was a picture of someone frying an egg on the pavement!
The map shows the area around Carson City, NV as being slightly warmer than average – but I swear it has been cooler!
I don’t recall one day of temps of 100 degrees or more – for which I am very grateful. The mid to upper 90’s are more than enough for me.
In any case, it’s hard to believe that we had a 2 degree warmer than normal summer.