Hot summer after a cold winter
Joe D’Aleo, ICECAP
Washington DC and many cities of the east and south had a warm to record warm summer (while parts of the west had a cold to record cold) with the average for the nation the 4th warmest on record. For Washington, it broke many of the records set in 1980 and 1988. It tied with the number of 90F days set in 1988 and fell just 12 days short of the number of 90F days for the year (a few additional still possible) set in 1980.
A hot summer is very typical when a strong La Nina follows a strong El Nino winter (1999, 1988, 1966) or when record strong arctic blocking in winter fades (1977). This past winter we saw a record for negative Arctic Oscillation (AO) beating out 1976/77 and 1965/66

The summer was 2.2F above normal for the nation, ranking it as fourth warmest. See map:

That matches how much last winter the US averaged below normal (2.2F). Last winter was coldest in the south and southeast (in a few spots, coldest ever). Colder to the south of DC but recall DC and surroundings had a record seasonal snowfall.

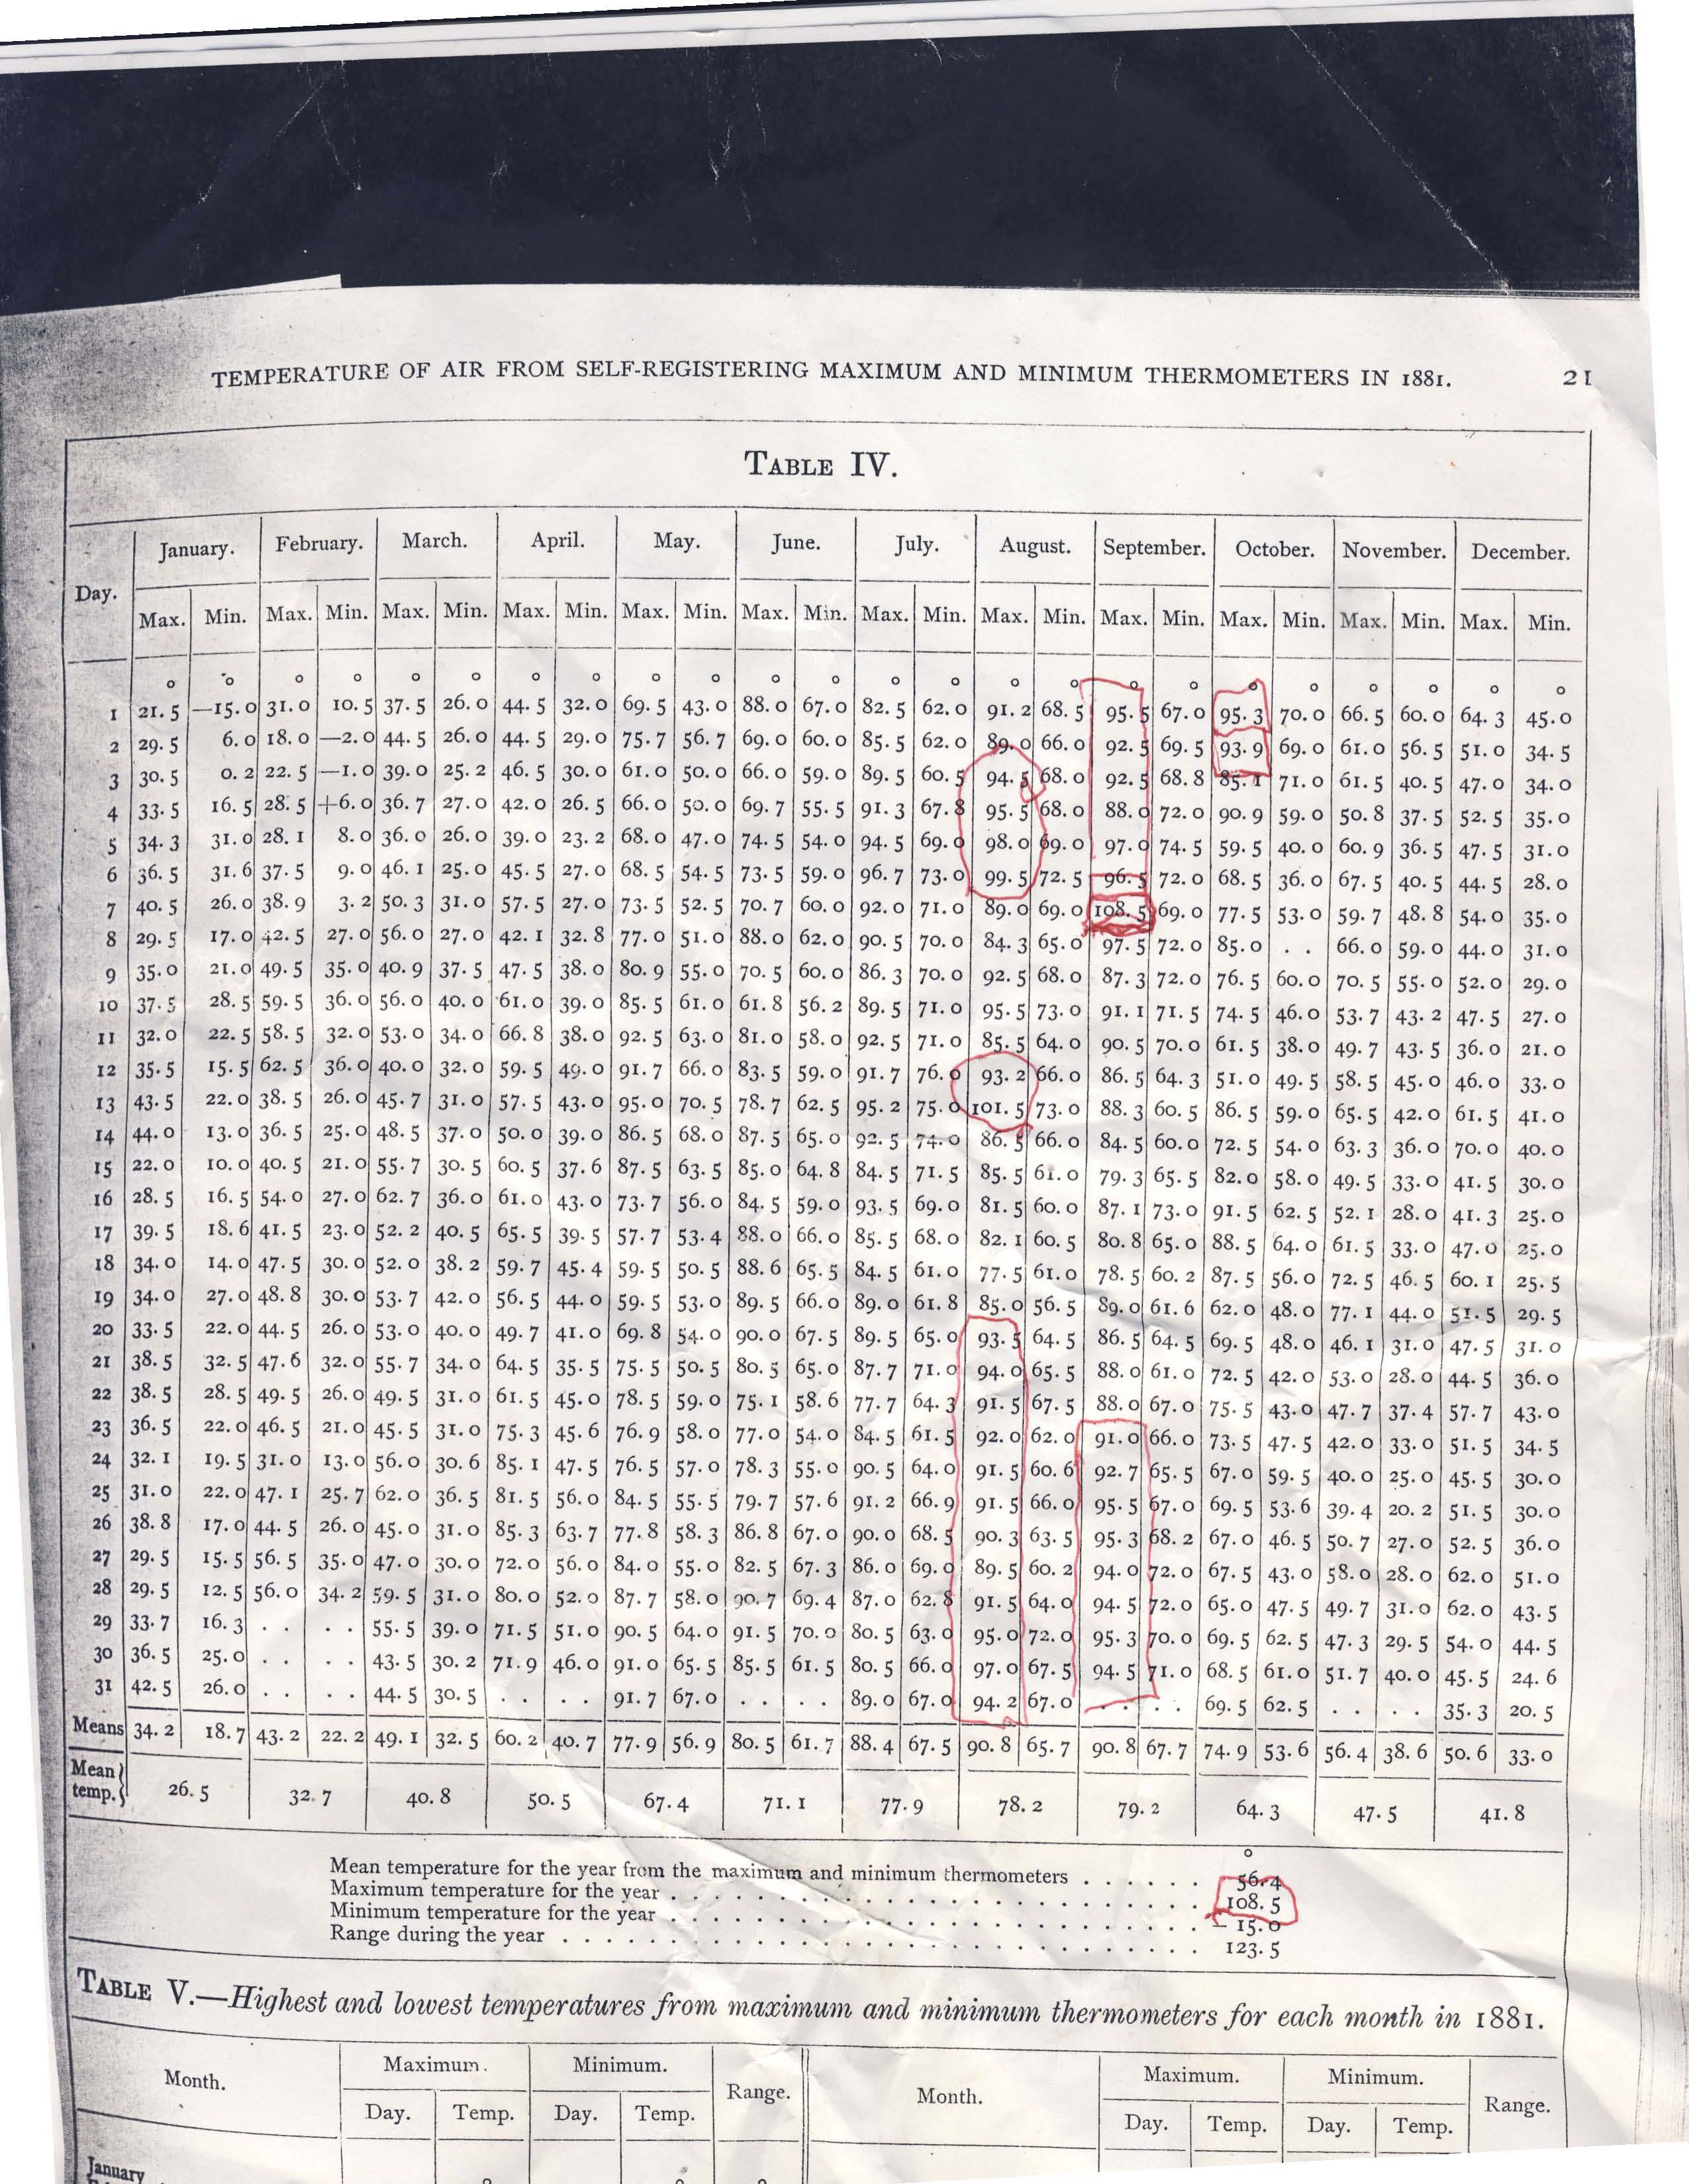
Besides 1980, 1988, other hot summers included 1881, where this record from “Andy” out of the Naval Observatory shows an amazing summer following a very cold January/winter. He writes:
I am attaching a rather rare document, Washington DC weather records for the year 1881 taken at the Naval Observatory.
I have highlighted an incredible late summer, early autumn heat wave that got started on August 20th and did not really end until October 4th. There has never been anything remotely approaching the intensity and duration of this heat wave for so late in the year in modern times.
An unbelievable temperature of 108.5 was recorded on the very late date of September 7th! Also the average September average high temperature of 90.8 dwarfs anything you can find in recent years. One could argue that the site or thermometer might reflect a warm bias. Examining the data, June was actually quite cool and July was about average. And back then, no one was pushing an agenda!
The summer this year was characterized by hot days with high humidities and thus very warm nights. Nighttime lows were especially above the normal. Ironically many of the same areas with warmth this summer had very cool summers the last two years with a record/near record cold July in 2009.

That was consistent with a summer after a La Nina winter, one with low solar and high latitude volcanic activity. Last summer and last winter we were told that was weather not climate. This makes any claims that a hot summer this year is indicative of a warming world disingenuous. With La Nina coming on, look for a cool summer again next year. With a negative PDO look for colder years ahead. This will accelerate when the Atlantic cools. The active hurricane season will remove some of the heat built up in the Atlantic by the El Nino suppressed activity last year and reduced winds (mixing) and increased sunshine with a suppressed jet stream, weakened suppressed subtropical high pressure due to record blocking this past winter.
Hmm. noticed the most populated (warm) areas are in the East UHE? in the mix too?
Meanwhile in Australia, Melbourne has according to BoM had a record cool start to spring still not having recorded a day above 17 degrees C. This is also due to a strong La Nina.
I read the book 1776 while on vacation, and it looks like that year in New England was a La Nina year. The summer was very hot, and the autumn was abnormally warm and dry, except when ferocious storms rolled through that were described as having an intensity suitable for hurricanes. The winter was harsh, complete with a frozen Delaware River and blizzards.
It’s pretty remarkable–and fortunate–that people bothered to keep meticulous records of the weather in that time despite the turmoil.
I give up. Warming is real.
This report means nothing to me because it does not distinguish between daytime highs and nighttime lows. Ninety degrees at three in the afternoon means something very different from ninety degrees at one in the morning. The latter can be caused by UHI. When showing charts of the sort shown above, there should always be two sets of charts, one for daytime and one for nighttime. It is really important. I am not at all impressed by higher temperatures at nighttime. I am greatly impressed by the fact that daytime temperatures are not rising. We will undoubtedly discover that we need more than two temperature measurements during each day. An entirely new regime of temperature measurement is sorely needed.
I can tell you that that map for Mason County West Virginia is absolutely false. For June to August we were just below normal to normal. When I see those maps, and they differ from the actual temperatures in our location I have no other choice but to believe that something untoward us going on at NASA. Someone can argue means and averages all they want but my slice of WV should be green on that Jun-Aug map.
“With La Nina coming on, look for a cool summer again next year. With a negative PDO look for colder years ahead. ”
You’ve been pushing this ridiculous meme for some time. If 2010 is indeed going to be the warmest on record than it’s fairly easy to guess that next year will be cooler, but how about making a real prediction. Why don’t you come out and make a prediction that the 2010’s will be cooler than the 2000s, or something like that.
First US Map: For a lot of California, especially Northern Ca from the Oregon border to Sacramento, summer was late to very very late. Temps averaged very below normal, 5 degrees in most places, and at times dropped to 10 degrees below normal for entire weeks. So, as long as comparisons are going to be made and believed, the 1st thing that has to happen is to establish confidence in the data reported. Many gardens either failed or were extremely late in this state.
Far as I can tell, numbers are fudged upwards for California from what really happened, and I assume that fudging was propagated to many other states.
Sorry, NOAA, but your believability rating is not so stellar.
Mark S wants a prediction. How about an unusual November chill sweeps leftists out of Washington?
It will be interesting to see the statistics for the UK. As everyone knows, the MET office is very pro AGW. However, in the UK, we had a cold winter (said to be the coldest for about 30 years) and we have had a cold summer (late June and July were warm but August and September has been cold). Tonight frost has even been forecasted for some parts of the South East.
I am waiting to see the spin on it when the ‘data’ is reported.
“but my slice of WV should be green on that Jun-Aug map.”
And I must have missed that cool green summer in South Texas.
Last summer was worse ( a triple digit Tmax almost every day) than this year,
but I can’t believe this year was below average. Could be my comfort zone is shrinking.
OT: Is that a sizable sunspot rotating into view?
Mark S says:
September 17, 2010 at 7:36 pm
2010 will only be the warmest year in the fantasy world of James Hansen. And spare us the faux outrage. If next summer we’re still experiencing la nina, it will be cooler. It isn’t a meme. It’s a simple observation.
If 2010 is indeed going to be the warmest on record than it’s fairly easy to guess that next year will be cooler,
Is that your winning method at the roulette wheel?
The White House and NASA are making press announcements today to promote Global Climate Disturbance (destruction) instead of GW and pronouncing 2010 to tie 1998 as the hottest year on record – globally. The political spin continues.
Meanwhile the US Chamber of Commerce and the State of Texas have separately filed suits that the US EPA had no basis to list CO2 as a criteria pollutant under the Clean Air Act. These suits are filed in different federal districts. Conflicting rulings will likely end up at the Supreme Court.
So California has Proposition 23 (November 2 ballot) to set aside its “Climate Change” (California’s phrase) program. They (CARB) says that the Western States’ Initiative ( CA, New Mexico, some Canadian provinces) is set to be ready to go.
What a mess. Note that the Texas suit is filed on the grounds that the conclusions of the IPCC, that were relied upon by the US EPA, are bogus and were demonstrated to be bogus based upon the UEA Climate gate affair and subsequent revelations about the IPCC use of inappropriate statements of data and conclusion. Texas may have just forced a federal court to get involved in climategate. No more whitewash.
I realize that this may be OT, but thought that we all benefit by this information.
Note NOAA’s quoted Long Term Average on the first anomaly chart. The selection of the period for the average means everything in calculating the anomaly. The period selected conveniently avoids the 30’s/40’s, and the late 90’s. So NOAA’s anomaly here has no meaning whatsoever, apart from its relationship to the stated period. There’s nothing proven or accomplished otherwise. To keep the fantasy of warming alive, we’re likely to see that period settle more and more, until it is only the winter of 1977.
Tom in Texas says: at 7:59 pm
“OT: Is that a sizable sunspot rotating into view?”
Sunspot? Yes. Have a look here:
http://www.solarcycle24.com/
Perhaps there should be an agreed upon “long term average” for it seems that NOAA documents leave this to the whims of the individuals writing these things up. For example, this one has the period 1901-2000. The report is dated May 7, 2010.
http://www.noaanews.noaa.gov/stories2010/20100507_aprilstats.html
I doubt there is going to be a significant difference regarding interpretation but, still, it seems unnecessary and odd.
Hardly surprising: effects of large high pressure anticyclones are heatwaves in summer and cold spells in winter, hence the temperature data over the US.
Theo Goodwin says:
September 17, 2010 at 7:35 pm
This report means nothing to me because it does not distinguish between daytime highs and nighttime lows.
Have a look at :
http://neo.sci.gsfc.nasa.gov/Search.htm
You can choose night or day, temperature or anomaly and supposedly do your own analysis
“This past winter we saw a record for negative Arctic Oscillation (AO) beating out 1976/77 and 1965/66”
And, similarly for the period of record, low solar activity.
Could there be a link ?
Mark S says:
September 17, 2010 at 7:36 pm
If someone is saying that 2010 is going to be the warmest on record based on the first 2/3 of a year, you might do well to challenge him to a bet.
From “regression to the mean” to signs that La Niña cooling is settling in, I don’t think the weather will keep up with a record pace.
The White House and NASA are making press announcements today to promote Global Climate Disturbance (destruction) instead of GW and pronouncing 2010 to tie 1998 as the hottest year on record – globally.
Policyguy, what do you make of the global temperatures for the period May 2009 – April 2010 (or June 2009 – May 2010)?
John F. Hultquist says:
September 17, 2010 at 8:39 pm
Tom in Texas says: at 7:59 pm
“OT: Is that a sizable sunspot rotating into view?”
Sunspot? Yes. Have a look here:
http://www.solarcycle24.com/
Wake me up when the corrected total sunspot area breaks 1,000:
ftp://fenyi.solarobs.unideb.hu/pub/SDD/data/hQL_SDD2010.txt
http://www.swpc.noaa.gov/ftpdir/indices/quar_DSD.txt
Really wake me up when we get anywhere near this day in SC23:
2003 10 30 271 293 5690 2 -999 C2.8 6 2 0 2 2 0 0
Looks like NASA and NOAA have taken up the Hide the decline that EAU/MET/Jones were doing.. just looking at regional temps for areas they are 1.5 deg C to high… in most of them…
Looks like an agenda thing to me…
“This trend was seen to continue in observations of the first sunspots of the new solar Cycle 24, and extrapolating a linear fit to this trend would lead to only half the number of spots in Cycle 24 compared to Cycle 23, and imply virtually no sunspots in Cycle 25. ”
http://arxiv.org/abs/1009.0784v1
I wonder if the SUN has anything to do with this…. COOLING?
What are we worried about?
We have entered a solar minimum. We should be tracking what we see and know.
Let’s look at our Atlantic hurricane season. Powerful hurricanes turned away from the US. WHY? La Ninos ??? Maybe, Lack of high atmosphere humidity? Maybe!!! We yet to put that piece in the puzzle.
Our winters are growing severe. How does an Ice Age or a mini Ice Age start?
Cold winters and droughts so far. Anyone monitoring droughts? The US is getting socked with droughts, the Amazon lowest in 47 years, Russia and Ukraine can sell off any grain due to droughts and fires.
I’ve been watching that in Florida for 15 years, Low sunspot activity causes drought and then the fires come. I expect some big ones in the coming years here in Florida.
I warned the Governor and various agencies here in Florida of what is coming time and time again. What a waste of time. They still let people irrigate their lawns. Lakes are low. Morons??? No, politicians! Is that the same thing? “Hey Bill, when are you going to let up and let me water my lawn?” said the rich campaign contributor.
By winter they will be up at Four Corners getting beat up by businesses about why they can’t get more water. Too much tourism. The Ecology of Florida has a sink hole in it between Orlando and Miami.
Anyone monitoring elderly and poor people deaths? England and Ireland are. Not pretty.
They have lost a lot due to winters, not summers.
As I have told people who hear over and over again we are on the first leg of the roller coaster in our first modern technology solar minimum. We have tipped the top of the first hill and we don’t know where the bottom is at.
According to this scientist from Russia we are on the edge of another mini- ice age or worst. http://www.wnd.com/index.php?fa=PAGE.view&pageId=155225
The morons in the Southern Hemisphere are painting rocks white and trying to stop mining to save their glaciers.
We have enough politicians in Florida that if they lived in South America, they would order mining to stop and to paint more Rocks.
We are surrounded by idiots. We have a national leaders who want to breach Dams, paint our roofs white and shut down coal burning plants. “Oh!, we will just build an atomic plant or two. We just issued the permit the other day. After ten years of law suits, we should get started in a decade or two.”. Shoot, By then, Lord only knows what will be left.
So, if you are worried about global warming, count your last few blessings.
See ya. Signing off for a while, maybe after Christmas I will sign on again. Nothing Knew here.
It is time to get back to my studies.
Paul
Bill H says:
September 17, 2010 at 11:15 pm
“I wonder if the SUN has anything to do with this…. COOLING?”
I am pretty sure that the IPCC reported in its last report that they were really sure that the sun had only a negligible effect on climate.
Joe,
Don’t forget us in Europe, we generally only get one source!
Whilst reporting the warmest summer on record, ( it was not!) the BBC failed to report any cold records broken in the SH winter. Another way to keep the AGW band rolling.
“A hot summer is very typical when a strong La Nina follows a strong El Nino winter (1999, 1988, 1966) or when record strong arctic blocking in winter fades (1977). ”
1966, 1977, 1988, 1999 and now 2010.
Every 11 years… If that isn’t a pattern… How about 1955 or 1944 ?
I saw Pres. Obama’s science advisor, Dr. John Holdren, speak about “climate disruption” at his keynote address to the National Academy of Engineers in April, 2010.
Here are the powerpoint slides of his speech, well worth reading:
http://www.whitehouse.gov/sites/default/files/microsites/ostp/jph-chicago-04212010.pdf
Clearly, this policy has been in the works for quite a while!
Mark S
“You’ve been pushing this ridiculous meme for some time. If 2010 is indeed going to be the warmest on record than it’s fairly easy to guess that next year will be cooler….”
Surely not, according to CAGW.
“Washington DC and many cities of the east and south had a warm to record warm summer (while parts of the west had a cold to record cold) with the average for the nation the 4th warmest on record.”
Well that’s interesting. ABC World News informed me Friday night that this is the hottest year ever, just as GISS is working hard to ensure. They also made sure I knew the strong storms that hit New York City with the tornado that hit New Jersey were proof of global warming, while noting the several times in the historical past when they happened before. That was a lot of city dwellers freaked out, especially with public transportation shut down, guess it was a great time to make sure they knew it was a proven peer-reviewed scientific fact that they’ll be getting more of the same until they repent and turn away from their carbon sins.
Remember one of the great tenets of the (C)AGW faith, suitable as a meditation mantra after reviewing the instructional video from The Revered High Priest Al Gore:
Weather is not climate unless weather is Climate Change.
Re: Theo Goodwin says:
September 17, 2010 at 7:35 pm
From the main post
The summer was 2.2F above normal for the nation, ranking it as fourth warmest. See map:
2.2F is ~1.2 deg C. UAH recorded an August anomaly for the US of 1.03. The UAH anomaly is relative to the 1979-98 period while the anomaly in the post is relative to the 1950-95 period so, all things being equal, we’d expect the UAH anomaly to be lower. It was – by ~0.2 deg.
There doesn’t seem much evidence of a UHI effect.
No doubt the warmists will convert this information to their advantage, but whilst this information is of passing interest, surely the fourth hottest year is not a very significant fact in the GW debate. Not the hottest or second or third hottest but the fourth hottest. So what. Furthermore, its always interesting to note that the ‘ fourth hottest summer on record’ is compared not with temperatures for the past few years as we might have expected had it been the result of AGW. but the years 1966, 1988 and 1999. I wonder what caused the high temperatures in those years?
I also question the relevance of any temperature graphs on small specific areas like an American state or the whole of America in fact. Surely these figures can only be meaningful to the AGW debate if other areas of the world are treated in a similar manner and comparisons made. What, I wonder has the temperature been doing in Europe, the Middle and Far East, Australia, Scandinavia and all other areas of the World. Worldwide comparisons is surely the only way to draw relevant conclusions on what the temperatures are doing on a global scale.
Query: Can you double-check your wording in your text in this section:
That was consistent with a summer after a La Nina winter, one with low solar and high latitude volcanic activity. Last summer and last winter we were told that was weather not climate. This makes any claims that a hot summer this year is indicative of a warming world disingenuous. With La Nina coming on,
I think it should say:
That was consistent with a summer after a El Nino winter, …
Thanks,
DET
Tom in Texas says:
September 17, 2010 at 7:59 pm
OT: Is that a sizable sunspot rotating into view?
http://www.landscheidt.info/?q=node/50
2010/09/17 04:30 Today was a poor day for viewing. Only 5 minutes were available and that was shot through cloud. Even so the main activity is clearly visible. But even on a clear day the 64x Wolfcam would not see the multitude of specks on the face right now.
http://www.landscheidt.info/images/Sept_17_4.30.png
Dr P.H. refers to the linked presentation by Dr. Holdren. It is evident that “climate disruption”, as the new, improved product has been in the works for a while. When all is said and done, the concluding sentence summarizes the presentation, nicely;
“it’s a huge asset and a huge opportunity to have a
President who gets it!”
This is all very silly. The UK had a staggeringly cold winter, a warmish spring and hotter mid-year followed by a lousy wet August and what is developing into a cold autumn. The average person, who may know little about any of the issues involved but who nevertheless experiences weather and climate over their lives, will tell you that this wasn’t what’s described here. The real targets for all this bs isn’t the general populace, who are more worried about their jobs than fractional temperatures, but the dim politicians who will be utterly uncritical and ill-infomed about any of it. And that’s what counts isn’t it?
What stands out like a sore thumb is the way the AO stayed negative. It was a blocking pattern that “locked in.” The same sort of “locked-in” blocking pattern resulted in the heat, drought and fires around Moscow last summer.
I tend to over-simplify, and then look for places my over-simplification completely fails to explain events. The last time a warm PDO and AMO gave way to a cold PDO and then cold AMO was in the 1950’s. My over-simplification postulates that the same ingredients should give the same results, however the “unprecedented” AO is a new result.
So, what to do next? Look for what is different, which might have led to these different results.
1.) A miniscule increase in a trace gas called CO2. (Billions spent studying this.)
2.) The giant sun changing its behavior. (Leif could use more money.)
Hmmm. I am well aware we can’t figure out how the exact mechanics of how the “quiet sun” could possibly effect us, however that does not prove it has no effect. I assume it is what is changing things.
I should also mention:
3.) In the 1950’s all the soot and smoke from industry was on one side of the planet. (America and Europe.) Now all the soot and smoke in on the other side. (India and China.) You couldn’t ask for a better set up for an experiment on the effects of soot and smoke, short of shutting down all industry on earth for a time.
Can’t buy the first anomaly map. Western Colorado is shown at 1.5° above normal. Considering summer started two weeks late, and ended two weeks early, and nighttime lows were not unusually warm, the map is silly.
But it’s running cold and wet in Australia and Britain:
http://chiefio.wordpress.com/2010/09/18/aussie-cold-and-wet/
http://chiefio.wordpress.com/2010/09/18/british-cold-rather-early-too/
Texas may have just forced a federal court to get involved in climategate. No more whitewash.
Texas may have just forced a federal court to get involved in climategate. This will be the mother of all whitewashes.
There… Fixed it for ya.
RE: Paul Pierett says:
September 17, 2010 at 11:35 pm
“See ya. Signing off for a while, maybe after Christmas I will sign on again.”
Yeah, yeah, yeah. I’ve heard that before. Repeat, after me, singing:
“Oh, you swear, as you leave Vegas,
That you’re not a gambling man,
But then you find you’re back in Vegas
With a handle in your hand…”
The fact is that this site is as addictive as gambling. Fortunately it is less expensive.
Joe Matais says:
September 18, 2010 at 4:55 am
Dr P.H. refers to the linked presentation by Dr. Holdren. It is evident that “climate disruption”, as the new, improved product has been in the works for a while. When all is said and done, the concluding sentence summarizes the presentation, nicely;
“it’s a huge asset and a huge opportunity to have a
President who gets it!”
——-
Yup! Good eyes, thanks for mentioning that!
Unfortunately for the CAGW crowd, Pres. Obama rolled the dice on grand populism vs. extreme environmentalism and may end up losing at least the House, if not both House and Senate, to the Republicans in the fall due to his push towards health care, stimulus (haven’t stimulated much) etc. So, if Pres. Obama “gets it” (e.g. CAGW), he doesn’t seem to care a whole heck of a lot.
If Sen. Jim Inhofe regains his old chair as Chairman of the Senate Environment Committee, bar the door!
RichieP says: September 18, 2010 at 5:31 am
The UK had a staggeringly cold winter, a warmish spring and hotter mid-year followed by a lousy wet August and what is developing into a cold autumn.
I think there is a prolonged and significant change of the North Atlantic’s temperatures trend.
In my own investigation into the Central England Temperature oscillations since 1650 , I have identified a natural trigger for those changes. The CET response is cumulative and variable in intensity and delay, but always there.
http://www.vukcevic.talktalk.net/CETnd.htm
Latest data implies a down-trend at least comparable to one in the 1950-60s
“Climate Disruption” is such a scream. The phrase was chosen by someone who shamelessly intends to avoid claims that AGW theory has suffered falsification. Of course, it could have been chosen by someone who has no understanding of scientific method whatsoever, but no such person would be working for the Obama administration, right?
anna v says:
September 17, 2010 at 9:18 pm
Your url gives me an error. Would you try again, please?
Theo Goodwin says: September 18, 2010 at 9:45 am
link: http://neo.sci.gsfc.nasa.gov/
I just found Dr. John Holdren’s updated speech powerpoint on “climate disruption,” presented in Oslo, Norway on September 6, 2010:
http://www.foxnews.com/politics/2010/09/16/white-house-global-warming-global-climate-disruption/
Please note the last page of slides, this is VERY important!!
National climate-change legislation
• President Obama was emphatic that new US
energy legislation should include climate, above
all a price on carbon emissions.
• The climate component was reluctantly &
temporarily abandoned because of insufficient
support in the US Senate.
• We will try anew in the next Congress; in the
meantime, EPA is moving ahead to control
greenhouse gas emissions by regulation.
Theo Goodwin says:
September 18, 2010 at 9:45 am
anna v says:
September 17, 2010 at 9:18 pm
Your url gives me an error. Would you try again, please?
try without the last bit?
http://neo.sci.gsfc.nasa.gov/
it is funny, but the search
The average daily temperature in Orlando was above average in both July and August, but daily highs in Orlando were below normal. This seeming contradiction is due to the fact that while the daytime highs were cooler than normal, the nighttime lows were much warmer than normal. So, is this a sign of overall warming or cooling? Could it be that there has been an increase in the cloud cover which reflects more sunlight during the day, but then holds in more temperature at night like a blanket?
The important question to me in this regard is this: When an increase in the cloud cover keeps the daytime high cooler than normal, what would the predicted impact of that increased cloud cover be for nighttime temperatures? (How much should one predict that the daytime heat would be retained during the night, thereby increasing the nighttime lows by slowing the escape of heat?)
It seems intuitive to me that an increased cloud cover would affect the temperature, but that the impact would be greatest on the nighttime temperature. If that is true, then the fact that the average daily temperature here in Florida was above average in both July and August, that would not necessarily indicate an increased heat inventory in the entire atmospheric column, just in the atmosphere near the ground (below the cloud cover). It would be possible to have a cooling atmosphere (as measured from the ground to the top of the atmosphere) and yet have a warming average for the atmosphere near the ground.
To illustrate, during the winter when it is cold inside at night, I pile on the blankets. Although the average temperature of the entire room is much colder than during the summer nights, the temperature under the blankets is actually toastier during the winter than during the summer.
Chad Woodburn says:
September 18, 2010 at 1:21 pm
Hello Chad.
You have pointed up the significance of a point I made a while ago in another thread but which went largely unnoticed.
It related to the importance of layering in the oceans and atmosphere and the potential for differential warming and/or cooling in each layer.
For example a cooling ocean releasing more energy to the air will warm the troposphere even as the oceans cool.
Warming sea surfaces will occur even as the lower ocean layers are losing energy upwards.
A cooling stratosphere appears to occur when the higher layers of the atmosphere are warming from a more active sun and now that the higher layers are cooling from a less active sun the stratosphere seems to be warming slightly.
There are lots of layers in oceans and air all capable of warming or cooling at different speeds in response to both changes in the rate of energy release by the oceans and the net energy flux to space which seems to be affected by the level of solar activity.
A warming troposphere tells us little in itself as regards the net effect on the energy content of the system as a whole.
Surface thermometer readings are therefore not a true representation of total system energy content and even satellite readings only tell us the total energy quantities arriving or leaving from moment to moment but nothing about the changing energy content of the numerous individual layers of ocean and atmosphere.
Applying that to the subject of this thread I would say that the current conflicting signals are due to the combination of the recent El Nino releasing energy faster to the air so that the troposphere warms whilst at the same time the less active sun allows the stratosphere to start warming once more which enhances the polar oscillations to push the jets more equatorward despite the opposing effect of that El Nino and thereby reduces upward energy loss to space.
Thus for a short time only we have a build up of energy in the troposphere from both the El Nino pushing energy upward and the quiet sun slowing the loss of energy to space.
However the more equatorward jets allow much more looping of the jets and blocking of the normal west to east airflows producing persistent areas of both anomalous warmth and cold.
Meanwhile in the background the more equatorward jets have increased global albedo which reduces solar shortwave into the oceans to ensure that the balance of energy throughput changes to the negative overall but the effects will only become fully apparent as the negative PDO progresses and will become apparent more quickly if at any time the sun gets significantly more active so as to accelerate the upward energy flux once more.
Currently during the interglacial I contend that generally over longer timescales (500 to 1000 years at a time) the solar and oceanic effects generally offset one another to minimise climate swings and hopefully that will continue otherwise we will have a lot more than CO2 to worry about.
It could be that the whitewashes that we have seen so far were not primarily intended to be PR exercises, but rather to be used as ammo in US court cases to shoot down challenges to the IPCC’s credibility. It’s good, therefore, that the two recent dissections of those whitewashes have been posted.
After doing some number crunching it appears that our sun spot and magnetic indicators we could well be in for a 70 to 110 year cool spell. if you follow the regression charts and indicators we could well be on our way to a Maunder or Dalton event..
Boy that didn’t read very well… this is what happens when you try to do 5 things at once..
Doug in Seattle says:
September 18, 2010 at 12:18 am
I am pretty sure that the IPCC reported in its last report that they were really sure that the sun had only a negligible effect on climate.
………………………………………………………………..
interestingly, the IPCC and its very FLAWED report don’t hold much credibility any more…
I predicted that 2010 would be a very hot summer in the eastern USA (I live in Florida) owing to the cold January and February.
My reasoning was rather subjective owing to the most memorable snowfall of my youth occurring in February/March 1947 in Pembrokeshire, south Wales. In a county that seldom sees snow and has many palm trees, there was six feet of snow that hung around for six weeks!
The summer of 1947 was the warmest I can remember with high temperatures and very few cloudy days.
Can we blame Welsh weather on El Nino or the PDO?
—you say (to paraphrase) that a hot summer usually follows a cold winter. I’ve noticed this in England as well. For instance, at the age of 8 I remember the exceptionally cold and snowy winter of 1947 which was followed by an incredibly hot summer. In fact, although this pattern also followed in 1963 I cannot remember a colder/hotter year than 1947. For instance, in that summer I clearly remember two photos from a tabloid paper my family used to take: on the front of one edition, over a picture of a London park with sunbathers, was the headline: Phew, 100F in the shade! And in another there was a picture of someone frying an egg on the pavement!
The map shows the area around Carson City, NV as being slightly warmer than average – but I swear it has been cooler!
I don’t recall one day of temps of 100 degrees or more – for which I am very grateful. The mid to upper 90’s are more than enough for me.
In any case, it’s hard to believe that we had a 2 degree warmer than normal summer.