The MWP has been vigorously argued to be a regional northern hemisphere phenomenon only, but this new study finds it in South America. In this new paper they write:
“The most striking features in the reconstruction are the warm temperatures from ∼1050 to ∼1300 AD compared to the preceding and following centuries, the persistent cooler temperatures from ∼1400 to ∼1800 AD, and the subsequent rise to warmer temperatures which eventually seem to exceed in the last decades of the 20th century the range of past variation.
While the onset of the warm period around 1050 AD is almost consistent within the dating error (±60 years at 1000 AD) with the perception of a Northern Hemisphere (NH) MWP from 950 to 1100 AD, it is remarkable to note that it seems to have lasted about 200 years longer in the tropics.”

When I first saw this paper (PDF here h/t to Dr. Leif Svalgaard) I was intrigued by the idea, especially since it demonstrated the MWP very well. The authors also say that “The last decades of the past millennium are characterized again by warm temperatures that seem to be unprecedented in the context of the last ∼1600 years.”
But then a question arose in my mind; how well have they separated all of the Ammonium from worldwide Ammonium fertilizer use (which started in the late 1800’s) from the proxy samples? They do touch on the subject, but I’m not convinced that they have separated the impact. They cite Mann and Jones in the references, and use principal component analysis methods (PCA) so that makes me wonder even more. Perhaps Steve McIntyre or Jeff Id can have a look to see how the PCA was carried out, since I’m no expert in it.
The authors do mention dust accumulation related to tracking South American weather patterns, saying they appear unchanged, but I’m not sure dust is a good indicator of lack of mixing and transport via the global water cycle of Ammonium (NH3 and NH4) which is highly soluble in water.
Chemical fertilizers were introduced in the mid 1800’s; Ammonium Sulfate and Ammonium Nitrate were commonly used. Ammonium Sulfate was originally a by-product from coal gas manufacturing. The quality wasn’t great as a fertilizer but it was used some in the 1800’s.
Ammonium Nitrate was used mostly after World War I as it was the principal ingredient used in explosives. WWI demand increased Ammonium Nitrate production and following the war, was used in agriculture in significant volume. World War II caused even more of an increase in production, and again after WWII production increased globally.
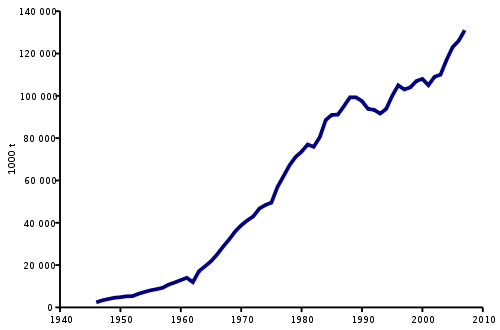
UPDATE: reader “Jaymam” points out this graph, production of Ammonia
When rainwater and Ammonium Nitrate NH4NO3 mix, you get ammonium ions (NH4+) and nitrate ions (NO3–) in solution. Some nitrogen gets used by plants, the remainder is either retained in the soil or transported in runoff. As we all know, rainwater runoff of fertilizer is a big problem, and it is clear that ammonium ions get into the water cycle. This is confirmed by Tiwari et al who did a study of ions in rainwater and found “High concentrations of ammonium in rainwater due to agricultural activity…”
So with increasing use of Ammonium fertilizers in the 20th century, how can we be sure it hasn’t contaminated the Ammonium ice proxy record during the same century?
Still, I find the study interesting for it’s uniqueness.
Abstract:
Ammonium concentration in ice cores: A new proxy for regional temperature reconstruction?
T. Kellerhals,1,2,3,4 S. Brütsch,2 M. Sigl,1,2 S. Knüsel,1,2 H. W. Gäggeler,1,2
and M. Schwikowski2,3 Received 15 June 2009; revised 22 December 2009; accepted 8 March 2010; published 31 August 2010.
[1] We present a reconstruction of tropical South American temperature anomalies over
the last ∼1600 years. The reconstruction is based on a highly resolved and carefully dated
ammonium record from an ice core that was drilled in 1999 on Nevado Illimani in the
eastern Bolivian Andes. Concerning the relevant processes governing the observed
correlation between ammonium concentrations and temperature anomalies, we discuss
anthropogenic emissions, biomass burning, and precipitation changes but clearly favor a
temperature‐dependent source strength of the vegetation in the Amazon Basin. That given, the reconstruction reveals that Medieval Warm Period– and Little Ice Age–type episodes are distinguishable in tropical South America, a region for which until now only very limited temperature proxy data have been available. For the time period from about 1050 to 1300 AD, our reconstruction shows relatively warm conditions that are followed by cooler conditions from the 15th to the 18th century, when temperatures dropped by up to 0.6°C below the 1961–1990 average. The last decades of the past millennium are
characterized again by warm temperatures that seem to be unprecedented in the context of the last ∼1600 years.
Citation: Kellerhals, T., S. Brütsch, M. Sigl, S. Knüsel, H. W. Gäggeler, and M. Schwikowski (2010), Ammonium concentration in ice cores: A new proxy for regional temperature reconstruction?, J. Geophys. Res., 115, D16123,
doi:10.1029/2009JD012603.
Discover more from Watts Up With That?
Subscribe to get the latest posts sent to your email.
The part from 400AD to 1600AD matches Cook’s tree ring data quite nicely.
The part past 1600AD seems to rise rather sharply.
But, as usual, the graph cuts off at 2000.
Loehle’s multiproxy T-reconstruction (without tree rings) is the only legitimate standard of comparison.
This ammonium proxy looks pretty good up to about the 1800s — afterwards, looks like the fertilizer version of UHI effect.
co2science.org has great collections of prior studies showing evidence of Medieval Warm all over the globe.
“Unprecedented”? not very
For ice proxies, cutting off at 2000 makes sense. Ice usually takes a few years to settle into some kind of stable state. Trying to extract meaning from more recent ice is difficult because of this.
Isotopes might be useful in determining the provenance of the ammonia. If modern sources are affected by the use of mineral fertilizers, the nitrogen isotopes ratios in modern precipitation could be significantly different than ratios derived from medieval organic (presumably) sources.
A similar test is often used (using N and O isotope ratios) to determine provenance of nitrates in soil and water. With ammonia you couldn’t use oxygen, but perhaps hydrogen could substitute for the second isotope if it were needed.
I would be very careful here. Often proxies are picked because they tend to prove the point sought, and discarded when they do not (because they are then deemed unreliable). It is always about money, fame, and control.
On the other hand, so far this seems to show the highs lower and the colds milder. That surely is the pattern of the Southern/Western Hemisphere, with deep seas and smaller land masses. And a continent covered in 2 miles of ice at its fore.
But I also find it disturbing that the medieval warm period cannot even equal normalcy. Does this even make sense? How can half the planet only reach average temperature in 1998. The answer is that it can’t.
There is something seriously wrong here.
I have a question, too. Why is the uncertainty constant? I think it should be larger as you go backward in time.
Since the CO2 warming has allegedly kicked in since 1975, the “unprecedented climate change” in tropics has caused 0.2 deg C. But something has been warming the tropics since 1700.
@rbateman:
I guess the proxy actually ends in 1995, and that is because of the 30yr smoothing. Therefore there’s nothing questionable about that.
Data for the (recently identified) North Atlantic precursor is very sparse for pre1600 period, but even so it does confirm very strong MWP.
http://www.vukcevic.talktalk.net/NAP.htm
see also
http://www.vukcevic.talktalk.net/STP.htm
“The MWP has been vigorously argued to be a regional northern hemisphere phenomenon only”
Yes, and Leif’s taken that position with his research paper 1160. Does this new ammonium paper force you to throw 1160 in the bin now Leif? ammonium proxys => MWP was global?
The temperature fluctuations 400 – 1900 vary only about 0.4 C in contrast to the Loehle non-treering proxy global reconstruction, for instance, which varies over 1 C …
http://www.drroyspencer.com/wp-content/uploads/2000-years-of-global-temperature.jpg
…or the Moberg NH reconstruction (red line & ignoring the meaningless heavy black line) which varies 0.8 C…
http://commons.wikimedia.org/wiki/File:2000_Year_Temperature_Comparison.png
This may be a product of the 39 year smoothing in which case surely the graph should not extend to 2000.
Although the search for new proxies should be encouraged, I think that more evidence is needed of calibrations from other sites. The paper argues that this site locality has special properties that isolate it from plausible interferences, so that makes it hard to find a location for other comparison sites.
One has to ask the obvious question of what happened to the temperature (or to early ice movement) at bedrock level, because it should have been warm enough in 400 AD to have exposed bedrock and no ice. But the ice thickness seems to start abruptly at roughly 0.5 m. per year, in the absence of statements to the contrary. The paper would benefit from a statement about why the glacier, just here, seems to have emerged at 400 AD, full-born.
The worldwide nature of the MWP and LIA points to the involvement of variations in jet stream positioning in both hemispheres.
Now it seems that in the MWP Greenland was more habitable than at present which suggests that the jets shifted more poleward back then than they have during the Current Warm Period.
So the evidence of the jets suggests a warmer MWP than today which is an indication that the Ammonium proxy is not as accurate as would be a proxy created from jet stream positioning.
“it is remarkable to note that it seems to have lasted about 200 years longer in the tropics.”
Not so remarkable in the context of latitudinal jet stream movements.
The further poleward one goes the shorter the period that a poleward region would be situated equatorward of the polar jet.
Furthermore I have proposed a warm ocean cycle on a 500/1000 year cycle driving the poleward jet shift to create the MWP (and the Current Warm Period) so obviously the effects would start first and end last in the tropics.
“A further prominent characteristic is the sustained
warming trend that started ∼1720 AD and continues until the
end of the record. The beginning of the temperature increase
is coeval with the end of the Maunder minimum of observed
sunspot numbers around 1715 AD.”
So all the temperature rise from 1720 to date is 95% likely to be a natural recovery from the LIA ?
And the jets have been moving slowly and irregularly poleward since then until the end of the 20th Century and solar activity levels have moved slowly and irregularly upward until the end of the 20th Century.
Now since 2000 we have a cessation of warming, a more equatorward set of jets and a less active sun. Meanwhile CO2 continues upward.
Despite their final concession to the AGW theory this is a heavily anti AGW piece of work.
Lord Christopher Monckton sat before Congress last spring between 4 IPCC members.
It is kind of interesting that during this hearing the woman scientist who sat to the right of Lord Monckton brought up the fact that there was a global warming period before the one we were in now that was much stronger than the present one.
This was based on her personal research in the western USA where she noted the timber line had been higher than the present day timber line.
No one on the Congressional panel picked up on what she was saying. Even her colleagues missed it.
Here we are, saying it again.
Paul
Paul
There’s a steep upward slope in the production of ammonia 1946–2007
http://en.wikipedia.org/wiki/File:Production_of_ammonia.svg
See http://www.co2science.org/data/mwp/mwpp.php for many more studies about the MWP.
meemoe_uk says:
September 2, 2010 at 12:39 am
Yes, and Leif’s taken that position with his research paper 1160.
This was not the intended meaning of that slide [‘shine at any rate on me’]. I wanted to stress the importance of confirmatory data from other regions. Data like discussed in the Kellerhals et al. paper.
It seems even farming/ranching would have upped the ammonia level even without fertilizer due to the degradation of urine.
Also, ammonia isn’t only very soluble in water, it is volatile. It can be transported through the atmosphere.
How they can say the current warming is unprecedented is beyond me, yes according to the graph the temp level is high but the rate of increase has been seen at 850 and at 1050. If the current warming was CO2 related the rate of increase upto 2000 should be the steepest part of the graph. We are recovering from an Ice age still.
I read the article and found the calibration data rather impressive. It will be interesting to read what scientists with expertise in climate proxies think. I think that the reason for largely excluding athropogenic effects on is that the atmospheric live of the amonium compounds in the atmosphere is only a few days. Thus, they are measuring relatively local effects (unlike measurements of CO2). Also, I guess that they are assuming the effects of human agriculture in the region are small or negligible relative to the natural releases in the nearby Amazone region. Again, it would be interesting to read more criticism of the paper and the amonium proxy.
Stephen Wilde says:
September 2, 2010 at 2:27 am
..so obviously the effects would start first and end last in the tropics..
~
Interesting comments, thanks.
Anyone aware of any magnetosphere satellites positioned to study dayside reconnection? I was just wondering about the effects on the equator ward reconnection on the dayside magnetosphere. We always think about the “rubber band like spring back of the night side,” and have satellites watching the nightside reconnection, but what about the dayside, the side that is first impacted by the daily solar winds and sometimes just rips huge holes in the magnetosphere depending of IMF.
Don’t forget all the guano mining on the islands off the coast of South America in the 1800’s.