By Steve Goddard
Summer has come to a premature and frosty end at Santa’s workshop.
")
http://psc.apl.washington.edu/northpole/webphotos/noaa2.jpg
It has been the coldest summer on record north of 80N, and temperatures have dropped below freezing ahead of the average date.
")
The entire ice covered region is now below freezing.
")
http://www.esrl.noaa.gov/psd/map/images/fnl/sfctmp_01.fnl.gif
It also appears that the summer melt season will be the shortest on record. The maximum was reached very late in March, and it appears likely that we are headed for an early minimum.
")
Mark Serreze at NSIDC has stated :
As the climate warms, the summer melt season lengthens …”
He was also reported as saying :
Mark Serreze of the center forecast the ice decline this year (2010) would even break 2007’s record.
Another interesting fact is that we are almost certain to see a large increase in the amount of multi-year ice (MYI) next year. The reason being that almost all of the 1-2 year old ice (turquoise) in the NSIDC map below will become classified as MYI next spring.
")
We have seen a remarkably rapid recovery from the 2008 low volume.
PIOMAS continues to report record low volumes of ice, despite all evidence to the contrary. The image below shows in red how far off the mark their August 15 forecast was. Their modeling error will get much worse over the next two weeks – because they model much of the thick multi-year ice in the Beaufort Sea and Arctic Basin as only a few tens of centimetres thick.

With the cold temperatures, ice area loss has almost stopped.

http://arctic-roos.org/observations/satellite-data/sea-ice/observation_images/ssmi1_ice_area.png
However, ice extent continues to drop – because the Arctic Oscillation has turned negative and winds are compacting the ice towards the pole. This bodes well for continued growth of ice in 2011.
")
http://www.ijis.iarc.uaf.edu/seaice/extent/AMSRE_Sea_Ice_Extent.png
PIPS shows average ice thickness increasing, due to the compression of the ice.
")
There has not been a lot of ice loss during August. The modified NSIDC image below shows in red, areas that have lost ice since August 1. Note that the Greenland Sea appears to have lost ice. This is due to the fact that there has been very little transport out of the Arctic Basin through the Fram Strait, which again bodes well for ice gain in 2011.

The modified NSIDC image below shows ice gain since 2007.

NSIDC maps continue to show more gain (16%) than their graphs (10%.) I have not been able to get a satisfactory explanation from them about the cause of that discrepancy. DMI shows a 25% gain in 30% concentration ice over 2007.
My forecast (dashed line below) minimum of 5.5 million (JAXA) continues to look conservative. It all comes down to what the winds do over the next few weeks. If the winds keep compressing the ice, the minimum may go a little below 5.5. If the winds quiesce, the minimum may come in a little above 5.5 – which is looking like a pretty good number right now. Some people at NSIDC started out with a 5.5 forecast this year, but seem to have backed away from it since.

Academic theories about the Northwest Passage becoming a commercial shipping opportunity appear pretty clueless.
“The plans that you make can change completely,” he says. This uncertainty, delay, liability, increased insurance and other costs of using the Northwest Passage are likely to deter commercial shipping here. A ship with a reinforced hull could possibly make it intact through the passage. But if it got stuck, it would cost thousands of dollars for an icebreaker like the Amundsen to come to the rescue. So even if the Northwest Passage is less ice-choked than before, the route may not become a shipping short-cut in the near future, as some have predicted.
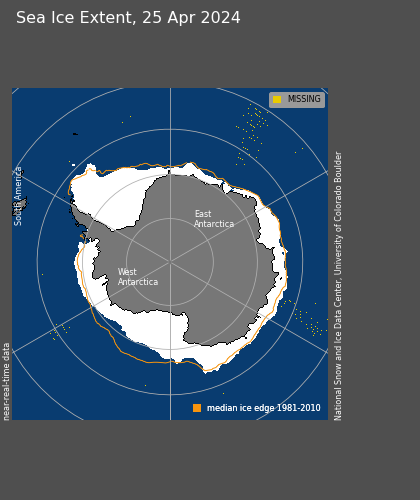
The South Pole will almost certainly set a record for most sea ice this season. It is almost there, and there are still several months of growth remaining.
")
http://www.iup.uni-bremen.de:8084/amsr/ice_ext_s.png

http://nsidc.org/data/seaice_index/images/daily_images/S_daily_extent.png
As seen below, the symmetry between the North and South Pole is impressive through the satellite record. They always seem to move opposite each other and produce an approximately constant amount of sea ice. It would be nice if the experts focused on solving this relationship rather than making up forced explanations like the “Ozone Hole” – which has just started forming for the year and will be gone before Christmas.

UIUC North/south anomalies overlaid on top of each other.
http://arctic.atmos.uiuc.edu/cryosphere/IMAGES/seaice.anomaly.arctic.png
http://arctic.atmos.uiuc.edu/cryosphere/IMAGES/seaice.anomaly.antarctic.png
(Note to posters and ice experts. Before you embarrass yourself making comments about how seasons are out phase at opposite poles, remember that this is normalised data and the period is in excess of 30 years.)
Conclusions:
The “long term trend” (30 years) in Arctic ice continues to be downwards, and would be even if the ice minimum was a record high this summer. But the three year trend shows strong growth of extent, thickness and age. Meanwhile, Antarctic ice is blowing away the record books. Yet the press continues to spread massive disinformation about the state of ice at both poles. Who could possibly be responsible for that?
Sponsored IT training links:
Get COG-112 materials along with 352-001 dumps to practice and pass 000-977 exam in timely and cost saving manners.
Julienne,
Thanks for attempting to guide me through the DMI maze yesterday. I’m afraid I have neither the time nor the background to plow through all the links, etc., and figure out whether a) temps are warmer than average in the Arctic this summer as you claim from your data, or b) they are colder than ever in the Arctic this summer as illustrated on the DMI graphs. (I also doubt that even someone with the requisite background could actually settle the issue, but that’s beside the point.)
I’m agnostic on the issue of this summer’s arctic temps, except that it is one more item added to the pile that convinces me that reliability of data in this field is exceptionally poor. I do, however, tend to place more weight on the DMI data (presently) for the simple reason that they have devoted effort to maintaining a specific long-term record of temps north of 80 degrees, whereas you apparently used your database yesterday to “check” their claims and now disagree with them. I hope you can see how I might be more inclined to trust the data promulgated over a sustained period over that of a one-time computer run and reported on a blog. That doesn’t mean I think your result is wrong; only that right now I tend to place more weight on the DMI charts, though less than I would have two weeks ago. Also, this is from my perspective only; you might have a similar long-term record that’s been examined daily, but that I’m unaware of so far. (The reason I put some emphasis on a daily examination as the record is accumulated is because that enables errors to be more readily detected during the initial data collection and analysis, in my opinion.)
Messy business, this temperature recording. I suspect the general public would be quite surprised to find out just how messy. I know I have been.
Again, thanks for trying to help me out. I do have a better grasp of the situation now, though it’s still quite confusing overall.
Rod
Black Flag says:
August 19, 2010 at 6:29 am
mecago,
Here is another saying for you:
“We have no right to inflict our solutions upon the problems that our kids have not yet experienced or have”.
In other words, acting now for a problem that does not exist will most definitely create far worse problems for the future.
I am very confident that our children will be able to deal with their lives and their issues without our dabbling in pretense that we actually know what is going on.
The children of tomorrow will use their ancestors graves for latrines.
Yours is the pretense of knowledge, or in your case anti-knowledge. You cannot even sense the contradiction of your faux wisdom.
If it is, as you stated, “. . . pretense that we actually know what is going on.” then how can WE deal with our own “lives and issues” today?
Furthermore, how can your children deal with their own lives and issues if they, like us by your description, are “dabbling in pretense that [they] actually know what is going on.”?
Do you presume that they will have a wisdom that YOU don’t have?
Rod Everson says:
August 19, 2010 at 8:25 am
“The high priests of the AGW cult have declared these pearls of wisdom sacred. Let not the unwashed masses examine them too closely or they will trample upon our divined data and tear our arguments to pieces.”
I can see why Matthew 7:6 could be making the rounds in the AGW community. It fairly accurately describes both their attitude and their actions toward those holding dissenting views. Ah, Climategate, a door that, once opened, cannot be closed.
There has been no such declaration by “The high priests of the AGW cult”.
[snip]
Matthew 7:6 is not making the rounds of the AGW community so far as I know. But then I can see why you would imagine it is. You don’t have the independence of mind to come up with something on your own so you project that inability upon others.
[snip]
And finally, a door has been opened that cannot be closed. It’s called a “tipping point” and I’m referring to the meltdown of the Arctic Ice Cap and its subsequent effects.
mecago,
To make such as statement must mean you do know, for fact, the causation and consequence of current human action on the climate.
This would put you far above everyone on Earth.
And you have the gall to claim I have “faux” wisdom!
WE deal with it the best we can.
To use this as a claim that we should be dealing with issues that do not exist in the future for our children is irrational.
Because (wait for it), it is their own lives! … and not “mine” to determine for them.
I have infinite faith in our children to do the best they can in THEIR future.
MY dabbling is unnecessary in every way.
Absolutely!
Or do you believe you are much more ignorant than your parents and grandparents?
Günther Kirschbaum says:
August 19, 2010 at 6:26 am
I thought air temperatures didn’t matter much for ice melt and water temps dominated? If that’s the case, why do air temperatures (and your entire argument) matter? Given the strong El Nino this year, I’d say that topping 5e6 km^2 is pretty decent, especially seeing as we’re supposed to be in a death spiral.
-Scott
Well I have to admit, the mecago ‘Repent, you ignorant heathens!’ show does have noticeable entertainment value.
🙂
The final days of the 2010 melt season are here and the horse race is on.
2010 is the 9th year in the JAXA record. How will it place?
Today 2010 has the 2004 and 2006 minimums beat. Let’s look at the standing.
2003 Min.: 6,041,250: Beat on 8/14/10
2004 Min.: 5,784,688: Beat Today!
2006: Min.: 5,781,719: Beat Today!
This puts 2010 in 6th place in the JAXA record.
Next up is 2002 at 5,646,875. After that 2010 will have a long way to go to beat the Goddard Minimum at 5.5 Million K^2.
From: Jeff P on August 20, 2010 at 9:42 am
Actually, 2002 was a partial year, data starts in June. Thus in general terms you could say 8 years (eight twelve-month periods) have already been completed with the 9th year underway, otherwise the end of December will mark the 8th full year in the record.
Goddard wrote :
“My forecast (dashed line below) minimum of 5.5 million (JAXA) continues to look conservative.”
Since 5.5 million km^2 would be below the 2009 minimum, I wonder if Goddard needs to pick a bone with Anthony, who predicted early this year that the 2010 summer ice extend would recover over previous years.
Either way, sonsidering that Goddard’s prediction of 5.5 million km^2 minimum is very close to record miminmum, I find the repeated use of “recovery” in sea ice extent and ice volume here on wattsupwiththat rather misleading.
With JAXA 2010 ice extend minimum standing at 4813594 sq.km (set September 18), painfully close to being second smallest Arctic ice extend since recordings started 30 years ago.
That fact alone makes this post by Goddard irrelevant, barely a month after its conception.
Maybe next time when you claim “premature end of Arctic summer” or “my predictions of 5.5 million sq.km look conservative” or “2010 will see a ‘recovery’ of Arctic sea ice” you may want to add some disclaimers that you are just talking from pre-conceived beliefs that AGW is non-existing rather than scientific understanding.
I’m sure that your fans won’t mind if you would tell them the truth every now and then.