By Steve Goddard
Summer has come to a premature and frosty end at Santa’s workshop.
")
http://psc.apl.washington.edu/northpole/webphotos/noaa2.jpg
It has been the coldest summer on record north of 80N, and temperatures have dropped below freezing ahead of the average date.
")
The entire ice covered region is now below freezing.
")
http://www.esrl.noaa.gov/psd/map/images/fnl/sfctmp_01.fnl.gif
It also appears that the summer melt season will be the shortest on record. The maximum was reached very late in March, and it appears likely that we are headed for an early minimum.
")
Mark Serreze at NSIDC has stated :
As the climate warms, the summer melt season lengthens …”
He was also reported as saying :
Mark Serreze of the center forecast the ice decline this year (2010) would even break 2007’s record.
Another interesting fact is that we are almost certain to see a large increase in the amount of multi-year ice (MYI) next year. The reason being that almost all of the 1-2 year old ice (turquoise) in the NSIDC map below will become classified as MYI next spring.
")
We have seen a remarkably rapid recovery from the 2008 low volume.
PIOMAS continues to report record low volumes of ice, despite all evidence to the contrary. The image below shows in red how far off the mark their August 15 forecast was. Their modeling error will get much worse over the next two weeks – because they model much of the thick multi-year ice in the Beaufort Sea and Arctic Basin as only a few tens of centimetres thick.

With the cold temperatures, ice area loss has almost stopped.

http://arctic-roos.org/observations/satellite-data/sea-ice/observation_images/ssmi1_ice_area.png
However, ice extent continues to drop – because the Arctic Oscillation has turned negative and winds are compacting the ice towards the pole. This bodes well for continued growth of ice in 2011.
")
http://www.ijis.iarc.uaf.edu/seaice/extent/AMSRE_Sea_Ice_Extent.png
PIPS shows average ice thickness increasing, due to the compression of the ice.
")
There has not been a lot of ice loss during August. The modified NSIDC image below shows in red, areas that have lost ice since August 1. Note that the Greenland Sea appears to have lost ice. This is due to the fact that there has been very little transport out of the Arctic Basin through the Fram Strait, which again bodes well for ice gain in 2011.

The modified NSIDC image below shows ice gain since 2007.

NSIDC maps continue to show more gain (16%) than their graphs (10%.) I have not been able to get a satisfactory explanation from them about the cause of that discrepancy. DMI shows a 25% gain in 30% concentration ice over 2007.
My forecast (dashed line below) minimum of 5.5 million (JAXA) continues to look conservative. It all comes down to what the winds do over the next few weeks. If the winds keep compressing the ice, the minimum may go a little below 5.5. If the winds quiesce, the minimum may come in a little above 5.5 – which is looking like a pretty good number right now. Some people at NSIDC started out with a 5.5 forecast this year, but seem to have backed away from it since.

Academic theories about the Northwest Passage becoming a commercial shipping opportunity appear pretty clueless.
“The plans that you make can change completely,” he says. This uncertainty, delay, liability, increased insurance and other costs of using the Northwest Passage are likely to deter commercial shipping here. A ship with a reinforced hull could possibly make it intact through the passage. But if it got stuck, it would cost thousands of dollars for an icebreaker like the Amundsen to come to the rescue. So even if the Northwest Passage is less ice-choked than before, the route may not become a shipping short-cut in the near future, as some have predicted.
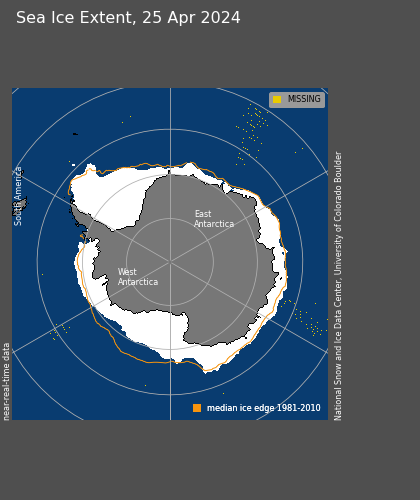
The South Pole will almost certainly set a record for most sea ice this season. It is almost there, and there are still several months of growth remaining.
")
http://www.iup.uni-bremen.de:8084/amsr/ice_ext_s.png

http://nsidc.org/data/seaice_index/images/daily_images/S_daily_extent.png
As seen below, the symmetry between the North and South Pole is impressive through the satellite record. They always seem to move opposite each other and produce an approximately constant amount of sea ice. It would be nice if the experts focused on solving this relationship rather than making up forced explanations like the “Ozone Hole” – which has just started forming for the year and will be gone before Christmas.

UIUC North/south anomalies overlaid on top of each other.
http://arctic.atmos.uiuc.edu/cryosphere/IMAGES/seaice.anomaly.arctic.png
http://arctic.atmos.uiuc.edu/cryosphere/IMAGES/seaice.anomaly.antarctic.png
(Note to posters and ice experts. Before you embarrass yourself making comments about how seasons are out phase at opposite poles, remember that this is normalised data and the period is in excess of 30 years.)
Conclusions:
The “long term trend” (30 years) in Arctic ice continues to be downwards, and would be even if the ice minimum was a record high this summer. But the three year trend shows strong growth of extent, thickness and age. Meanwhile, Antarctic ice is blowing away the record books. Yet the press continues to spread massive disinformation about the state of ice at both poles. Who could possibly be responsible for that?
Sponsored IT training links:
Get COG-112 materials along with 352-001 dumps to practice and pass 000-977 exam in timely and cost saving manners.
stevengoddard says:
August 16, 2010 at 4:44 pm
“Yes, I’ve noticed that tamino has cut back on his censorship recently too.”
I disagree he may let one comment through, which he will reply with a bunch of inline BS and allow for no further comment. Tamino is a CSP, I have met many in my life.
R. Gates says:
August 15, 2010 at 9:26 am
You may have (perhaps accidentally) done the ultimate cherry-pick here, as the JAXA numbers (km^2) for 08/15 are:
2008 = 5983125
2010 = 5981406
Just a hair’s difference, and considering that 2008 lost on average 21029 km^2 more per day over 2010 during the last 12 days (i.e. – greater than 250000 km^2 total), I imagine 08/15 may have been the LAST day of the melt season were 2008 had a higher extent than 2010.
So to be lower than 2008 will take tying the record high loss between now and the minimum, but this is a “real race” versus beating 2005 and 2009, where if it follows the 2006 track it will beat these by 85000 and 150000 km^2, respectively? Sorry, don’t buy it…there’s a good chance of finishing between 2008 and 2009, but there seems to be a much higher probability of topping 2009 and even 2005 than going below 2008, so I’ll consider topping 2009 the “real race”.
Last spring I thought you indicated only the minimum mattered because the “narrows” during the summer (and before) didn’t matter much. Has this changed?
-Scott
David W says:
August 16, 2010 at 3:31 pm
To see this visually, here’s the graph. (Sorry for the poor resolution—Open Office decided to start hicupping.)
http://img807.imageshack.us/img807/3873/meltonset.jpg
The r^2 value for the entire period is 0.2.
mecago says:
August 16, 2010 at 3:43 pm
Smokey says:
August 16, 2010 at 1:16 pm
mecago says:
“The selective amnesia and mockery is self evident on this thread and the site itself.”
All of that gets corrected. Why? Because comments like yours are allowed here, even encouraged. But alarmist blogs are so frightened of the truth that they delete it before their readers are contaminated by it.
Please go tell your pals at realclimate that their tiny little echo chamber fails because of their policy of censoring comments that do not fit within their catastrophic global warming agenda.
I have been to http://www.realclimate.org and seen your fellows comment there. ”
As someone who has seen a number of rational posts at Real Climate vanish without a trace I have to call you on this one Mecago.
The modus operandi of real climate is to let an initial anti-AGW post in which will then be countered with a flawed response from one of their plebs. They then selectively censor your follow up post dependent upon whether they think they can pick flaws in it or your presenting a solid, hard to rebut, position. From that point they will only let flawed responses through so they can point out how unsound the anti-AGW position is.
Unless you are a rabid AGW convert, it is very clear that Real Climate has no interest in real debate. They’re a bit like a radio shock jock that will cut the caller off as soon as the caller says something they dont want to hear.
Their highly misleading censorship approach is one of the early things that actually made me become more open minded about climate issues having previous been very much pro-AGW.
Günther Kirschbaum says:
August 16, 2010 at 4:06 pm
If it sets up to be the Dipole Anomaly, then I would expect more compression towards the pole. The ice divergence under the central Arctic low pressure helped to spread the ice out and likely thin it further from lateral and basal melting, so that would certainly make the ice easier to compact as it’s compressed poleward. NSIDC’s extent is currently just below 6 million sq-km, and the rate of ice loss for August thus far has been about average. A dipole pattern could certainly lead to enhanced ice retreat depending on how strong the pressure gradients set up and exactly where the highs and lows are located. You will likely also get more advection of heat into the Arctic under this SLP pattern.
Norm in Calgary says:
August 15, 2010 at 11:16 am
How can they keep showing the Arctic on fire (Temperature wise) while the Arctic temperatures are well below normal all summer?
______________________________________
Like this – CLICK
Ralph says:
August 15, 2010 at 11:32 am
This is Tom Wagner from NASA telling us that Greenland is warming at 3.5 degrees per decade. (presumably oF, not oC)….
________________________________
This graph puts the temperature in perspective:
Greenland for 10,000 yrs: http://4.bp.blogspot.com/_cHhMa7ARDDg/SsZbFvC5SJI/AAAAAAAABLY/uZxh6g17bmE/s1600-h/GISP2_10Ke.jpg
This paper, Temperature and precipitation history of the Arctic states:
“..Solar energy reached a summer maximum (9% higher than at present) ca 11 ka ago and has been decreasing since then, primarily in response to the precession of the equinoxes. The extra energy elevated early Holocene summer temperatures throughout the Arctic 1-3° C above 20th century averages, enough to completely melt many small glaciers throughout the Arctic, although the Greenland Ice Sheet was only slightly smaller than at present… As summer solar energy decreased in the second half of the Holocene, glaciers reestablished or advanced, sea ice expanded, and the flow of warm Atlantic water into the Arctic Ocean diminished. Late Holocene cooling reached its nadir during the Little Ice Age (about 1250-1850 AD), when sun-blocking volcanic eruptions and perhaps other causes added to the orbital cooling, allowing most Arctic glaciers to reach their maximum Holocene extent…”
The starting point sure make a difference doesn’t it? If you start at the end of the last Ice Age we are cooling by about 2-3C, if you start at the end of the Little Ice Age we are warming by 2C.
Richard says:
August 15, 2010 at 12:57 pm
Evidence is king. Did any ships make it/ are there any trying to make it, through the NW Passage?
___________________________________________
It sounds like that Icebreaker is crunching its way through the NW Passage so that makes comparisons apples and oranges. I do not consider the passage “open” if an Icebreaker is slamming its way through or other ships follow in its wake.
http://www.nunatsiaqonline.ca/stories/article/100810_Northwest_Passage_still_hard_to_navigate/
stevengoddard said August 16, 2010 at 4:44 pm:
Perhaps he needs the time to work on an album.
🙂
Walt Meier says:
August 15, 2010 at 5:43 pm
(especially in a changing climate)…… However, as for the long-term forecast, things are clearer – we will lose the summer sea ice as temperatures warm. It’s a matter of if not when….
________________________________________________
Dr Meier have you bothered to read these papers plus the NASA and Woods Hole Oceanographic Institution articles??? The certainly seem to cast doubt on what you are saying.
Temperature and precipitation history of the Arctic
“…Solar energy reached a summer maximum (9% higher than at present) ca 11 ka ago and has been decreasing since then, primarily in response to the precession of the equinoxes. The extra energy elevated early Holocene summer temperatures throughout the Arctic 1-3° C above 20th century averages…..”
Lesson from the past: present insolation minimum holds potential for glacial inception (2007)
“Because the intensities of the 397 ka BP and present insolation minima are very similar, we conclude that under natural boundary conditions the present insolation minimum holds the potential to terminate the Holocene interglacial. Our findings support the Ruddiman hypothesis [Ruddiman, W., 2003. The Anthropogenic Greenhouse Era began thousands of years ago. Climate Change 61, 261–293], which proposes that early anthropogenic greenhouse gas emission prevented the inception of a glacial that would otherwise already have started….”
Solar activity reaches new high – Dec 2, 2003
” Geophysicists in Finland and Germany have calculated that the Sun is more magnetically active now than it has been for over a 1000 years. Ilya Usoskin and colleagues at the University of Oulu and the Max-Planck Institute for Aeronomy say that their technique – which relies on a radioactive dating technique – is the first direct quantitative reconstruction of solar activity based on physical, rather than statistical, models (I G Usoskin et al. 2003 Phys. Rev. Lett. 91 211101)
… the Finnish team was able to extend data on solar activity back to 850 AD. The researchers found that there has been a sharp increase in the number of sunspots since the beginning of the 20th century. They calculated that the average number was about 30 per year between 850 and 1900, and then increased to 60 between 1900 and 1944, and is now at its highest ever value of 76….”
Solar Cycle 24 is not following the pattern of high activity according to the Solar Dynamics Observatory Mission News
“We want to compare the sun’s brightness now to its brightness during previous minima and ask: is the sun getting brighter or dimmer?”
The answer seems to be dimmer. Measurements by a variety of spacecraft indicate a 12-year lessening of the sun’s “irradiance” by about 0.02% at visible wavelengths and 6% at EUV wavelengths.”
Woods Hole Oceanographic Institution gives a warning about the myopic view of most climate scientists Abrupt Climate Change: Should We Be Worried?
“Most of the studies and debates on potential climate change, along with its ecological and economic impacts, have focused on the ongoing buildup of industrial greenhouse gases in the atmosphere and a gradual increase in global temperatures. This line of thinking, however, fails to consider another potentially disruptive climate scenario. It ignores recent and rapidly advancing evidence that Earth’s climate repeatedly has shifted abruptly and dramatically in the past, and is capable of doing so in the future.
Fossil evidence clearly demonstrates that Earth vs climate can shift gears within a decade….
But the concept remains little known and scarcely appreciated in the wider community of scientists, economists, policy makers, and world political and business leaders. Thus, world leaders may be planning for climate scenarios of global warming that are opposite to what might actually occur…“
I am trying to make sense of the atmospheric temperature anomalies reported by the NCEP Climate Data Assimilation System (CDAS) over Antarctica:
http://www.cpc.noaa.gov/products/intraseasonal/temp10anim.shtml
http://www.cpc.noaa.gov/products/intraseasonal/temp30anim.shtml
http://www.cpc.noaa.gov/products/intraseasonal/temp50anim.shtml
Is the large positive anomaly over Antarctica indicative of what occurs when the Antarctic polar vortex breaks down;
http://www.cpc.noaa.gov/products/intraseasonal/z500_sh_anim.shtml
and non-polar air penetrates? Is a portion of the anomaly associated with latent heat being released due to rapid and expansive sea ice formation? Is there another atmospheric temperature data set that these anomalies can be compared to in order to assess their accuracy?
Thanks a lot, Julienne.
If it sets up to be the Dipole Anomaly
At what point can one say: OK, the DA has set up? Or can you only do that in hindcast? To my amateur eyes it looks like the DA has set up since a few days, with PIPS ice displacement arrows finally pointing towards the right and ECMWF forecasting things to stay like this for at least a few more days.
Günther
As mentioned in the article, I agree. I expect to see a significant decrease in extent over the next week – because of winds compressing the ice towards the pole.
Frank K. says:
August 15, 2010 at 5:48 pm
Julienne says:
August 15, 2010 at 1:41 pm
Frank K. says:
August 15, 2010 at 11:23 am
Frank, no one at NSIDC has ever predicted a seasonally ice-free Arctic by 2012. That prediction was made by a scientist at the Naval Postgraduate School.
–
Fair enough, Julienne, but the article I linked to states:
“The Centre has been predicting that the Arctic Ocean could be virtually ice-free by 2012 but that point may be reached within months rather than years.”
The Centre = NSIDC.
Was the Telegraph wrong? If so, I hope a request for a correction was submitted by the NSIDC…
XXXXXXXXXXXXXXXXXXXXXXXXXXXXXXXXXXXX
One of the most absurd things I have heard from this site, and several times at that, is how we are responsible for Media falsifications. You know damn well that the Telegraph, an anti-AGW/right wing newspaper will write whatsoever it damn well pleases.
You display the same type of mentality as those who blame the victim of rape for her assault.
Besides, if you are really aware of what the other side is saying you would know damn well what they are really saying instead of relying on secondary sources. As I have already stated, 2020-2030 is what Climatologists are predicting, with some still clinging to later dates.
That is such a ridiculously easy fact to verify. That you continue to speak as if it where otherwise is an indication of bad faith. You obviously wish to continue pretending that you believe those pathological liars at the Telegraph just to have a lame and false argument.
If you really don’t know the target date which the majority of Climatologists are predicting a summertime ice free Arctic then you should have the humility not to speak on the issue at all.
Steve Goddard
Can you point me to links to easily readable formats for daily NH and SH sea ice extent (or area, or a reliable index would also do). csv or text files would be ideal.
NH data is fairly easy to get hold of, but SH is quite another matter.
I’d quite like to assess the question of correlation for myself.
mecago, you sound like a total lunatic. If you honestly think we’ll have an ice free arctic between 2020-2030, you are completely deluding yourself. You are exactly the type of poster that gives “AGW Almarists” a bad name.
Its almost laughable you think it’s a “ridiculously easy fact to verify” that it will ice free in 2020-2030….for one its not a fact at all since it hasn’t happened yet. Two, we would need an absolutely unprecedented decline in arctic sea ice sometime between now and then to even think about that occurring, something that would make 2007 look like a fly compared to a moose.
Your post is a complete joke and has zero scientific evidence to it. Where is this “Ridiculously easy to verify” evidence? Good luck coming up with a reasonable explanation.
Jordan,
Binary ice data for the northern and southern hemispheres are here ftp://sidads.colorado.edu/pub/DATASETS/seaice/polar-stereo/nasateam/ Recent data are in near-real-time, and historic data are in final-gsfc.
stevengoddard says:
August 16, 2010 at 3:52 pm
Matt
Today’s pixel count is :
27041 – 2007/2010 concurrent
6050 – 2010 only
1168 – 2007 only
That shows a 17% gain over 2007.
Steve – couple points:
1) How are you calculating the 17%?
If I understand it right, 27041 is the ‘OR’ area of 2007 and 2010. 6050 is what appears in 2010 only (the green in your maps), and 1168 is the 2007 only (the red in your maps). So from these numbers, we can determine the following:
2007 total area — 27041 – 6050 = 20991
2010 total area — 27041 – 1168 = 25873
So calculating a % difference:
(25783-20991)/((25783+20991)/2) = .208 or 21%
Or % error:
(25783-20991)/20991 = 23%
2) Considering the total amount of ice area pixels in the raw data has been less than 10k since the beginning of August, your pixel counts seem high. I’m not sure what source you’re using for your image, but if your total pixel area is in the neighborhood of 20k pixels, I suspect that somewhere in the data->image->data pipeline theres some subsampling going on. Depending how the subsampling is done, this could easily bias your results high or low.
Found another nice article in the UK Telegraph:
http://www.telegraph.co.uk/earth/earthnews/5116352/Arctic-will-be-ice-free-within-a-decade.html
How strange, around here when observational records, including anecdotal and photographic evidence, are presented that show the Arctic area had less ice within the last century, it gets discredited as unreliable and unbelievable and it is stressed only the satellite records are trustworthy. But such observational records can show the current levels are lower than they have been for at least a century, something scientists are confident of.
The South Pole is melting due to climate change? Those ice bridges just stayed in place indefinitely until
anthropogenic global warmingclimate change began?Well, at least Dr. Meier has noticed the climate models just don’t get it right.
😉
From: stevengoddard on August 16, 2010 at 3:52 pm
Therefore,
2007: 27041+1168=28,209
2010: 27041+6050=33,091
2010/2007 is 33091/28209 = 1.1731
Thus 2010 is 117% of 2007, aka a 17% gain.
And I have no idea just what the heck Matt is trying to show.
Kadaka,
Ah, gotcha – it works if the 27041 number is the ‘AND’ value between the two years. The wording Steve used wasnt clear.
The DMI ice graph (http://ocean.dmi.dk/arctic/icecover.uk.php ) dropped sharply today, bringing it down to 2009 levels. My hunch is that we won’t see 2005 levels this year, more likely 2009 levels or perhaps slightly below that (but I would be surprised to see 2008 levels or lower).
Meanwhile, it’s raining today and summer seems like already gone here at 60 N 🙁
Thrasher says:
August 17, 2010 at 12:18 am
mecago, you sound like a total lunatic. If you honestly think we’ll have an ice free arctic between 2020-2030, you are completely deluding yourself. You are exactly the type of poster that gives “AGW Almarists” a bad name.
Its almost laughable you think it’s a “ridiculously easy fact to verify” that it will ice free in 2020-2030…[–SNIP–]
XXXXXXXXXXXXXXXXXXXXXXX
Thrasher, I don’t know what time zone you’re in but you could use a caffeinated brew of some form or another.
You should first read the WHOLE post and then go back to the original post a person is responding to in order to pick up on the context of the discussion.
http://wattsupwiththat.com/2010/08/15/sea-ice-news-18/#comment-459188
I was responding to Frank’s statement directed to Julienne where he was trying to lay blame for a Telegraph article misquotation on the NSIDC. It seems that he and others want to claim that AGW’s are predicting 2012 (or 2013) as the date for “Summertime ice free Arctic [for a few days initially]”.
The above sounds like a distortion of a prediction made by ONE single gentleman, by the name of Maslowski, who made a prediction that went something like “%70 possibility of ice free Arctic, in the summer, from 2013-2015.”
Maslowski’s, or any other similar prediction is IRRELEVANT because, as I already have stated several times in the past (to no avail), virtually all Climatologists are saying 2020-2030 for that precisely defined occurrence.
So, read my lips. The emphasis of my complaint was that Climatologists are being misrepresented by having things put in their mouths that they never said.
As for what I believe, I do go along with the following precisely worded predictions I already stated, namely that:
“By the year 2020-30 we will have, with the exception of a thin band of ice hugging the Northern Canadian Arctic Islands, the following conditions in the Arctic Sea will occur: It will be seasonally ice free in the Summer. This ice free state will initially last for a few days and then progress to weeks, then months in subsequent years.”
I recall hearing a Naval official say that he expected to see the Arctic Sea open for 4 weeks by 2035. Below is an article from the Naval “Stars and Stripes” web site. Of course if it will make you feel better to call the Navy (Hmmm, what is it that you called me?) “total lunatics” be my guest. I’m sure that one of your “rational”; “level headed”; none dare call him “Total Lunatic” leaders like His Lordship, would calmly and sanely deduce that the Navy has been infiltrated with Fascistic Vegetarian Lesbians.
http://www.stripes.com/news/navy-s-role-in-the-arctic-may-change-as-icy-lanes-clear-up-1.94368
In the link below I give the example of a high powered consulting group such as Global Business Network, a member of the Monitor Group, that incorporates such predictions of an ice free Arctic into their business scenarios. (Another sneaky Communist plot this must be!)
http://arctic-council.org/filearchive/AMSA%20Scenarios%20of%20the%20Future%20-%20%20Narratives%20Report.pdf
In conclusion, Thrasher, you should do some research on what is being said outside of your community.
Espen
As I mentioned in the article, there have been strong winds from the south compressing the ice over the last few days. This will probably go on for three more days. NCEP forecasts a return to cold temperatures later in the week.
[youtube=http://www.youtube.com/watch?v=Uc4pJ-6fdDM]
Just why is the United States of America federal government spending money on this useless data? It is in the same category of spending millions of taxpayers money (borrowed from China) to predict the number of hurricanes very year.