By Steven Goddard,
")
http://ocean.dmi.dk/arctic/meant80n.uk.php
Summer is rapidly winding down in the Arctic, and (based on DMI graphs) the region north of 80N appears set to finish the summer as the coldest on record. So far, there have only been a small handful of days which made it up to normal temperatures. The Arctic is one of many places described by climate scientists as “the fastest warming place on earth.”
Ice melt during July was the slowest in the JAXA record.

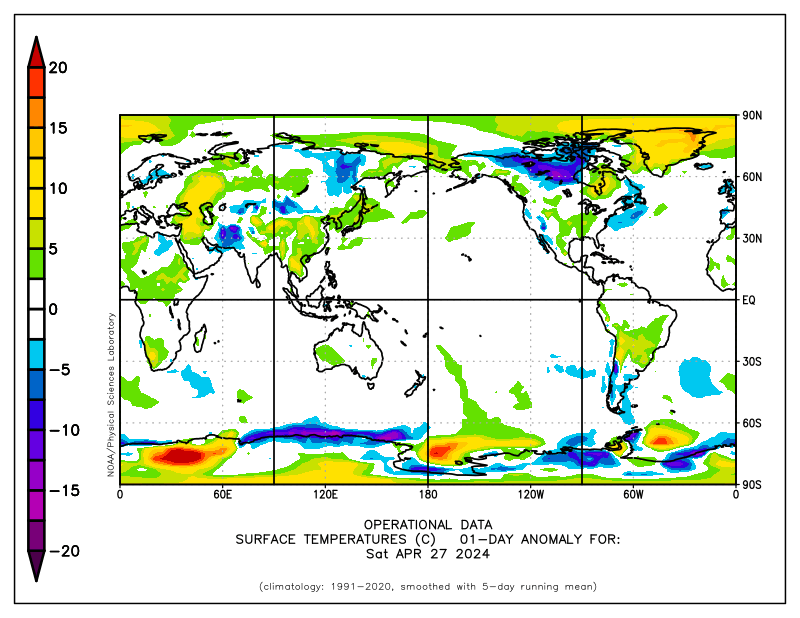
NCEP is forecasting below freezing temperatures for the next two weeks across much of the Arctic.

http://wxmaps.org/pix/temp2.html
Solar energy received in the Arctic is in rapid decline, as the sun drops towards the horizon.

http://earthobservatory.nasa.gov/Features/EnergyBalance/page3.php
As we forecast two weeks ago, PIPS average ice thickness has bottomed out between 2006 and 2009.
")
Ice thickness has increased by 25% since 2008, indicating that PIOMAS claims of record low volume are probably incorrect. PIOMAS models are often used as a “data” source by global warming activists as evidence that the Arctic is in a “death spiral.”

Below are the PIOMAS forecasts for the rest of summer. PIOMAS is expecting a big melt in August, because they believe that the ice is very thin.

Next week we will start visual comparisons of actual extent vs. PIOMAS forecasts.
Ice extent is tracking below 2006 and above 2009, just as the PIPS thickness data has indicated all summer. Evidence so far points towards PIPS being a very reliable data source.
")
http://ocean.dmi.dk/arctic/icecover.uk.php
The modified NSIDC image below shows how 2010 has diverged from 2007. Green areas have more ice than 2007, and red shows the opposite.

The modified NSIDC image below shows ice loss over the last week in red. As predicted in last week’s Sea Ice News #15, there has been substantial loss in the East Siberian and Chukchi Seas. Based on NCEP weather forecasts, this will continue for at least one more week.

The next modified NSIDC image below shows the differences between current Arctic ice and September, 2006. Areas in green indicate how far the ice will have to melt back to exceed the 2006 minimum. Areas in red show where ice loss has already exceeded the 2006 minimum.

Our PIPS based forecast of 5.5 million km² continues to be right on track.
Meanwhile down south, Antarctic ice continues near record highs.
")
http://nsidc.org/data/seaice_index/images/daily_images/S_stddev_timeseries.png
There has been much press this year about a “record polar melt” in the works. This information is incorrect, but it is seems extremely unlikely that the scientists behind those reports will make much of an effort to set the record straight.
The Arctic Oscillation is forecast to turn negative again, hinting at cooler weather in the Northern Hemisphere starting in about a week.

Much of Russia, Siberia and the former Soviet Republics are already seeing well below normal temperatures, but this is (of course) not being reported by the press.

http://www.esrl.noaa.gov/psd/map/ANIM/sfctmpmer_01a.fnl.30.gif
kadaka (KD Knoebel) says:
August 2, 2010 at 8:32 pm
Which clearly shows most of the Arctic basin is at least MINUS 1.5°C and colder. Good luck getting lots of sea ice melt at those “warm” sea surface temperatures.
_____________________________________________________________
And what is the melting point of sea ice?
Or conversely. what is the freezing point of seawater?
“Sea ice is largely formed from seawater that freezes. Because the oceans consist of salt water, this occurs below the freezing point of pure water, at about -1.8 °C (28.8 °F).”
http://en.wikipedia.org/wiki/Sea_ice
“The freezing point of sea water decreases with increasing salinity and is about −2 °C (28.4 °F) at 35 g/L (equivalent to 599 mM). The coldest sea water ever was discovered in a stream under a glacier in the Antarctic in 2010 and measured −2.6 °C (27 °F).”
http://en.wikipedia.org/wiki/Seawater
Methinks “lots of sea ice melt at those “warm” sea surface temperatures” will indeed occur, until oh, sometime in the middle of September. D’oh!
savethesharks says:
August 2, 2010 at 8:36 pm
R. Gates says:
August 2, 2010 at 2:14 pm
savethesharks says:
August 2, 2010 at 1:04 pm
Fuzzylogic19 says:
August 1, 2010 at 11:55 pm
savethesharks says:
August 1, 2010 at 10:59 pm
What fuzzylogic19 and RGates and many others can not seem to comprehend…(or don’t want to comprehend)….in regards to 30 years of satellite measurement of ice:
How many 30 year periods does it take to get 4.6 billion?
4.6 Billion / 30 = 153,000,000
***
And the relevance?
=====================================
Figure it out yourself.
***
Help!
The surface of the ice is snow/fresh water and melts at 0C
A couple of comments above about ocean temperatures below the sea ice.
Here is an Arctic Ocean basin cross-section of temperatures down to the 4000M bottom for August produced by the US navy.
The temps will be close to -2.0C at the surface – there is a warmer layer from 300 metres to 1000 metres which will be around +0.5C to 0.0C and then lower, the temperatures are about -0.5C to about -0.8C. [There is a slight seasonal change so that it is a little cooler in the winter months].
http://a.imageshack.us/img62/7945/arcticdeepoceantemp.gif
Antarctica is similar to this cross-section with the coolest water in the Weddel Sea.
Amino Acids in Meteorites says:
August 2, 2010 at 9:48 pm
R. Gates says:
August 2, 2010 at 9:19 pm
Amino Acids in Meteorites says:
August 2, 2010 at 8:09 pm
I think it’s clear Arctic ice is not in a death spiral. Everyone can agree. 😉
____________
Thanks for the comic relief.
——————————————————————–
I knew there would be a few that didn’t agree.
___________
I knew exactly what you meant…and that’s what made it so funny. Thank again for the chuckle! :))
Isn’t this the time of year when the Russian nuclear-powered Ice Breakers head off to do thier escort duty?
The Arctic is in no death spiral.
What you see is a heat-pump effect to transfer the precious ocean heat energy out to space. The Sea Ice is merely in the way…temporarily. When the oceans have nothing less to burp up, that is when the cold reality sets in.
Are we there yet?
rbateman says:
August 3, 2010 at 7:46 am
Isn’t this the time of year when the Russian nuclear-powered Ice Breakers head off to do thier escort duty?
The Arctic is in no death spiral.
What you see is a heat-pump effect to transfer the precious ocean heat energy out to space. The Sea Ice is merely in the way…temporarily. When the oceans have nothing less to burp up, that is when the cold reality sets in.
Are we there yet?
________________
Are we waiting for cold? Outside of the cyclical La Nina, don’t hold your breath. When the next El Nino rolls around in 2012-2013 on top of Solar Max from Cycle 24 increased irradiance, you’ll see some very warm temps…take that to the bank.
My current estimate for minimum Arctic sea ice extent (based off of 2003-2010 JAXA data) = 4.66E6 km^2 (standard deviation = 0.31E6 km^2).
Fuzzylogic19 says:
August 3, 2010 at 2:27 am
4.6 Billion / 30 = 153,000,000
***
And the relevance?
=====================================
Figure it out yourself.
***
Help!
————————-
Ok, I’ll bail you out. He’s pointing out the insignificance of a 30 year period compared to the age of the earth.
R. Gates says:
August 3, 2010 at 9:11 am
________________
Are we waiting for cold? Outside of the cyclical La Nina, don’t hold your breath. When the next El Nino rolls around in 2012-2013 on top of Solar Max from Cycle 24 increased irradiance, you’ll see some very warm temps…take that to the bank.
————————–
another prediction. With a smaller solar max likely for cycle 24 than 23 or 22, I wouldn’t bet the farm on it.
stevengoddard,
“WUWT has a great link which takes you to JAXA and the rest of the data.
http://wattsupwiththat.com/sea-ice-page/”
Your sea ice page also includes the DMI temperature and arctic sea ice extent graphs and the NSIDC Antarctic sea ice extent graph and yet somehow you saw fit to include them in this Sea Ice News even though none of them show the progress of the metric by which your 5.5 million sq km minimum (which I take it from your not correcting me on it you agree is a prediction for the IARC-JAXA minimum, not one of the other extent measures out there) will be judged. It’s as though you were in charge of auditing the way an annual budget was spent and you gave a monthly status report that only included expenditures to date in a separate appendix that people had to take the initiative to go look at after your presentation.
From: EFS_Junior on August 3, 2010 at 1:38 am
Said entry clearly states:
And with SST’s of -1.5°C and below, not only is most of the Arctic basin below where that largely fresh-water ice will melt, it’s possible there is new ice being formed right now. A temperature map with a resolution of 0.1°C, or at least 0.2°C, is indicated to confirm if new ice could be forming.
Well, at least it’s true your statement does have a Homer Simpson-ish quality to it. “D’oh!” indeed.
Got donuts?
Random
brain fartsmusings: “Donut” was “doughnut” which is a ring of dough which does not resemble any food item commonly known as a nut but does bear a passing resemblance to the mechanical fastener known as a nut due to the ring shape. Though it has been hypothesized that “doughnut” referred to what we now know as donut holes, although said holes likely existed before donuts as rings existed leading to the paradox where the holes existed before the item that was holed.Were pretzels almost known as doughknots? That could be confusing, having “donuts” and “donots” both exist.
Steve M. from TN says:
August 3, 2010 at 9:54 am
R. Gates says:
August 3, 2010 at 9:11 am
________________
Are we waiting for cold? Outside of the cyclical La Nina, don’t hold your breath. When the next El Nino rolls around in 2012-2013 on top of Solar Max from Cycle 24 increased irradiance, you’ll see some very warm temps…take that to the bank.
————————–
another prediction. With a smaller solar max likely for cycle 24 than 23 or 22, I wouldn’t bet the farm on it.
__________
Even with the long and deep solar minimum, we only saw global temps flatline, but not make any dramatic plunge. If you believe that CO2 is driving long term trends in AGW, then the smaller and short-lived cycles such as the solar cycles and ENSO are simply riding on top of this forcing, and any extra push we get from them pushes temps toward records, as we saw in the first half of 2010. Solar cycle 24 need not be robust to give an extra kick to temps, especially when added to an El Nino. A good review on the handy graphs found here: (click on sun in the left hand column)
http://www.climate4you.com/
Displays all of this quite nicely.
Amino Acids in Meteorites says:
August 1, 2010 at 9:50 pm
Julienne Stroeve says:
August 1, 2010 at 7:36 pm
======================================================
I’ll ask again if 1979-2000 is a fair baseline? 21 years of data is a short period to base any conclusions on, especially since the early part of that data set was affected by the cooling of 1945 to 1975. The only way to not see a rapid growing trend in Arctic ice is to compare it to a data set that is too short. What would be fairer is a data set that goes back to 800 A.D. But we don’t have that. So we cannot conclude anything alarming about Arctic ice. And really, we cannot conclude anything.
***
How does a period from 1945 to 1975 affect the baseline calculation of 1979 to 2000? There seems to be a four year gap during which sea ice extent was not even measured by satelite, which began mid 1979. Sea ice comes and goes, more than half melts in summer so how would you envisage by what means we could have sea ice measurements going back to 800 AD? It almost sounds like a lament. You cannot make something fairer by comparing with an impossible scenario. Can’t use a baseline for data over 21 years? A lot of people here use 24 hours.
Steve M. from TN says:
August 3, 2010 at 9:51 am
“Ok, I’ll bail you out. He’s pointing out the insignificance of a 30 year period compared to the age of the earth.”
***
Thanks for the help, however, that wasn’t too hard to figure out, hence I asked for relevance. He just looked back 4,599,999,970 years back, blissfully unaware that during that time the arctic may have been a continent and Antarctica an ocean, several times perhaps and a few snowball earths inbetween.
He said that it would have been more fair to have gone back to 800AD, which we can’t, so why say it to begin with. Wishful thinking using absurdity.
R. Gates says:
August 3, 2010 at 11:41 am
Displays all of this quite nicely.
_________________________
hmm, sorry, don’t see the correlation. 1998 el nino hit early in the solar cycle. And the drop (back to the same temperatures) after the peak of the el nino came at the peak of the solar cycle.