By Steve Goddard
July 4, 2010. Celebrating independence from traditional sources of polar ice news.
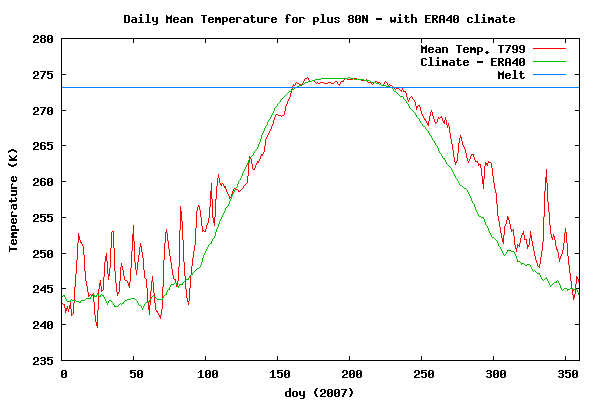
Last week we discussed the importance of wind in determining the summer minimum. In 2007, the winds blew consistently from the south and compacted the ice towards the North Pole. This led to a tremendous amount of news coverage claiming that the Arctic was heating and melting. In fact – the spring and summer of 2007 was slightly cooler than normal for about half of the melt period north of 80°N, according to DMI (below)

http://ocean.dmi.dk/arctic/plots/meanTarchive/meanT_2007.png
Around mid-June of this year, the winds in the Arctic set up in a similar pattern – spiraling inwards and pulling the ice away from the coast. This led to an early decline in ice extent inside the Arctic Basin.

Towards the end of June, this pattern reversed and now the winds are circulating counter clockwise – pushing the ice towards the coasts. As a result, there has been very little change in extent inside the Arctic Basin over the last week.

You can see the changes in extent in the modified NSIDC map below. Areas marked in red show extent loss since June 27, and green shows extent gain.

Most of the ice loss over the last week has been in the Hudson Bay, which nearly melted out a few days ago. As a result of the Hudson Bay being depleted of ice and the changes in wind, we have seen the JAXA and DMI graphs take a break in slope.

http://ocean.dmi.dk/arctic/icecover.uk.php

http://www.ijis.iarc.uaf.edu/seaice/extent/AMSRE_Sea_Ice_Extent.png
Since July 1, there has been almost no ice loss in the Arctic Basin, as seen in the modified NSIDC image below.

The video below shows the wind and ice patterns over the last two weeks, culminating in a strong counterclockwise flow.
The modified NSIDC image below show differences between 2010 and 2007. NSIDC still shows 2007 ahead of 2010, but the differences are mainly in the Hudson Bay and other areas that normally have little or no ice in September. In the Arctic interior 2010 has more ice (green.)

Last week I made the forecast below for the remainder of the summer.
The image below shows current JAXA in pink vs. my forecast. So far, the forecast is right on track.

Temperatures north of 80N have been running slightly below normal for several weeks. The summer melt season is nearly half over. There are less than 60 days remaining of possible melt in the high Arctic.
")
http://ocean.dmi.dk/arctic/meant80n.uk.php
Temperatures in Barrow have also been running below normal. It appears quite possible that the landfast ice breakup date at Point Barrow will beat the record for the latest ever (July 10.)
Meanwhile down south, as Anthony pointed out, Antarctic sea ice is at a record high for the date.
")
Global sea ice is close normal.

http://arctic.atmos.uiuc.edu/cryosphere/IMAGES/global.daily.ice.area.withtrend.jpg
So what do the experts tell us?
The North Pole has become an island for the first time in human history.
Leading ice expert says entire Arctic Ocean sea ice may be gone sometime between August 8th and September of this year. (H/T to Tom Moriarity.)
Hopefully Lewis Pugh is waxing up his kayak to take advantage of the clear paddling to the North Pole next month.
On this July 4th, we celebrate the freedom provided by the Internet to propagate the accurate information which governments apparently don’t want us to know.
Here is the current understanding of Arctic sea ice – the above post and:
2007 Arctic ice retreat due mostly to wind, currents
http://www.nasa.gov/vision/earth/lookingatearth/quikscat-20071001.html
NASA says at least 45% melting since 1976 is most probably due to aerosols (soot)
http://www.nasa.gov/topics/earth/features/warming_aerosols_prt.htm
Arctic ice thicker than expected In 2009
http://epic.awi.de/Publications/Haa2010b.pdf
http://earthobservatory.nasa.gov/Features/ArcticReflector/arctic_reflector2.php
“So in addition to changing sea ice, we can kind of guess that something must be happening in the atmosphere over the Arctic, too.” Clouds are bright, too, and an increase in clouds could cancel out the impact of melting snow and ice on polar albedo.”
http://earthobservatory.nasa.gov/Features/ArcticReflector/arctic_reflector4.php
“Although sea ice and snow cover had noticeably declined in the Arctic from 2000 to 2004, there had been no detectable change in the albedo measured at the top of the atmosphere: the proportion of light the Arctic reflected hadn’t changed. In other words, the ice albedo feedback that most climate models predict will ultimately amplify global warming apparently hadn’t yet kicked in.”
“According to the MODIS observations, cloud fraction had increased at a rate of 0.65 percent per year between 2000 and 2004. If the trend continues, it will amount to a relative increase of about 6.5 percent per decade. At least during this short time period, says Kato, increased cloudiness in the Arctic appears to have offset the expected decline in albedo from melting sea ice and snow.”
I hope I’ve cheered you up.
Marlene Anderson says:
July 4, 2010 at 12:33 pm
July 3 – snow overnight on the top of the Adam’s Plateau (melted before noon, but still). It’s the first time I’ve seen it since moving to the Shuswap Lake area of the south central BC interior. It’s been very cool this spring and early summer. Normally the strawberry season in this area is nearing it’s end and this year it hasn’t even hit peak yet. Everything is late. Just too cool for good growing.
…………………………………………………………………………………………………………………….
If La Nina does really start in earnest then you may also have a cold winter in B.C.
Here’s what a typical La Nina weather pattern looks like:
http://www.crh.noaa.gov/Image/gid/LaNina%282%29.png
So how do you know if a La Nina is happening?
Animation of equator:
http://www7320.nrlssc.navy.mil/GLBhycom1-12/navo/equpacsst_nowcast_anim30d.gif
Look at the equator in the animation starting at Ecuador, South America and heading toward Indonesia. Check the colors in the scale below the animation. Colors to the left in the scale are cooler, La Nina. Colors to the right of the scale are warmer, El Nino. It looks like La Nina.
p.s., I have a good friend from Kitimat.
Steve,
Every time I look at the sea ice on The Cryosphere Today to Compare Daily Sea Ice I am struck by how solid the ice is. Most of the Arctic sea is covered by 80% to 100% ice compared to the 60% to 80% for the 1980 default map. A time when we were coming out of the colder temperatures of the 1970’s. Here is the earliest map available, 1979, and there was still more open water in the arctic sea that there is today. Yes I know the extent of the ice was larger but it was more like “swiss cheese” than compared to now as another commenter put it.
stevengoddard says:
July 4, 2010 at 12:38 pm
R. Gates
The actual trend line is tracking slightly above mine. I am concerned that my forecast is too conservative, given the change in wind patterns.
You say 5.5. And I think you said Anthony said 5.8. You both are probably closer than anyone I know of—including PIOMAS. Maybe it will be 5.65. 😉
stevengoddard says:
July 4, 2010 at 2:31 pm
wayne
The JAXA and NSIDC definition of extent is is a grid cell with 15% of the area covered with ice. DMI uses 30%. So yes, all extent data already has this factored in.
That’s kind of what I thought. Now may I ask for a very particular question since you have been deep in this topic? And area is best the term, not extent, since extent implies some kind of boundary.
Do you know of any publically downloadable dataset that gives you the total sea ice area without some xx% cutoff involved. Seems to form a specified cutoff limit on the data, the entity that holds the original data must know the total sea ice to begin with. Have you ever found such a raw dataset? The answer might by simply ‘no’ or ‘none’ for I have not found one but have been looking.
stevengoddard says: ” .. expert predicting the demise of skiing in Scotland …. ”
http://www.worldsnowboardguide.com/news/story/20100621CairnGorm.cfm
” More than 60 people took to the slopes at CairnGorm Mountain on the summer solstice on Monday 21st June 2010 to enjoy some midsummer skiing on the snow still lying there in the Ptarmigan bowl. … Skiers had travelled from as far away as the Isle of Mull in order to be able to say that they had skied at midsummer at CairnGorm … This was the 147th day of skiing at CairnGorm since the season started on 28 November 2009 and brings to 145,007 the total number of skier days at the resort in what by any account has been an extraordinary season. Last year 65,000 skiers visited the resort and only three years ago they had their worst season ever with only 38,000 skiers. “
Gary Pearse says:
July 4, 2010 at 1:08 pm
“One of your links to the Norway conference of the IPY mentions 50,000 scientists up in the arctic for 30 months! […] D’ya think 50,000 scientists […] might have created a UHI effect.”
Depending on how you define the Arctic, that population density is the same as 750,000-7,000,000 people over the entire Earth. I don’t think that you have anything to worry about.
“The ice pack looks like Swiss cheese,” agreed Mark Serreze, a senior research scientist at the National Snow and Ice Data Centre in Boulder, Colorado.
I guess he didn’t bother to actually look at the data.
This map shows July 3, 2010 sea ice to be 90 to 100%. The only other years with a decent percentage of ice (80 – 100%) are 1991 and 2002
The flat out lies are getting a bit difficult to swallow.
Goofed the HTML tags again
The map is http://arctic.atmos.uiuc.edu/cryosphere/NEWIMAGES/arctic.seaice.color.000.png
REPLY: No need for tags, waste of time mostly just put in the URL like this http://www.google.com and it will auto convert to a link – Anthony
Here’s some light humour. This stuff is so funny:
http://climatesanity.wordpress.com/2010/07/03/entire-arctic-ocean-melted-as-early-as-august-8th-this-year/
Thank you Kirk! It’s nothing new my friends.
http://www.ngu.no/en-gb/Aktuelt/2008/Less-ice-in-the-Arctic-Ocean-6000-7000-years-ago/
http://noconsensus.wordpress.com/2009/06/16/historic-variation-in-arctic-ice-tony-b/
http://co2science.org/articles/V12/N32/C2.php
http://docs.lib.noaa.gov/rescue/mwr/050/mwr-050-11-0589a.pdf
http://www.john-daly.com/polar/arctic.htm
http://www.navsource.org/archives/08/08578.htm
http://www.icue.com/portal/site/iCue/flatview/?cuecard=41751
http://www.appinsys.com/GlobalWarming/RS_Arctic.htm
http://www.usgs.gov/newsroom/article.asp?ID=2372
http://wattsupwiththat.files.wordpress.com/2008/03/changing-artic_monthly_wx_review.png
http://wattsupwiththat.com/2008/03/16/you-ask-i-provide-november-2nd-1922-arctic-ocean-getting-warm-seals-vanish-and-icebergs-melt/
Global warming AND cooling FEARS are nothing new. Take an historic perspective:
Global Cooling Fears Of The Past – Ice Age – iceage
http://www.time.com/time/magazine/article/0,9171,944914,00.html
http://www.time.com/time/magazine/article/0,9171,945635,00.html
http://newsbusters.org/node/11640
(150 of global warming and cooling fears)
http://www.almanac.com/sites/new.almanac.com/files/1895_cvr1_0.png
(1895-2008 warming and cooling fears)
http://anotherviewonclimate.wordpress.com/2010/01/15/time-announces-approaching-ice-age/
(numerous new ice-age articles from 1970s)
wayne says:
July 4, 2010 at 3:27 pm
Do you know of any publically downloadable dataset that gives you the total sea ice area without some xx% cutoff involved. Seems to form a specified cutoff limit on the data, the entity that holds the original data must know the total sea ice to begin with. Have you ever found such a raw dataset? The answer might by simply ‘no’ or ‘none’ for I have not found one but have been looking.
Try here:
http://arctic.atmos.uiuc.edu/SEAICE/arctic.historical.seaice.doc.txt
These graphs on NH ice, COI, IJIS have 2010 close to 2007. don’t seem to match the pic’s at cyrosphere
http://igloo.atmos.uiuc.edu/cgi-bin/test/print.sh?fm=07&fd=02&fy=2007&sm=07&sd=02&sy=2010
or am i missing something?
Here’s a nice 4th of July shot from the North Pole http://www.arctic.noaa.gov/latest/noaa2.jpg
The monthly Antarctic Sea Ice Extent Anomaly is the highest on record for the month of June:
http://nsidc.org/data/seaice_index/images/s_plot_hires.png
and Antarctic Sea Ice Area continues to trend well above average:
http://arctic.atmos.uiuc.edu/cryosphere/IMAGES/seaice.recent.antarctic.png
In a prior thread Julienne noted that this might be because the Antarctic Oscillation (AAO) has been in a strong positive state since mid-May;
http://www.cpc.noaa.gov/products/precip/CWlink/daily_ao_index/aao/aao_index.html
Here is some background on the AAO:
http://fp.arizona.edu/kkh/climate/PPT-PDFs-09/indices/AAOReport.pdf
http://www.ecmwf.int/newsevents/meetings/annual_seminar/2006/Presentations/Wallace.pdf
http://www.earthgauge.net/wp-content/fact_sheets/CF_Antarctica.pdf
This version of the AOI chart above includes cross sections of the Polar Vortex;
http://www.cpc.noaa.gov/products/precip/CWlink/daily_ao_index/hgt.aao.shtml
and here is some background on the Polar Vortex:
http://en.wikipedia.org/wiki/Polar_vortex
Here’s are several good visualizations of the AAO and its interrelation with the Antarctic Vortex;
http://www.cpc.noaa.gov/products/intraseasonal/z200anim.shtml
http://www.cpc.noaa.gov/products/intraseasonal/z500_sh_anim.shtml
http://www.cfm.brown.edu/people/sean/Vortex/
(Note that the last link is an all flash site, so you will need to click on the links on the left especially “Physical Overview” to see the animations.)
Based on this chart by rbateman showing how well Antarctic and Arctic Sea Ice Anomalies match up;
http://www.robertb.darkhorizons.org/seaice.anomaly.Ant_arctic.jpg”
there certainly seems to be significant symmetry. Furthermore, in this animation of global pressure anomalies;
http://www.cpc.noaa.gov/products/intraseasonal/z200anim.shtml
note how the Arctic starts out as almost average pressure, and then as the pressure drops (becomes darker blue) over the Antarctic, the pressure increases (becomes dark red) over the Arctic. My potentially erroneous understanding of this effect, is that the Antarctic Vortex becomes very powerful (like a giant ice cold hurricane), creating very low pressure over Antarctica and increasing the pressure around the rest of the globe. If you watch the animation again, between June 10th and 20th it looks like a high pressure (dark red) pocket of more temperate air over the Atlantic gets pushed into Arctic. So when the Antarctic Vortex is strong/large, the pressure drops within it and increases around it (a positive Antarctic Oscillation) and the increased pressure forces warmer air towards the other pole.
On a prior thread Stephen Wilde put forth the global sea ice balancing mechanism as this:
“The Arctic is sea surrounded by land. The Antarctic is land surrounded by sea.
When the mid latitude jets move poleward more solar shortwave energy gets into the oceans and in due course more energy from warming seas eventually penetrates into the Arctic ocean to reduce ice cover. That cannot happen in the Antarctic so the continental Antarctic just gets more isolated by the faster tighter run of jets around it and it cools whilst the Arctic warms.
When the mid latitude jets move equatorward the seas receive less solar shortwave and so cool down and in due course the Arctic cools because it receives less energy from the waters entering the Arctic ocean. However the Antarctic warms because the slacker jets around the poles allow more north/south air flows and more warm air gets into the Antarctic continent.
Thus the apparent short term stability of global ice cover. Arctic and Antarctic ice cover always moves in opposite directions but of course longer term variability does nevertheless affect global ice quantities for other reasons.”
Can anyone else elaborate on the existence and function of Global Sea Ice balancing mechanisms that help to explain why the Global Sea Ice Area Anomaly;
http://arctic.atmos.uiuc.edu/cryosphere/IMAGES/global.daily.ice.area.withtrend.jpg
remains reasonably stable?
Steve,Hansen and colleagues’ model in 1988 did not forecast “near symmetrical warming at both poles”.
It forecast warming at low latitudes,particularly over land and sea-ice areas:
“Regions where an unambiguous warming appears earliest are low -latitude oceans,China and interior areas of Asia and ocean areas near Antarctica and the North Pole.”
No mention of near-symmetricality.
It also has to be considered that a warmer circum-Antarctic ocean can support more sea-ice.
Robert your spot on Katla volcano has had 72 earthquake’s since 17th of may if it blows its top forget about global warming
Sod,
I have discussed extensively in several articles that the NARL site is NE of Barrow, the ice is still there, and that a stretch of ice broke off immediately adjacent to Barrow on June 25.
Maybe you should try reading before firing off accusations?
Gail,
I’m going to write up an article pointing out how important high concentration ice is towards limiting the summer minimum.
Nick
Hansen’s prediction of symmetrical warming is right there in plate 4. The black steps on the lower right are due to the high altitude at the South Pole.
[youtube=http://www.youtube.com/watch?v=IDjb9SIPAMU]
Some interesting lines from The Declaration of Independence
Steve G,
That brought to mind this.
Above I pointed Nutation as a possible important driving factor of sea ice variation.
Interesting to see that some work as been done in this issue but I doubt in made into any IPCC report. See it here. Pretty interesting to me.
http://ansatte.hials.no/hy/climate/IcesJMS1999V56.pdf
“stevengoddard says:
July 4, 2010 at 6:45 pm”
Things certainly are shaping up again, and rapidly.
Steve, I have posted this before in other articles, but it seems appropriate here again.
Form Eisenhower’s Farewell Address, Dartmouth College, 1953:
Akin to, and largely responsible for the sweeping changes in our industrial-military posture, has been the technological revolution during recent decades.
In this revolution, research has become central; it also becomes more formalized, complex, and costly. A steadily increasing share is conducted for, by, or at the direction of, the Federal government.
Today, the solitary inventor, tinkering in his shop, has been overshadowed by task forces of scientists in laboratories and testing fields. In the same fashion, the free university, historically the fountainhead of free ideas and scientific discovery, has experienced a revolution in the conduct of research. Partly because of the huge costs involved, a government contract becomes virtually a substitute for intellectual curiosity. For every old blackboard there are now hundreds of new electronic computers.
The prospect of domination of the nation’s scholars by Federal employment, project allocations, and the power of money is ever present
• and is gravely to be regarded.
Yet, in holding scientific research and discovery in respect, as we should, we must also be alert to the equal and opposite danger that public policy could itself become the captive of a scientific-technological elite.
Ike saw this all coming. How do we unwind the corruption of good science by the government/academic cabal? Can we ever get the evil djinn back in the bottle?