By Steve Goddard

The Catlin Expedition is Now only 45 miles away from the North Pole. They have traveled 265 miles (as the crow flies) since March 3, for an average of about four miles per day. They only have a few days left on the ice and are caught in The Beaufort Gyre. They write:
Imagine being chilled to the very bone; where every step brings pain and discomfort; where there is no way of getting respite from a permanently aching back; where hauling a sledge twice your body weight is like dragging a car with the handbrake on; and where, despite trekking for over eight hours in the type of biting winds that feel like being relentlessly pecked at by invisible crows, you are getting nowhere. Literally nowhere. Caught on a polar treadmill that will happily drive you backwards if you stop your herculean efforts to…. Just. Keep. Going. Some 50-odd days into the expedition, and Ann, Charlie and Martin find themselves once again suffering from the powerful negative drift that persecuted them at the start of their mission. Aside from pressure ridges, open leads of water and large patches of thin ice, negative drift is one of the biggest factors affecting Arctic crossings. Psychologically, it is the most damaging of all.

Soon they can return home and report on the rapidly melting, highly acidic Arctic.
Temperatures in the Arctic are close to normal, and will be above freezing in about a month.

http://ocean.dmi.dk/arctic/meant80n.uk.php
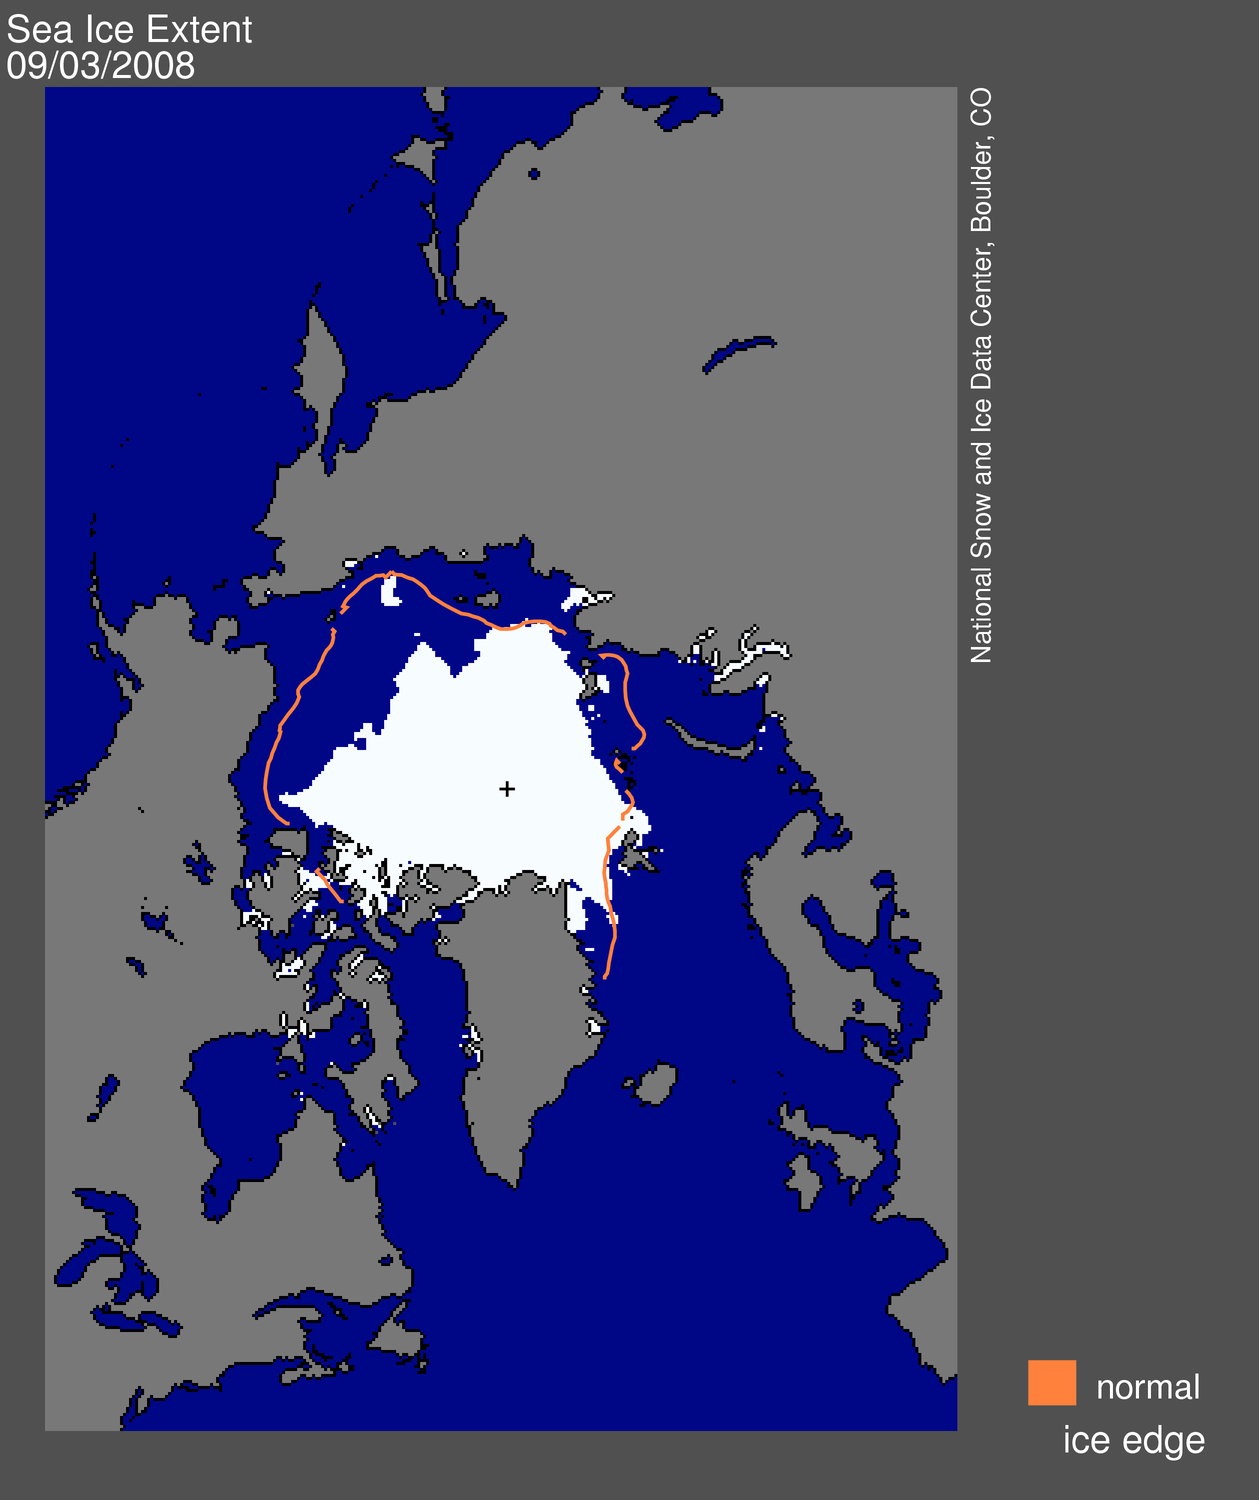
Arctic ice extent is also close to normal.

http://arctic-roos.org/observations/satellite-data/sea-ice/observation_images/ssmi1_ice_ext.png
The big story during the last few days is the divergence between the different data sources.

JAXA (green) is nearly half a million km2 lower than NORSEX (red.) DMI (fine dots) and NSIDC (purple) are half way in between. All are within one standard deviation of the mean (i.e. normal.) Unfortunately the NSIDC computer has been naughty and hasn’t updated any of their graphs or maps since Friday.
This time of year shows almost no year over year variation in extent or area. Ice extent has now declined by over one million km2 since the late March peak. The modified NSIDC map below shows in red, the total melt since early April.

The next modified NSIDC map shows where ice has melted during the last week.

The modified NSIDC map below shows where ice is above normal (green) and below normal (red.)

Ice continues to be above normal on the Pacific side where the waters are running very cold, and below normal on the Atlantic side where the waters are running warm.

http://weather.unisys.com/surface/sst_anom.html
The Pacific side of the Arctic is where the anomalies (red) have mainly been the last few summers, so things are shaping up for a nice recovery this summer.

Modified September 3, 2008 map from http://nsidc.org/images/arcticseaicenews/20080904_Figure1.png
Within a few weeks, ice in the central Arctic will quit thickening and start to melt. Stay tuned. The next few weeks will be slow news.
phlogiston says:
May 10, 2010 at 3:09 am
Nonetheless sea ice will recover this September, I hope “barefootgirl” (sounds like a pseudonym for online grooming of school teenagers) RGates, Anu etc will stay with us to enjoy the spectacle.
I’m impressed that some people can still delude themselves that the Arctic ice will “recover” this September. Such mental discipline will serve you well in the years ahead, as the climate data is gathered and reported.
Meanwhile, even early in the melt season, the ice is disappearing much faster than last year at this time:
http://arctic.atmos.uiuc.edu/cryosphere/IMAGES/seaice.recent.arctic.png
(you can verify the date on this daily updated graph here:
http://arctic.atmos.uiuc.edu/cryosphere/IMAGES/?C=M;O=D
)
The question is not “Will the minimum summer Arctic ice be more than 2 std dev’s less than the recent average ?”
Everyone knows it will be.
The question is: Will it be lower than 2009 ? 2008 ? 2007 ?http://nsidc.org/images/arcticseaicenews/20091005_Figure2.png
As the scientists from Steven Goddard’s favorite site, Arctic ROOS (Regional Ocean Observing System) of Norway say:
Since CO2 continues to go up, expect Arctic sea ice to continue to go down, with some random weather noise superimposed on the trend.
I’m looking forward to the “spin” and “explanations” of the Anti-Alarmists (Calmers ? Reassurers ? Stupefiers ?) in September. Keep in mind CryoSat-2 will be working by then, so you’ll have to step up your game.
George E. Smith says:
May 10, 2010 at 2:04 pm
so the first polar orbit satellite was launched in 1979; which is why we have no believable global ice records prior to that time.
Actually, George, Tiros-1 was launched in 1960! University of Bremen uses data back to 1972.
http://iup.physik.uni-bremen.de:8084/amsr/ice_ext_n.png
Stirling English says:
May 9, 2010 at 9:13 am
‘Soon they can return home and report on the rapidly melting, highly acidic Arctic.’
That’s the ‘highly acidic Arctic’ with the pH >7 is it? We technical chemistry people have a different word for such solutions. We call them ‘alkaline’. Simples!
Actually in the Arctic with the water temperature below 0ºC ‘we technical chemistry people’ call water with pH below 7.5 alkaline!
stevengoddard says:
May 10, 2010 at 7:09 am
Phil.
The NSIDC servers have been available all weekend. The graphs have not been updated and have no disclaimers attached.
http://nsidc.org/data/seaice_index/images/daily_images/N_timeseries.png
So you think it was a coincidence that they didn’t update their graphs during the previously advertised power outage? The notice was prominently placed on their home page in red.
George E. Smith says:
May 10, 2010 at 1:55 pm
“”” barefootgirl says:
May 10, 2010 at 11:21 am
……………
……………
2) melt onset is starting earlier in the Arctic and freeze-up is starting later, so the total melt season is extending which means more time to thin the ice to less time to grow the ice. “””
You want to run that by us again !…
____________________________________________________________
George, lay off the poor little bare foot girl, she just proved she is a brainwashed “innocent” regurgitating the lies she has been fed. She might have cognitive dissonance problems if you feed her reality too fast.
Phil. says:
May 11, 2010 at 8:01 am
George E. Smith says:
May 10, 2010 at 2:04 pm
so the first polar orbit satellite was launched in 1979; which is why we have no believable global ice records prior to that time.
Actually, George, Tiros-1 was launched in 1960! University of Bremen uses data back to 1972.
http://iup.physik.uni-bremen.de:8084/amsr/ice_ext_n.png
Thanks for the graph, hadn’t seen that one before.
Have you seen the Arctic ice data that goes back to 1870 ?
Obviously not all satellite data, but still interesting to look at…
http://arctic.atmos.uiuc.edu/SEAICE/
http://arctic.atmos.uiuc.edu/SEAICE/timeseries.1870-2008
Typo alert: should be ‘above’ not ‘below’.
Actually in the Arctic with the water temperature below 0ºC ‘we technical chemistry people’ call water with pH
belowabove 7.5 alkaline!George E. Smith says:
May 10, 2010 at 1:55 pm
“”” barefootgirl says:
May 10, 2010 at 11:21 am
……………
……………
2) melt onset is starting earlier in the Arctic and freeze-up is starting later, so the total melt season is extending which means more time to thin the ice to less time to grow the ice. “””
You want to run that by us again !
Try this graph for the last two years.
http://arctic.atmos.uiuc.edu/cryosphere/IMAGES/seaice.recent.arctic.png
R. Gates says:
The most complete data, and the best chart to use for Arctic Sea ice anomalies (which is what we really care about) is this well known one:
You’re missing the point, which is that the current sea ice extent, not the extent from last summer, is perfectly normal for this time of year, even if you don’t use the whole satellite record (but only until 2006, i.e. without the years with low extent).
So your comment to Steve Goddard was unjustified. It’s perfectly valid to question whether we can draw any conclusions from the ice extent at this time of year, though, since we’re in a period with low STD anyway. I think it would be safe to say that it’s extremely hard to make any reasonable prediction about this year’s minimum until late June.
“”” Phil. says:
May 11, 2010 at 10:35 am
George E. Smith says:
May 10, 2010 at 1:55 pm
“”” barefootgirl says:
May 10, 2010 at 11:21 am
……………
……………
2) melt onset is starting earlier in the Arctic and freeze-up is starting later, so the total melt season is extending which means more time to thin the ice to less time to grow the ice. “””
You want to run that by us again !
Try this graph for the last two years.
http://arctic.atmos.uiuc.edu/cryosphere/IMAGES/seaice.recent.arctic.png “””
So everybody’s got their own set of favorite graphs. My comments derived from just clicking on Anthony’s JAXA ice extent graphs; the same ones I’ve been looking at for the last 3-4 years. So treating the info those graphs give, as the baseline average set; then my coments correctly described the “anomalies”. See I finally found a use for that word.
You can use anomalies form your favorite baseline period data, and I’ll use the oines I have easy access too.
Well until somebody gives me convincing proof that neither one of them is dependable. Somehow I don’t think JAXA ever got down to 3 in 2007; seems it was more like 4.5 .
And just as I said; from those JAXA graphs you can see that the 2008 refreeze started about 10 days to two weeks ahead of 2007, while the 2010 high was several weeks delayed from 2007; other than that it is pretty much what I said.
So I stand corrected, Tiros-1 was evidently the first polar orbiting weather satellite. since April 1 1960
So where can we find the Tiros -1 Ice extent data going back to April 1960, so we can see what it was like back then. So how come everybody has a baseline of 1979-2000.
Where is all that polar observation ice data since 1960; there must be 19 years of it missing somewhere.
Golly Gail,
Did I really write that stuff ? I think maybe they musta put a little Schnapps in the water cooler; maybe I need to go and take a double shot of meds; along with some of that water cooler Elixir of course.
George E. Smith says:
May 10, 2010 at 2:04 pm
George you are so way off base about most things you wrote, it’s laughable to me. And I’m not going to bother to educate you any longer as you are not worth it. Do yourself a favor and educate yourself about Arctic science. READ the hundreds of journal articles about the sea ice instead of trying to rely on application of your education background to a subject you obviously know nothing about. Better yet, analyze the data yourself. Download all of NSIDC SMMR, SSM/I AMSR brightness temperatures, run whatever sea ice algorithm you feel is best (or even better, run them all and then make comparisons with observations, visible imagery, etc. to determine the most accurate algorithm), then also apply melt onset and freeze-up algorithm to the TB time-series, download all the submarine sonar data, the GLAS laser altimeter measurements, the radar data, the ocean buoy data, the atmospheric data and start to do your own analysis. You seem to think you know more than the scientists who daily analyze all this data, develop the algorithms to convert raw satellite data to geophysical parameters, etc. etc etc. I know that you do not as you have made that clear with your posts here on this blog.
But go ahead and give it a try. Make your retirement something worthwhile. Have something to back up your continuously irrelevant statements with.
Oh and BTW George, NSIDC has the ESMR sea ice data that started in 1972. Why don’t you look at that. It’s already been processed for your easy use. OR better yet since you don’t think any climate scientist is of any worth, process the raw data yourself. NSIDC has that data too.
if you had an understanding of satellite data you would know that visible and thermal data are of limited use in the Arctic because of cloudiness. best to work with the passive microwave data…so go for the ESMR data.
Hockeystickler says:
May 10, 2010 at 7:02 pm
I’m a PhD physicist trained in atmospheric science and remote sensing through my masters in Aerospace Engineering. I am more than qualified especially since I have processed and analyzed the majority of the data being discussed.
barefootgirl says:
May 11, 2010 at 5:42 pm
I’m a PhD physicist trained in atmospheric science and remote sensing through my masters in Aerospace Engineering. I am more than qualified especially since I have processed and analyzed the majority of the data being discussed.
—–
REPLY: Very cool, BFG! Welcome to the blog, it gets kinda wild in here sometimes!
I’m still amazed that people are taking the sea ice extent seriously in the spring…it doesn’t mean much. We are in “bottleneck season” right now. It doesn’t matter much if the ice was big in April as all years tend to constrict in late May and June. 2004 and 2006 are the two lowest years at the end of May on the Jaxa record easily…guess what, they were the two of the 3 highest extent minimums on the Jaxa record too only behind 2003.
The extent in April was due mostly to the cold Pacific conditions and the wind patterns that extended cold into the Bearing Sea and Sea of Okhotsk. The warmer Atlantic side was offsetting it a bit, so we were near the 1979-2000 mean. The ridiculous -AO this winter will be felt this summer as it held in more multi-year ice than previous years. Whether you want to claim that its “fragmented” or whatever is moot…because its still slower to melt than very thin ice…I’ve heard the “rotten” and “fragmented” multiyear ice argument a couple times already and that is pretty much pure bunk. The ice might melt more than last year’s minimum, but it won’t be because of temperatures or “fragmented ice”…it will be almost purely because of some amazing anomalous wind patterns….because that is what it will take to melt this off beyond 2009.
The Antarctic continues to put on ice at a slower rate than the last few years and coupled with the fast spring melt in the Arctic the global ice area remains negative. This year is the first year it may stay permanently negative since the start of the series
http://arctic.atmos.uiuc.edu/cryosphere/IMAGES/global.daily.ice.area.withtrend.jpg
Hudson bay has more open water in it for this time then any year for the last 7.
Andy
In another frontal blow to the sensibilities, a Pacific grey whale sighted in Israeli waters is an MSM living blow-hole breathing portend of massive real-time arctic melt-off.
http://sg.news.yahoo.com/afp/20100512/tts-environment-israel-species-animal-wh-c1b2fc3.html
We’re doomed, obviously. Popcorn, anyone?
RACookPE1978 says:
May 10, 2010 at 2:21 pm
“What “observations” don’t support a prediction that the 2007-2008, 2008-2009, 2009-2010 ice levels will NOT continue to increase? In April-May 2009, ice extents were at their highest level onthe chart. In March-April 2010, ice levels against exceeded all recent levels.”
Mine don`t. We are generally in a positive AO phase. These winters are exceptions, contrary to the current phase, this is not unusual; http://jisao.washington.edu/ao/
Expect a few warmer winters from now. From 2014 to at least 2020, there will be a number of cold N.H. winters where ice levels will be higher.
“What’s not to indicate that we are headed to the next (long overdue!) Ice Age due to increased reflection of ice from the Arctic, all the while that Antarctic ice is also increasing?”
The next Ice Age is roughly 85,000yrs ahead, the next Henrich event is 4627yrs after the LIA, and study of the c.1150yr cycle in world temps show that we are due for a return not of MWP conditions, but possibly Holocene Optimum conditions of c.4,300yrs ago, during the next few hundred years. Hooray.
Ulric Lyons: study of the c.1150yr cycle in world temps show that we are due for a return not of MWP conditions, but possibly Holocene Optimum conditions of c.4,300yrs ago, during the next few hundred years. Hooray.
Hooray indeed, that’s good news, although the AGWists think otherwise. But do you have any references for these claims?
Hm, I sea there’s only a little thin ice left in the Barents. The Kara sea ice is rapidly disintegrating. Ice very broken up both east and west of Greenland. Ice pulling apart north of the Barents Sea, in the Arctic Basin too. Big hole developing along the Alaskan North Slope, and also same thing along the Siberian coast.
The Arctic continues to trend towards less and less sea ice every summer – of course each year has weather, but it’s the warming Arctic that is driving the trends:
Less sea ice extent:
http://iup.physik.uni-bremen.de:8084/amsr/ice_ext_n.png
http://nsidc.org/data/seaice_index/images/daily_images/N_stddev_timeseries.png
http://www.ijis.iarc.uaf.edu/en/home/seaice_extent.htm
http://nsidc.org/images/arcticseaicenews/20091005_Figure2.png
Less sea ice area:
http://arctic.atmos.uiuc.edu/cryosphere/IMAGES/seaice.recent.arctic.png
Increasing temperatures:
http://ocean.dmi.dk/arctic/meant80n.uk.php
Summer minimum extents getting smaller and smaller:
http://nsidc.org/images/arcticseaicenews/20091005_Figure3.png
And I’d like to see the ice volume measurements/model-estimates updated:
http://psc.apl.washington.edu/ArcticSeaiceVolume/images/BPIOMASIceVolumeAnomalyCurrent.png
I don’t really care how the weather will increase/decrease the summer melt this year (the transition from the Ice Age to the Holocene had weather every summer, too) – the Arctic is marching towards less summer ice every year. If the minimum is less than in 2009, the ‘Alarmists’ will win a minor PR victory, and casual observers might notice; if less than in 2007, the Media will probably trumpet this and even more casual observers will be reminded again of global warming. If the minimum is greater than in 2009, the ‘Calmers’ will win a minor PR victory, claiming that the Arctic ice continues to recover. Either way, nothing will be decided in a year.
But it will be funny to watch the reaction here if it’s less than in 2007.
Anu, the world did not start in the 1970s. I do not know of anybody who would be surprised that Arctic Ice Extent is less now than the 1970s. Yet, it is not clear that Arctic temperatures are the primary cause of the Arctic Ice extent decline. Your DMI reference is not in a form that lends itself to easy identification of temperature trends. You might be interested in this record of station-by-by station trends: http://www.john-daly.com/stations/stations.htm#Greenland,%20Iceland,%20northern%20Norway,%20and%20the%20Arctic%20Ocean. There plenty of other candidates besides Arctic temperatures to explain Arctic ice decline.
I am not speculating on the 2010 minimum. On one hand we have more mult-year ice and we are unlikely to have a repeat of 2007 wind and cloud conditions. On the other hand, we continue to have Asian soot and plenty of warm Atlantic water.