By Steve Goddard

The Catlin Expedition is Now only 45 miles away from the North Pole. They have traveled 265 miles (as the crow flies) since March 3, for an average of about four miles per day. They only have a few days left on the ice and are caught in The Beaufort Gyre. They write:
Imagine being chilled to the very bone; where every step brings pain and discomfort; where there is no way of getting respite from a permanently aching back; where hauling a sledge twice your body weight is like dragging a car with the handbrake on; and where, despite trekking for over eight hours in the type of biting winds that feel like being relentlessly pecked at by invisible crows, you are getting nowhere. Literally nowhere. Caught on a polar treadmill that will happily drive you backwards if you stop your herculean efforts to…. Just. Keep. Going. Some 50-odd days into the expedition, and Ann, Charlie and Martin find themselves once again suffering from the powerful negative drift that persecuted them at the start of their mission. Aside from pressure ridges, open leads of water and large patches of thin ice, negative drift is one of the biggest factors affecting Arctic crossings. Psychologically, it is the most damaging of all.

Soon they can return home and report on the rapidly melting, highly acidic Arctic.
Temperatures in the Arctic are close to normal, and will be above freezing in about a month.

http://ocean.dmi.dk/arctic/meant80n.uk.php
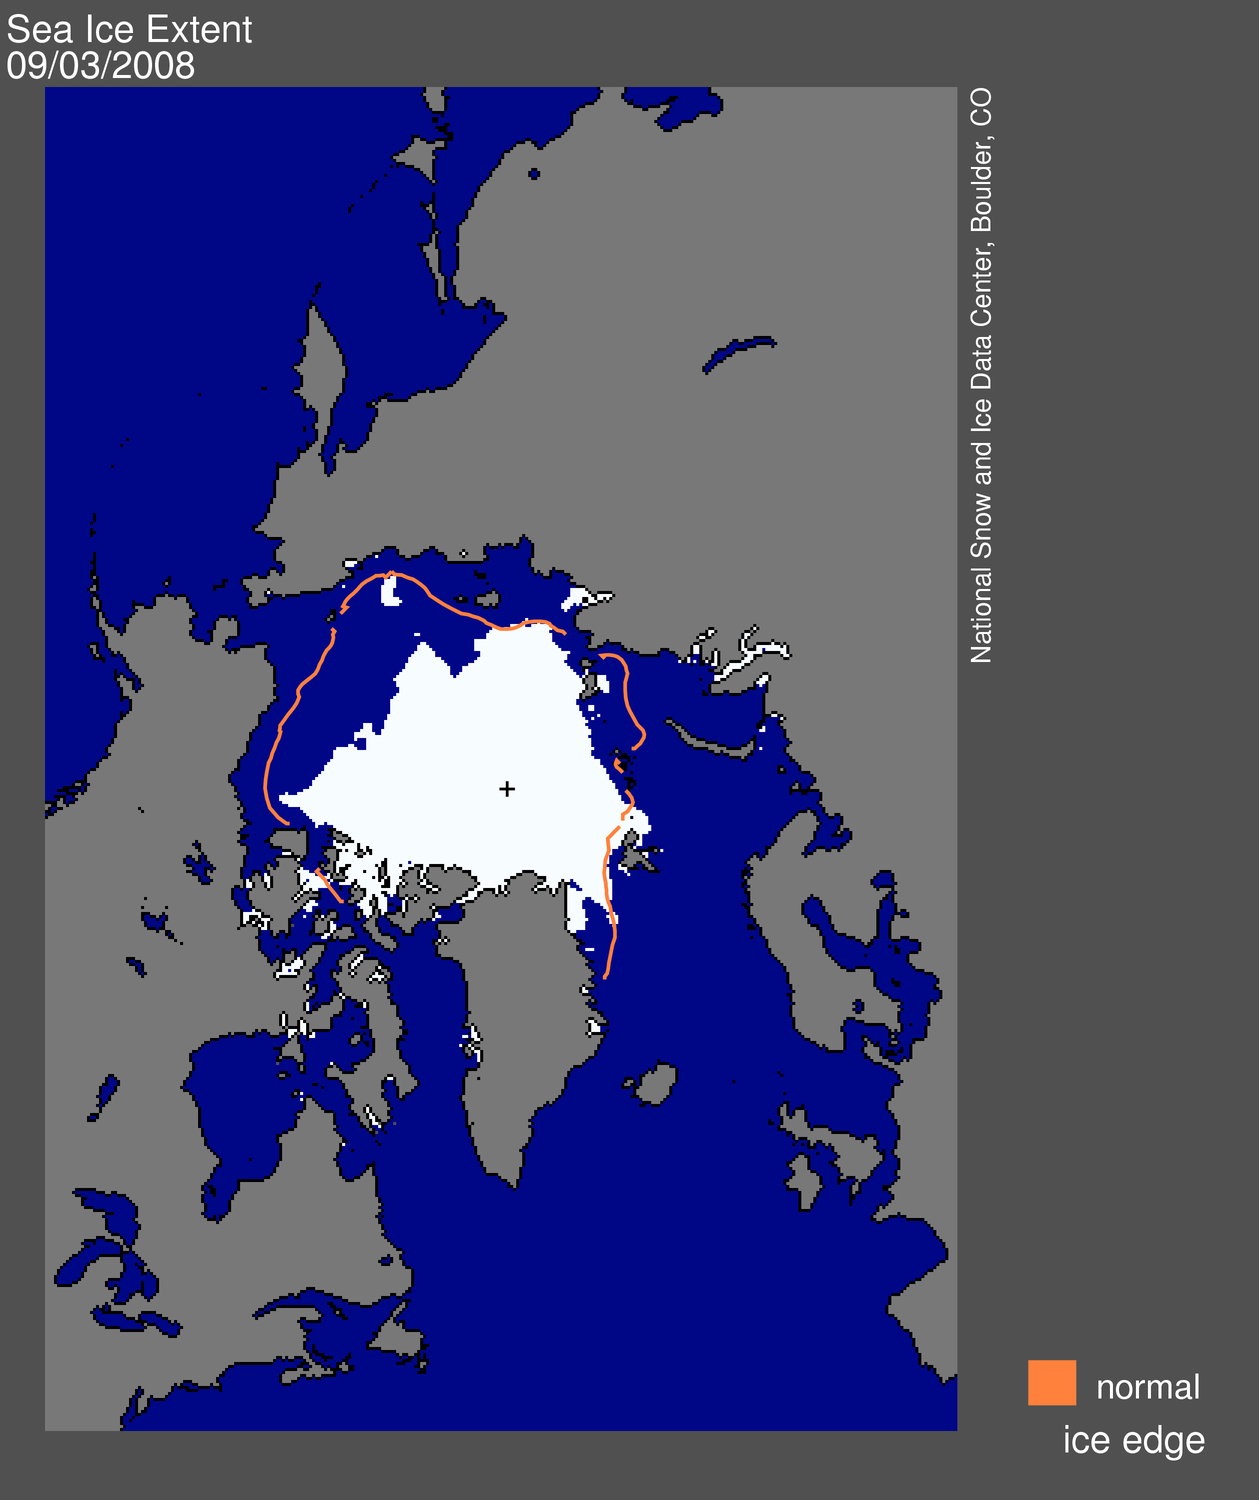
Arctic ice extent is also close to normal.

http://arctic-roos.org/observations/satellite-data/sea-ice/observation_images/ssmi1_ice_ext.png
The big story during the last few days is the divergence between the different data sources.

JAXA (green) is nearly half a million km2 lower than NORSEX (red.) DMI (fine dots) and NSIDC (purple) are half way in between. All are within one standard deviation of the mean (i.e. normal.) Unfortunately the NSIDC computer has been naughty and hasn’t updated any of their graphs or maps since Friday.
This time of year shows almost no year over year variation in extent or area. Ice extent has now declined by over one million km2 since the late March peak. The modified NSIDC map below shows in red, the total melt since early April.

The next modified NSIDC map shows where ice has melted during the last week.

The modified NSIDC map below shows where ice is above normal (green) and below normal (red.)

Ice continues to be above normal on the Pacific side where the waters are running very cold, and below normal on the Atlantic side where the waters are running warm.

http://weather.unisys.com/surface/sst_anom.html
The Pacific side of the Arctic is where the anomalies (red) have mainly been the last few summers, so things are shaping up for a nice recovery this summer.

Modified September 3, 2008 map from http://nsidc.org/images/arcticseaicenews/20080904_Figure1.png
Within a few weeks, ice in the central Arctic will quit thickening and start to melt. Stay tuned. The next few weeks will be slow news.
‘Soon they can return home and report on the rapidly melting, highly acidic Arctic.’
That’s the ‘highly acidic Arctic’ with the pH >7 is it? We technical chemistry people have a different word for such solutions. We call them ‘alkaline’. Simples!
Who funds these people ?! Let me add some more: ?????? !!!!!!!!!!!!!!!!!!!!!!!!!!!!!!! They and their “data” were a joke last year. And this year… it is just plain sad that even WUWT gives them attention.
‘Imagine….. where hauling a sledge twice your body weight is like dragging a car with the handbrake on…’
Maybe they should practice with cars (hand-brake on) before they go.
And only those who can snig it 4 miles a day are then allowed on the pleasurable jaunt!!
“Soon they can return home and report on the rapidly melting, highly acidic Arctic”.
What more proof do you need to conclude that it is an absolute waste of time to undertake a dialogue anout AGW with ideologues!
Even if they freeze off their butts you can’t change their conviction that AGW and melting Ice caps are a threat!
The only way to beat them is by publishing articles like this!
The more people take notice and het informed about the scam, the better our chances get to beat them on a political level!
This showboating proves nothing. The Arctic ice continued to expand until March 31st this year, this is the latest date for ice growth since satellite records began in 1979. The ice is also thicker according to the University of Illinois, than in 1980. With the cooler Pacific waters I would think there will be more ice in mid September (the period of maximum melting) than in previous years.
If anything, CO2 leads to water being less alkaline. To state the absurd, it would have to be better than beer to become acidic or “more acidic”. And if that were the case, my monthly tavern tab would be much less and I would move to the coast.
“Imagine being chilled to the very bone; where every step brings pain and discomfort …”
And again the point of doing this is …. ?
How is it that this year they’ve not had any battery problems? Have they decided it would be counter productive to measure ice thickness, or maybe they decided they really like the human powered auger method.
“Imagine being chilled to the very bone; where every step brings pain and discomfort; where there is no way of getting respite from a permanently aching back”
Sounds like living in the post-Labour UK as you approach retirement.
It is called masochism. On all fronts,
Re Mike Strong “it is just plain sad that WUWT gives them attention.”
I think they should get more funding and more attention. The annual clown-act that is the Catlin “Expedition” is really an exposition of the the fact that much of the CAGW movement is comprised of non-serious people. The chumps who fund this nonsense are relieved of funds that they could ( and probably would) otherwise spend on electing the type of politician that will do actual damage. Whats not to like?
Even Eco-World is skeptical about the polar ice story. [This article is about Antarctic ice].
As usual Steve, thanks for the report, but I continue to be baffled by statements you make such as this:
“Arctic ice extent is also close to normal.”
And then you use the shortest possible data range out there. Why would you choose to do that, as opposed to using the longest and far more valid data range available? This use of the shortest data range available, is akin to looking in your backyard on the coldest day of the year and declaring that the next ice age is coming. Hardly scientific.
Still, your reports are amusing, even if you left out the fact that arctic sea ice is currently below level seen in 2008 and 2009 for the same date.
I don’t believe they are out there in the arctic. They are in a movie studio somewhere.
Steve, isn’t that area in red in your first map exactly the area where icebreakers from several nations, including the US and Canada, have been busy all winter “keeping the shipping lanes open”? It would also be nice if the summer minimum ice extent was the natural minimum ice extent….
http://www.yellowairplane.com/North_Pole_Arctic_Cruise_Vacation.html
A climatically aware travel service is offering summer cruises to the North Pole to allow tourists to see climate change and melting ice-caps for themselves…. via icebreaker.
… and Robert Gates, responding sort of off-the-cuff to a question, suggested the United States needed more icebreakers…
http://www.news24.com/SciTech/News/More-icebreakers-for-Arctic-20100503
I probably haven’t looked hard enough, but if anyone has any links to data about the extent of area broken up by icebreakers I’d love to see it.
Catlin is sponsored by an insurance company which hopes to make millions selling insurance against risks affected by global warming. With a pH between 7.9 and 8.2 the oceans are firmly alkaline and will remain so for millions of years………..
Taken from Christopher Booker’s column Sunday Telegraph UK 09-10-2010
I would be willing to bet that R. Gates gets down on his knees every night and prays to St. Albert for the miracle of a complete Arctic meltdown. Today being Sunday in some parts of the world, no doubt he’s already tithed at the Church of Globaloney Warming & Doublethink.
I slept in.☺
Imagine being chilled to the very bone; where every step brings pain and discomfort; where there is no way of getting respite from a permanently aching back; where hauling a sledge twice your body weight is like dragging a car with the handbrake on; and where, despite trekking for over eight hours in the type of biting winds that feel like being relentlessly pecked at by invisible crows, you are getting nowhere.
Imagine the stupidity and futility of performing a 19th Century style Expedition in the 21st Century.
What’s the point of getting nowhere in the middle of nowhere risking life & limb?
Answer: Drama.
Mike Strong says:
May 9, 2010 at 9:16 am
Who funds these people ?! Let me add some more: ?????? !!!!!!!!!!!!!!!!!!!!!!!!!!!!!!! They and their “data” were a joke last year. And this year… it is just plain sad that even WUWT gives them attention.
************************************************
Sometimes you just need comic relief.
Steamboat Jack (Jon Jewett’s evil twin)
nc says:
May 9, 2010 at 9:48 am
Yes, many have suspected that this is a PR Stunt of dubious nature.
Do we have unquestionable proof that they are really where they say they are, or is it a ‘trust us’ thing?
Aside from pressure ridges, open leads of water and large patches of thin ice, negative drift is one of the biggest factors affecting Arctic crossings.
Charles Lindbergh knew about negative drift, which was why he didn’t cross the Atlantic from Paris to New York.
I just wanted to check – they are wearing the officially prescribed hair shirts – aren’t they?
Based on the Google Map (first pic, above) all is lost. Looks like the Arctic sea ice has completely melted. If they’re ‘walking’ on anything it must be all that man-made, global warming plastic that accumulates in the center of oceanic gyres.
What a horrible, disturbing thought! Our R. Gates couldn’t possibly be the same as a certain high ranking defense department personality…. naw.
Imagine. Pulling your car with the handbrake on, just to go nowhere, just to prove you’re stupid.
So far, that’s the only thing demonstrated with this expedition.