By Steve Goddard

The Catlin Expedition is Now only 45 miles away from the North Pole. They have traveled 265 miles (as the crow flies) since March 3, for an average of about four miles per day. They only have a few days left on the ice and are caught in The Beaufort Gyre. They write:
Imagine being chilled to the very bone; where every step brings pain and discomfort; where there is no way of getting respite from a permanently aching back; where hauling a sledge twice your body weight is like dragging a car with the handbrake on; and where, despite trekking for over eight hours in the type of biting winds that feel like being relentlessly pecked at by invisible crows, you are getting nowhere. Literally nowhere. Caught on a polar treadmill that will happily drive you backwards if you stop your herculean efforts to…. Just. Keep. Going. Some 50-odd days into the expedition, and Ann, Charlie and Martin find themselves once again suffering from the powerful negative drift that persecuted them at the start of their mission. Aside from pressure ridges, open leads of water and large patches of thin ice, negative drift is one of the biggest factors affecting Arctic crossings. Psychologically, it is the most damaging of all.

Soon they can return home and report on the rapidly melting, highly acidic Arctic.
Temperatures in the Arctic are close to normal, and will be above freezing in about a month.

http://ocean.dmi.dk/arctic/meant80n.uk.php
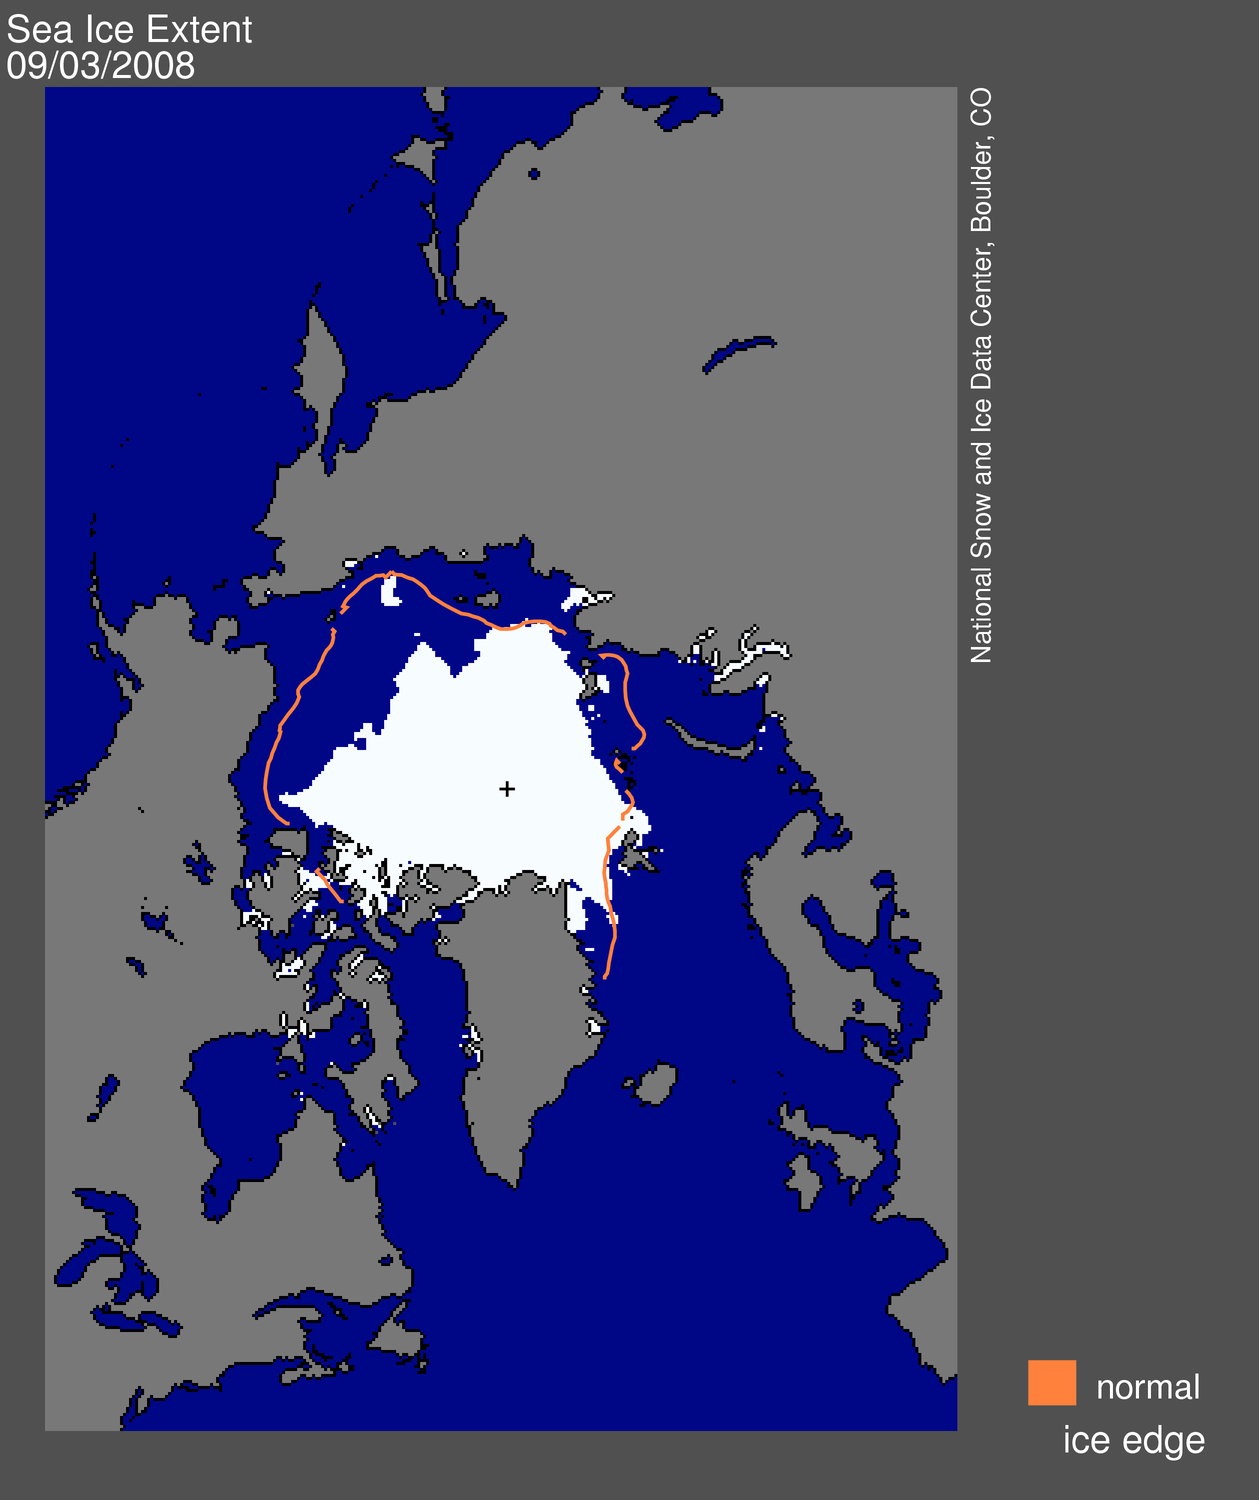
Arctic ice extent is also close to normal.

http://arctic-roos.org/observations/satellite-data/sea-ice/observation_images/ssmi1_ice_ext.png
The big story during the last few days is the divergence between the different data sources.

JAXA (green) is nearly half a million km2 lower than NORSEX (red.) DMI (fine dots) and NSIDC (purple) are half way in between. All are within one standard deviation of the mean (i.e. normal.) Unfortunately the NSIDC computer has been naughty and hasn’t updated any of their graphs or maps since Friday.
This time of year shows almost no year over year variation in extent or area. Ice extent has now declined by over one million km2 since the late March peak. The modified NSIDC map below shows in red, the total melt since early April.

The next modified NSIDC map shows where ice has melted during the last week.

The modified NSIDC map below shows where ice is above normal (green) and below normal (red.)

Ice continues to be above normal on the Pacific side where the waters are running very cold, and below normal on the Atlantic side where the waters are running warm.

http://weather.unisys.com/surface/sst_anom.html
The Pacific side of the Arctic is where the anomalies (red) have mainly been the last few summers, so things are shaping up for a nice recovery this summer.

Modified September 3, 2008 map from http://nsidc.org/images/arcticseaicenews/20080904_Figure1.png
Within a few weeks, ice in the central Arctic will quit thickening and start to melt. Stay tuned. The next few weeks will be slow news.
Keep trying Smokey to distract with your assumptions about my beliefs in or not in global warming. I’m talking about the current state of the Arctic sea ice and nothing else. Politicians use your tactic all the time. Perhaps you should think about running for office?? All it does is make me think you are trying to deflect because you realize you can’t argue against the fact that the state of the Arctic ice cover doesn’t look good for ice recovery this summer I (which is something many seem to want to believe even though the observations don’t support that).
barefootgirl says:
May 10, 2010 at 11:21 am
Have a look at that Unisys anomaly again.
The Arctic is anomalously above and the rest of us poor slobs in N. America, Europe and China are anomalously below.
I would prefer the Ice remain in the Arctic, not on top of us.
Congressman Says Climate Science Should Be Simplified to ‘Sixth Grade Level’ Because Americans ‘Don’t Get’ It
Monday, May 10, 2010
By Christopher Neefus
http://www.cnsnews.com/news/article/65515
Looking at the Navy site: it looks like there is a slight warm anomaly around the Aleutians, not cool like unisys shows….
“…once again suffering from the powerful negative drift that persecuted them at the start of their mission.” Suffering … and persecution, Oh My! Sounds like Anthropomorphic Global Persecution Complex to me!
I just love how they perceive the every day changing forces of nature as something personally directed against them! They cannot acknowledge the poorly understood natural forces or their natural cycles that interact with little known complexities and pendulum about on time scales barely glimmered. But be of good cheer, fellow Realists! The hot air is rapidly leaking from the CO2 balloon, pricked again and again by the forthright ministrations of truth seekers like Mssrs. Watts, Pielke, and McIntyre, to name a few.
Like the veterinarian said about the cat’s hairballs, “This too shall pass pass!” But not before many a barefoot girl and boy has stepped in it, again, and again, and again,….
Fortunately for all, simply wiping your feet on the doormat will suffice to reduce those nasty carbon footprints!
regeya says:
May 10, 2010 at 10:58 am
We’re still in panic mode in Illinois because April was the warmest on record…nothing in the news about the abrupt halt in corn growth due to the FRICKIN COLD WEATHER
_________________________________________________________________________
Tell me about it. I am in the sunny south (NC), you know temperatures from 85 to 98F in the merry month of may? Well I woke up freezing this morning to 35F in MAY, it is now 3:30pm and we have managed to warm up to a whopping 64F. On the 10th in 2004 (solar max cycle 23) the low was 60F and the high 91F.
Now where is that global warming Al Gore was mentioning???
barefootgirl says:
May 10, 2010 at 11:21 am
George writes that air temperatures cannot cause the ice to thin? Really? So when temperatures go above freezing and the ice starts to melt, that doesn’t thin the ice? Hmmm…and when melt ponds form on the ice surface and absorb more solar radiation than the surrounding (white) bare ice, they don’t further the melting of ice?
Nansen found that when air temperatures rose above zero and melt ponds formed, the overall thickness of ice actually increased, at least until early July. This was becuase the fresh water trickled down through the ice, but then floated above the salt water, which as it was typically -1 or -2C, re-froze the fresh water, such that the overall thickness of ice increased. For more details, see Chapter 7, section 458 in volume 1 below. What Nansen achieved in 1880 is staggering, and puts our 21st century Catlin jokers to shame.
ONLINE BOOKS – ARCHIVE ARCTIC EXPEDITIONS, Nansen, Peary:
Polar exploaration Climate history: Farthest North / Farthest Nord
Being the Record of a Voyage of Exploration of the Ship ‘Fram’ 1893-1896
Author: Fridtjof Nansen
http://www.gutenberg.org/files/30197/30197-h/30197-h.htm (volume 1)
http://www.archive.org/details/farthestnorthbei02nansuoft (volume 2)
We are forecast to have a very wet, heavy snowfall this week, just as the leaves are growing on the trees. It has been 14 years since that happened and last time it broke about 50% of the tree branches.
Slightly OT, but US carbon dioxide emissions were down about 7% in 2009, due to switching from coal to natural gas and also the economic downturn:
http://www.eia.doe.gov/oiaf/environment/emissions/carbon/
“”” barefootgirl says:
May 10, 2010 at 11:21 am
George writes that air temperatures cannot cause the ice to thin? Really? “””
“””
George, I’m sorry but the experiment you suggest is not relevant to the situation occurring in the Arctic… “””
Really ! ?
Well barefoot girl; please cite exactly where I said that in the first excerpt from your post above. For the record; nowhere at no time in all of recorded history have I ever said that; nor have I ever said anything that could be misconstrued by even the most illiterate as to mean that.
As to the comment on my experiment; well I will just assume that your powers of logical reasoning are a good match for your literacy.
If you did those experiments, even in your mind; you would conclude that the rate of heat transfer from water to ice, is orders of magnitude higher than the rate of heat transfer from air into ice. Not only that but the surface of ice in contact with water is much greater than the area of ice in contact with the air. So there is no way that the air could be anything but a minor contributor to ice melting.
And please don’t forget barefootgirl, that melting of ice is not some trivial temperature unbalance phenomenon. It actually takes energy to melt the ice; namely 80 calories per gram. So do your little calculation of the relative specific heats of standard earth atmosphere and typical ocean water; and then tell us which of the two is likely to be able to supply all that thermal energy to the ice to melt it, without having its own temperature depressed by the loss of energy till it is far below the melting temperature of the ice.
Read what I say; not what you think you read that I said; when I said no such thing.
The Hunt for the Mad Trapper
http://watch.discoverychannel.ca/the-hunt-for-the-mad-trapper/hunt-for-the-mad-trapper/#clip177480
jakers says:
May 10, 2010 at 12:35 pm
There is a problem reported with the validity of that site’s security certificate.
The DOD doesn’t take kindly to folks snooping around thier stuff, so no thanks, I’ll pass.
“”” barefootgirl says:
May 10, 2010 at 11:21 am
……………
……………
2) melt onset is starting earlier in the Arctic and freeze-up is starting later, so the total melt season is extending which means more time to thin the ice to less time to grow the ice. “””
You want to run that by us again !
Seems like we just recently had this big discussion right here at WUWT about the Arctic ice extent continuing to climb for several weeks after the normal start of melting so that it actually exceeded the standard “normal” maximum ice extent; it’s just down the archives a short distance.
Then just go back to the sept 2008 JAXA ice extent, and explain why the start of refreezing happened about two weeks earlier than what is normal.
So in both cases the recent behavior has been exactly opposite of what you stated here.
“in the sunny south (NC), you know temperatures from 85 to 98F in the merry month of may?” Really? – I think you mean record highs for the month range from 85 to 98F…?
RE: Amino Acids in Meteorites says: May 9, 2010 at 12:57 pm
El Nino gave us a small stay of execution. The big slide down the great razor blade shall shortly resume.
“There is a problem reported with the validity of that site’s security certificate.
The DOD doesn’t take kindly to folks snooping around thier stuff, so no thanks, I’ll pass.”
That is because the certificate is self-issued by DOD, and is not purchased from a commercial entity, so you will have to put in an exception in your browser.
It is a public web site – why would you say “snooping”?
“”” 3) buoy observations and ocean temperatures have shown increases in pulses of warm water into the Arctic. “”
Another exciting factoid supplied by barefootgirl; well at least I did cut and paste it from a post under his/er shingle.
So this amazing observation is relevent to the atmosphere melting the ice ?
Then there is this jewel “”” Thinner ice is also more vulnerable to the winds, so in 2007 when you had the Arctic dipole pattern set up, a lot of ice was lost, whereas when it happened in the 1970s you didn’t see such a large ice loss. “””
so the first polar orbit satellite was launched in 1979; which is why we have no believable global ice records prior to that time.
So just what was it that you observed in the 1970s; or was the year 1979 good enough for you to represent that decade.
I bet I’m at least twice your age barefootgirl; and you’ll have to skate a darn side quicker than that to keep up with me !
barefootgirl says:
May 10, 2010 at 11:59 am
Keep trying Smokey to distract with your assumptions about my beliefs in or not in global warming. I’m talking about the current state of the Arctic sea ice and nothing else. Politicians use your tactic all the time. Perhaps you should think about running for office?? All it does is make me think you are trying to deflect because you realize you can’t argue against the fact that the state of the Arctic ice cover doesn’t look good for ice recovery this summer I (which is something many seem to want to believe even though the observations don’t support that).
—…—…
What “observations” don’t support a prediction that the 2007-2008, 2008-2009, 2009-2010 ice levels will NOT continue to increase? In April-May 2009, ice extents were at their highest level onthe chart. In March-April 2010, ice levels against exceeded all recent levels.
What’s not to indicate that we are headed to the next (long overdue!) Ice Age due to increased reflection of ice from the Arctic, all the while that Antarctic ice is also increasing?
jakers says:
May 10, 2010 at 2:02 pm
so you will have to put in an exception in your browser
No. When the DOD comes up I draw the line. You are on your own.
It is a public web site – why would you say “snooping”?
The US military is not in this world to support/argue Climate Change.
One thing leads to another, and I will not be party to nor encourage anyone who does so.
“In April-May 2009, ice extents were at their highest level onthe chart. ”
Which chart? This one? http://nsidc.org/images/arcticseaicenews/20100504_Figure3.png In any case, not all agree about the ice area extent this summer – see http://www.accuweather.com/world-bastardi-europe-blog.asp?partner=accuweather
barefootgirl says:
May 10, 2010 at 11:21 am
Subimation will occur below freezing point;
http://en.wikipedia.org/wiki/Sublimation_%28phase_transition%29
Increased winds speed up the process.
This article on AO explains sea temperatures under the ice ect, the AO
is positive theoretically, till 2035, expect some strong exceptions between
2014-2020. http://jisao.washington.edu/ao/
barefootgirl says:
May 10, 2010 at 11:21 am
Sublimation will occur below freezing point;
http://en.wikipedia.org/wiki/Sublimation_%28phase_transition%29
Increased winds speed up the process.
This article on AO explains sea temperatures under the ice ect, the AO
is positive theoretically, till 2035, expect some strong exceptions between
2014-2020. http://jisao.washington.edu/ao/
The Navy site cert error isn’t about warning off hackers from attacking the US Navy’s computer resources. It’s your browser warning YOU that the site might be trying to attack YOU or fool you into trusting that site when you shouldn’t.
barefootgirl – if you are from hawaii, which has the perfect climate (and nice weather too) , you should be disqualified from commenting on the less than perfect conditions which the rest of us poor sods have to endure. by the way, anna v. is a physicist ; you may be a little out of your depth in criticizing her views of the physics of the arctic. aloha.
Why do these people do this? It only proves they are like lemmings. Maybe it is Darwin attempting to weed out the gene pool.