By Steve Goddard

The Catlin Expedition is Now only 45 miles away from the North Pole. They have traveled 265 miles (as the crow flies) since March 3, for an average of about four miles per day. They only have a few days left on the ice and are caught in The Beaufort Gyre. They write:
Imagine being chilled to the very bone; where every step brings pain and discomfort; where there is no way of getting respite from a permanently aching back; where hauling a sledge twice your body weight is like dragging a car with the handbrake on; and where, despite trekking for over eight hours in the type of biting winds that feel like being relentlessly pecked at by invisible crows, you are getting nowhere. Literally nowhere. Caught on a polar treadmill that will happily drive you backwards if you stop your herculean efforts to…. Just. Keep. Going. Some 50-odd days into the expedition, and Ann, Charlie and Martin find themselves once again suffering from the powerful negative drift that persecuted them at the start of their mission. Aside from pressure ridges, open leads of water and large patches of thin ice, negative drift is one of the biggest factors affecting Arctic crossings. Psychologically, it is the most damaging of all.

Soon they can return home and report on the rapidly melting, highly acidic Arctic.
Temperatures in the Arctic are close to normal, and will be above freezing in about a month.

http://ocean.dmi.dk/arctic/meant80n.uk.php
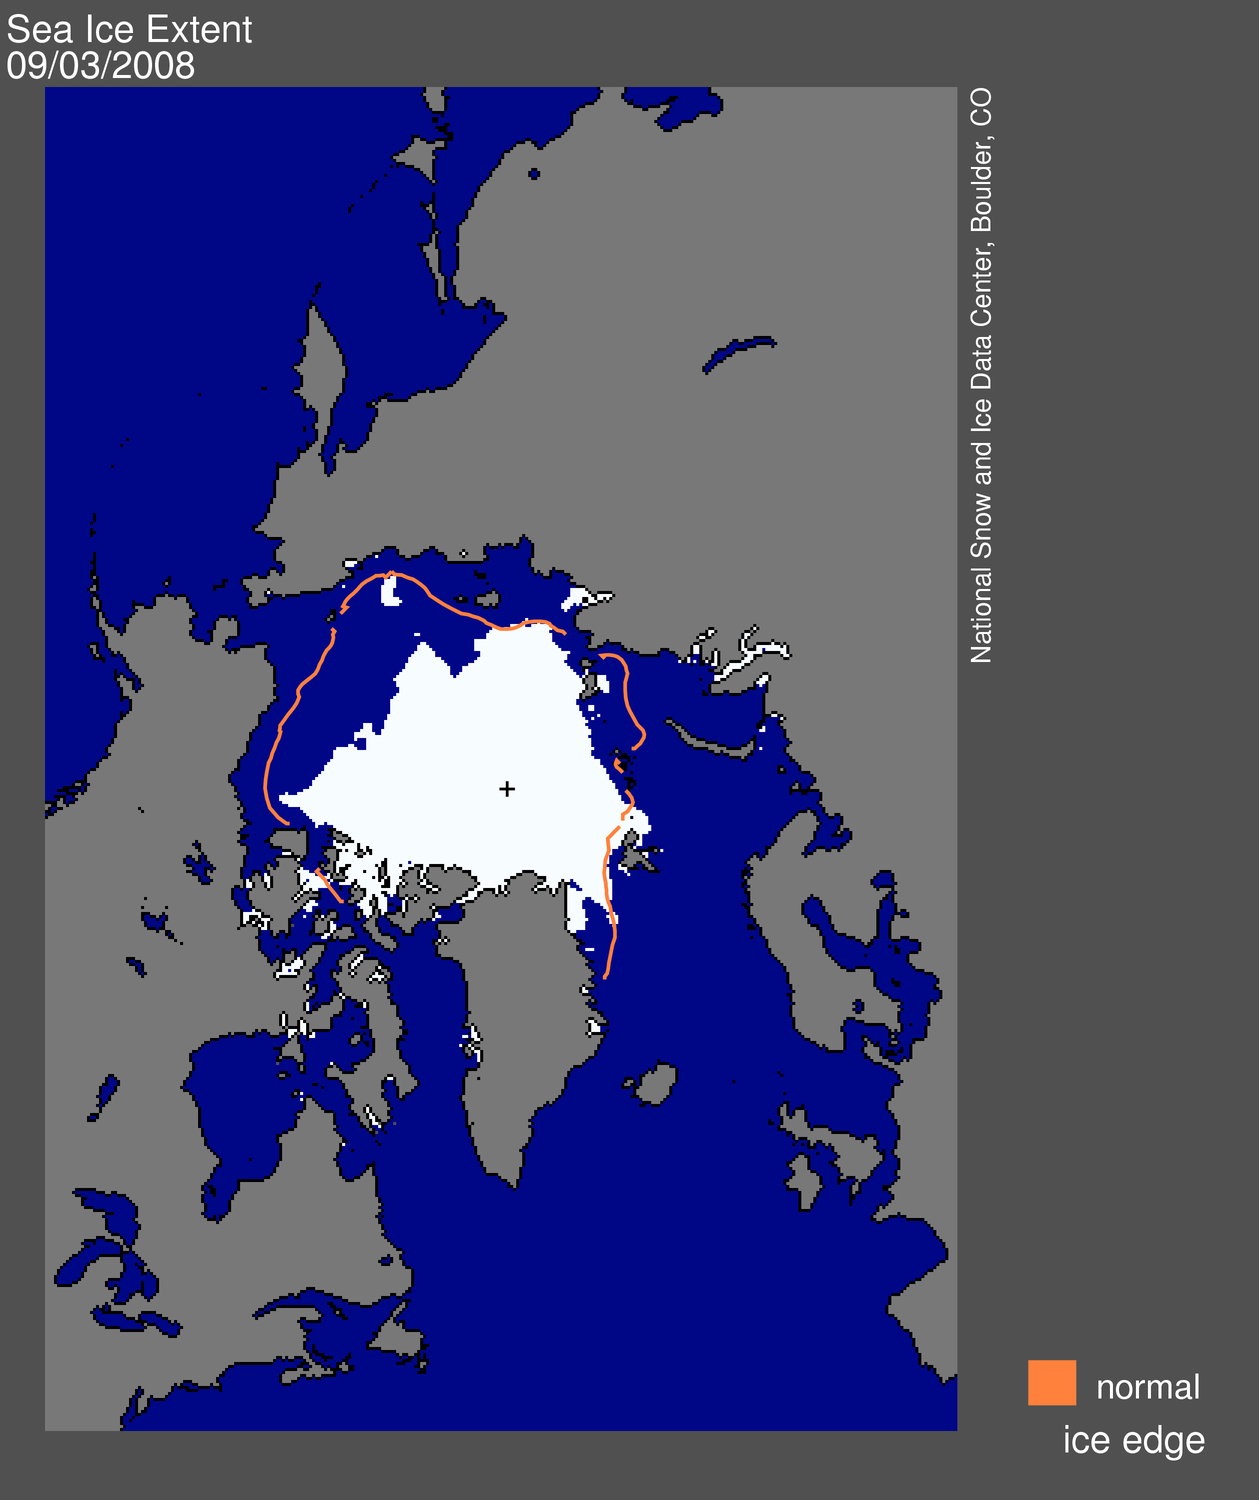
Arctic ice extent is also close to normal.

http://arctic-roos.org/observations/satellite-data/sea-ice/observation_images/ssmi1_ice_ext.png
The big story during the last few days is the divergence between the different data sources.

JAXA (green) is nearly half a million km2 lower than NORSEX (red.) DMI (fine dots) and NSIDC (purple) are half way in between. All are within one standard deviation of the mean (i.e. normal.) Unfortunately the NSIDC computer has been naughty and hasn’t updated any of their graphs or maps since Friday.
This time of year shows almost no year over year variation in extent or area. Ice extent has now declined by over one million km2 since the late March peak. The modified NSIDC map below shows in red, the total melt since early April.

The next modified NSIDC map shows where ice has melted during the last week.

The modified NSIDC map below shows where ice is above normal (green) and below normal (red.)

Ice continues to be above normal on the Pacific side where the waters are running very cold, and below normal on the Atlantic side where the waters are running warm.

http://weather.unisys.com/surface/sst_anom.html
The Pacific side of the Arctic is where the anomalies (red) have mainly been the last few summers, so things are shaping up for a nice recovery this summer.

Modified September 3, 2008 map from http://nsidc.org/images/arcticseaicenews/20080904_Figure1.png
Within a few weeks, ice in the central Arctic will quit thickening and start to melt. Stay tuned. The next few weeks will be slow news.
Robert E. Phelan said on May 9, 2010 at 9:53 am
What an interesting idea … to what extent does that make it easier for the melt-back to occur and for winds to flush ice out of the Arctic, and which R Gates is that?
Gates, what am I to do with you. You seem tied to wriggle matching the dance of a gnat’s behind instead of being interested at all in the larger context and interplay of sea ice behavior and the Arctic environments. The one standard deviation of the above graph is too severe in my view, and is rarely used in research. The reason why two standard deviations, instead of 1, are used for ice measurements in most graphs is because ice behavior is quite affected by the variable and oscillating weather/oceanic conditions. In my opinion, neither record you refer to is long enough. Therefore I cannot say at all whether or not the current ice extent, area, and volume is outside of natural influence. In my opinion, the fact that you seem so sure it is, is a testament to your lack of understanding of and willingness to learn about these matters related to this complex area of our globe. You seem only interested in the rather artificial and uninformative “numbers” game. Always remember, data alone is void of information. You seem data rich, and information poor.
And I might add, those that jump up and down at anything that falls above average without exploring why, make the same mistake.
Boycott warmist stunts! Boycott their sponsors… Even ridiculing them gives them the oxygen of publicity… If we ignore them they might just go away…
The graph labelled ICE_EXT.NORSEX SSM/1 compares the 2010 extent to the monthly mean 1979-2006 values. Surely with 2007, 2008 and 2009 data now available (as shown in the graph) the monthly mean should be taken over the period 1979-2009? I have not done the calculations but, visually, if the mean was taken over the 31 year period, as opposed to the 28 year period, the 2010 ice extent would still be above the monthly mean. Why the shortened period? And if it has to be thirty years then the correct period to take is 1980-2009.
“Imagine being chilled to the very bone; where every step brings pain and discomfort; where there is no way of getting respite from a permanently aching back; where hauling a sledge twice your body weight is like dragging a car with the handbrake on; and where, despite trekking for over eight hours in the type of biting winds that feel like being relentlessly pecked at by invisible crows, you are getting nowhere. ”
The team from Top Gear had a better idea – they went to the Pole in Toyota 4WDs.
Addendum
A two standard deviation does not mean that anything that lies outside these bands must have another cause. Our global climate zones have long included both a standard deviation of the most likely weather pattern variations along with extremes in order to insure plant hardiness in case those extremes occur. And that was way before climate warming was mainstream media news. Many things in nature have rare extremes as well as events that mostly stay within the standard deviation. That this happens is not indicative of separate causes.
One R. Gates is the United States Secretary of Defense, serving under both Dub-yah and The One: http://en.wikipedia.org/wiki/Robert_Gates
the other is one of our alarmist regulars (see the comment 13th from the top).
R. Gates, can you elaborate on your comment on the short data range? As you can see from Steve’s linked figure, Arctic Ice is close to the mean and within +/- 1 STD of the 1979-2006 period. How is that not normal?
Could I propose a toast to negative drift?
When R gates says the graph is now 2008 etc below, its just like me saying in March was above to prove AGW does not exist… complete nonsense. BUt anyway these guys don’t know how much they are helping the skeptics cause by making statements like this
R. Gates,
This looks pretty close to normal to me.
http://arctic-roos.org/observations/satellite-data/sea-ice/observation_images/ssmi1_ice_ext.png
Squarebob Spongepants says:
May 9, 2010 at 9:36 am
“Imagine being chilled to the very bone; where every step brings pain and discomfort; where there is no way of getting respite from a permanently aching back”
Sounds like living in the post-Labour UK as you approach retirement.
———————————————————————————————-
Hopefully the Goodwill and Salvation Army type stores in England are stocked up with books. Someone has to show some mercy to these poor pensioners. Politicians won’t.
Joe Bastardi is forecasting quick cooling in the earth over the next 9 to 12 months and below normal temperatures for Alaska in Nov, and Dec of 2010, and Jan 2011 from La Nina. IMO, this will add to the effect on Arctic Ice of cool Pacific waters. Arctic Ice should continue in a growing trend in the 2010/11 Northern Hemisphere winter.
Joe Bastardi on video:
http://www.accuweather.com/video/83060117001/sink-o-de-nino-the-rapid-collapse-of-el-nino.asp?channel=vblog_bastardi
He also thinks that about 15 months from now temperatures worldwide, in general, will be in negative anomaly.
R. Gates says:
“Still, your reports are amusing, even if you left out the fact that arctic sea ice is currently below level seen in 2008 and 2009 for the same date.”
Umm… no it isn’t. One doubtful data set shows a bit below 09 the other doesn’t, still above 08 by a lot. What the heck are you lookin at?
You can purchase the Catlin theme song here.
http://tinyurl.com/23awkjq
And I wonder who it was who commented, back in the January/February timeframe, that the ice extent was below the 2007 level? Hmmmmm……
Steve is performing a valuable service with this weekly update, to counter all the gnats and naysayers who keep on pushing the same old tired message of global catastrophic doom and other assorted and sundry lies.
At least Miss Pamela of the northwest US has her head screwed on straight.
R. Gates says:
May 9, 2010 at 9:44 am
“Still, your reports are amusing, even if you left out the fact that arctic sea ice is currently below level seen in 2008 and 2009 for the same date.”
You are not being very scientific yourself, Mr. Gates…..in fact it looks a bit , how shall I put it… it looks like you are dissappointed? World isnt ending, after all?
I have to tell you people (Steve included) that Bastardi is STILL predicting that the melt will be pretty spectacular, but not as bad as 2007 – so the greens will make capital out of it, and we should be prepared to take it on the chin. However, Bastardi also predicts that recovery will be good. The melt we are about to witness is due to the El Nino. Report here under ‘Friday May 7’: http://www.accuweather.com/world-bastardi-europe-blog.asp?partner=accuweather
of the 1979-2006 period. How is that not normal?
Ian E says:
May 9, 2010 at 11:47 am
Could I propose a toast to negative drift?
Why certainly….CHEERS!
What would Catlin report if they found that Arctic sea acidity hasn’t changed in the last decade?
Our acidity test kits had broken down (remember their radar debacle).
I hate being a cynic but I have to apply a good dose of the stuff plus sceptism when I’m dealing with shady characters.
The Ghost Of Big Jim Cooley
Please make note of my forecast and Bastardi’s, and let’s see who was more accurate come September.
“Imagine being chilled to the very bone; where every step brings pain and discomfort…”
Going to the Arctic and complaing about the cold is like taking a vacation to a south seas island and complaining of the heat. Wouldn’t you learn to take cold weater gear and not a swimsuit?
“…where there is no way of getting respite from a permanently aching back…”
Trying to carry the weight of the whole world on your back will do that to you.
“…where hauling a sledge twice your body weight is like dragging a car with the handbrake on…”
Pack lighter next time. If they had flown there on a commercial airline, they wouldn’t have a problem with overweight luggage. Next time, to get in shape, take a couple of two-year-olds to Disney World. That will make hauling that sledge a whole lot easier.
“…and where, despite trekking for over eight hours in the type of biting winds that feel like being relentlessly pecked at by invisible crows, you are getting nowhere…”
Tell us about it. We’ve been trying to tell the truth about AGW for quite a while now…
Dropping. Like. A. Brick. Down. Onto. Anu’s. Head.
…where hauling a sledge twice your body weight is like dragging a car with the handbrake on…
You can do that with those tiny micro-cars like you find in Europe? I knew they were lightweight, but come on now! They must be pretty easy to steal, just get some big guys to toss one on the bed of a Ford F150 and go.
Of course, if you’re really talking about a car with the handbrake on resting on shiny ice, with firm footing you could possibly push it along, with one hand. So what are they whining about?
kadaka,
Speaking of tiny micro-cars, check these out.
A technical description of the car’s transmission.
Re: Smokey on May 9, 2010 at 4:05 pm
Except I’m still on dial-up so I don’t “do” YouTube…
But hey, it’s the thought that counts!