By Steve Goddard

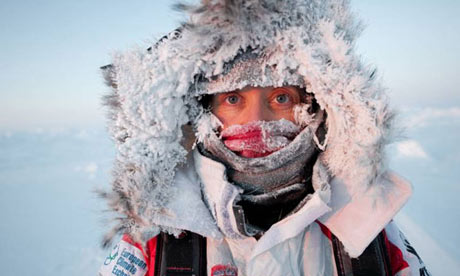
Guardian photo : Ann Daniels Enjoying The Warming Arctic
Yesterday, WUWT reported on a University of Melbourne study claiming that melting ice is behind the warming of the Arctic.
“Findings published in Nature today reveal the rapid melting of sea ice has dramatically increased the levels of warming in the region in the last two decades. The sea ice acts like a shiny lid on the Arctic Ocean. When it is heated, it reflects most of the incoming sunlight back into space. When the sea ice melts, more heat is absorbed by the water. The warmer water then heats the atmosphere above it.”
If this were true, we would expect to see that months with the most ice loss would also show the most warming. In fact, we see the exact opposite. As you can see in the graph below, most Arctic warming from 1979-present has occurred in the winter and spring, with very little warming during the summer.
")
By contrast, ice extent trends over that same time interval show that ice loss has occurred mainly during the summer. It appears that the relationship between warming and ice loss is inconsistent with the claims in the University of Melbourne study. Temperatures have increased the least during times of year when ice loss was the greatest.
")
April is the month which has warmed the most, a full seven months after September – the month of peak ice loss. There is very little variation in ice extent year over year during April – except for this year which is running well above any other recent years.

http://ocean.dmi.dk/arctic/icecover.uk.php
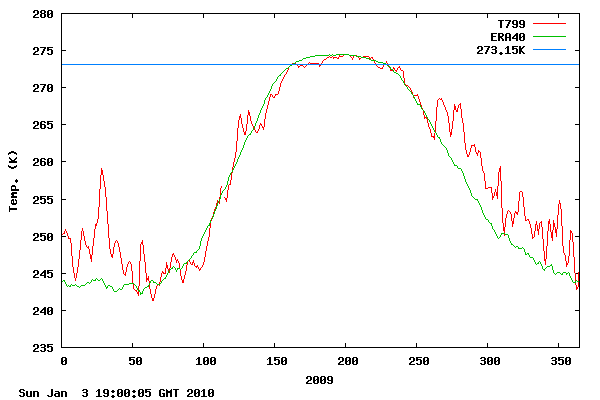
A couple of other familiar graphs showing the same issues can be seen below. Note in the DMI graph below that Arctic temperatures have not warmed at all during the summer in the central Arctic.

In the Cryosphere Today graph below, you can see that most ice loss has been during the summer, when there has been little or no temperature gain.

The scatter plot below shows Arctic temperature trends vs. the absolute value of ice extent trends, for all 12 months. Note that there is no meaningful correlation between temperature trends and ice loss. In fact, the months with the most increase in temperature seem to be the ones with little ice loss.

The article claims
” Strong winter warming is consistent with the atmospheric response to reduced sea ice cover.”
But this is inconsistent with the fact that there has been very little reduction in winter ice cover. The temperature of water under the winter sea ice is fixed by thermodynamics at -2C down to a depth of tens of metres, and does not vary from one year to the next. Furthermore, the rate of heat transfer through 2-5 meter thick 99+% concentration ice, is very low. NSIDC is currently showing ice extent right at the 1979-2000 mean, and above the 1979-2009 mean – yet temperatures in the Arctic have been well above the mean all through the spring. How is the heat escaping through all the thick, high concentration ice?

http://ocean.dmi.dk/arctic/meant80n.uk.php
The article also claims :
“reduced summer sea ice cover allows for greater warming of the upper ocean….The excess heat stored in the upper ocean is subsequently released to the atmosphere during winter.”
There is a major problem with that theory. The summer minimum occurs at the autumnal equinox when the Arctic is receiving almost no SW radiation, and that which is being received is well below the critical angle of water. By September, the shortage of insulating ice cover is actually causing a net loss of heat from the ocean. NSIDC explains it like this:
“In the past five years, the Arctic has shown a pattern of strong low-level atmospheric warming over the Arctic Ocean in autumn because of heat loss from the ocean back to the atmosphere. …. As larger expanses of open water are left at the end of each melt season, the ocean will continue to hand off heat to the atmosphere.”

In other words, loss of summer ice should produce atmospheric warming in the autumn, but not in the winter and spring when ice is cover is normal or near normal.
Two years ago, WUWT published this article after review by Walt Meier at NSIDC, Roger Pielke Sr. at CU, and Ben Herman at the University of Arizona. It explains why changes in ice cover probably are causing a net cooling effect. None of the reviewers had any substantive disagreements with the conclusions.
Conclusion: The University of Melbourne study claims are not supported by the available data. The authors seem to have jumped right into statistical analysis without proposing a physical mechanism that works. Heat flows across differences in temperatures, yet the winter water temperature under the ice is fixed at -2C. Thus elevated winter air temperatures should actually cause a reduction in heat flow out of the ocean. Whatever is driving increases in winter Arctic temperatures is not heat coming out of the Arctic Ocean, which is covered with insulating ice.
A more logical conclusion would be that the decline in ice thickness is associated with warmer winter temperatures.
If scientific reasoning were limited to the logical processes of arithmetic, we should not get very far in our understanding of the physical world. One might as well attempt to grasp the game of poker entirely by the use of the mathematics of probability.
– Vannevar Bush
Discover more from Watts Up With That?
Subscribe to get the latest posts sent to your email.
jeff brown says:
May 3, 2010 at 7:12 pm
Thanks, Jeff. For me, I prefer observations (you know, facts) to computer model results. And since that site has nothing but computer model results, I fear that it doesn’t help us.
Which is likely why Steven Goddard’s MSU satellite data shown in the head post shows something different from the computer model results that you referred to above … and when computer models and observations disagree, I know which one I pick.
On the other issue, you say:
Yes, less ice means more open water. And yes, that will absorb marginally more solar energy … but little of the energy in the Arctic is from absorbed solar energy. Remember that in September at 80°N, the sun is only 10° above the horizon, so differences in albedo matter very little. Most of the energy is from infrared radiation and from heat transported in from the tropics. And the ice doesn’t change those, in fact, ice is a better absorber of IR than water … and a good chunk of the Arctic energy is coming from IR. So the net change is not all that great.
In addition, more open water means more energy loss via radiation, conduction, convection, evaporation and transportation. All of these cool the surface, and reduce the effect that you discuss.
Next, more evaporation means more snow, and the albedo of snow is much higher than that of ice. It also covers the ground, and greatly increases the albedo of the ground.
What is the net of all of these effects? I don’t know … but it certainly is not as simple as you imply, that less ice = a significant amount of additional heat.
Alright jeff brown, let’s go through your post.
My Item 1, as worded by the scientist, as the ice is heated it reflects most of the incoming solar radiation back into space. In reply, you supplied a discourse on how when the ice is heated it will reflect decreasing amounts of incoming solar radiation, mentioning how unheated or cooling ice (has small-grain dry new snow) reflects the most. To me, that sure sounds like you just contradicted the scientist’s own words.
Item 2, as worded by the scientist more heat is absorbed by the ocean when the sea ice melts, no time lag indicated. While the ice is melting the ocean is absorbing more heat. In reply you ignore that wording issue and indicate there is a time lag, to wit: “This is when the ice has disappeared and the ocean is what is now absorbing the sun’s energy instead of the ice.” To me, that sure sounds like you have just confirmed the problem with the wording.
At the end you say: “In the actual paper I don’t think the wording was wrong, but in the press release maybe. That shows more the problem of communication of science by journalists than anything else.” The major problem with that being that Dr James Screen’s own statement is what is being discussed. Thus we are examining a problem of communication of science by a scientist, with you essentially providing the assumption that the scientist really did mis-word a statement about his own work, rather than correctly wording what his results were.
And I believe journalists with their alarmists headlines are one of the major problems in effectively communicating science.
And on this we do have agreement.
suricat says:
May 3, 2010 at 3:04 pm
Phil. says:
May 3, 2010 at 8:12 am
“The normally accepted limit for photosynthesis is ~650 feet. In open ocean water the light level drops to ~1% of surface value at ~200m.”
Perhaps I’m reading the data that I linked to wrongly?
Page 63, figure 2.13. I see the blue spectral band of the VIS spectrum as dropping to ~10^-2 (~100 metres), with UVa ascending the graph. Thus, at ~100 metres depth a power rating of 1 w/m^2 at the surface becomes 0.5 w/m^2, or is subjected to a 50% attenuation. At ~200 metres the power rating only drops to 25% of the surface value.
The introductory part of the book is missing so I’m assuming that the coefficient given is the decadic absorption coefficient i.e.:
Absorption=10^-(a*depth in m)
therefore in the blue a≅10^-2 and d=200m A=10^-2.
HTH
Phill.
Thanks for your help, but your post didn’t pass all the ‘translation’ tests (what may be a vital symbol is missing).
Nevertheless, it seems that you consider the graphic to represent ‘depth to total absorption’ (path to extinction). As an engineer, I don’t understand why people use this measure, as the path to extinction has a log dependency on the strength of the source (also depending on what is considered to be the ‘extinction amplitude’). Thus, it varies with both the strength of the source and the extinction value. I would normally work with distance to a 50% attenuation of ‘the signal’, as the term offers greater scope for interpolation purposes.
It took me ages to find online data of ‘that window’. Guess I need to keep looking for something that’s more verifiable. 🙂
BTW, what does ‘HTH’ mean? Is this the acronym of your given name, or something else? My pseudonym here of ‘suricat’ was first generated at the (now defunct) C4 Eve forum where everyone was advised not to use their given name, so I used an old nickname that I was given whilst I was in Belgium. I’ve continued using it for recognition purposes, but my given name is Ray Dart. Perhaps I’ll post with that in the future, but it means altering so many different site details, so I’m reluctant to do so and may only add this as a suffix. Again, thanks for your help. 🙂
Best regards, suricat (Ray Dart).
Phil.
Please excuse my stupid bad spelling of your online identity.
Best regards, suricat (Ray Dart).
suricat says:
May 4, 2010 at 4:21 pm
Phill.
Thanks for your help, but your post didn’t pass all the ‘translation’ tests (what may be a vital symbol is missing).
Nevertheless, it seems that you consider the graphic to represent ‘depth to total absorption’ (path to extinction). As an engineer, I don’t understand why people use this measure, as the path to extinction has a log dependency on the strength of the source (also depending on what is considered to be the ‘extinction amplitude’). Thus, it varies with both the strength of the source and the extinction value. I would normally work with distance to a 50% attenuation of ‘the signal’, as the term offers greater scope for interpolation purposes.
No I regard it as the absorption coefficient, which forms part of the exponent in the expression for absorption.
Since the symbols apparently didn’t show up for you I’ll try to express it in words.
The absorption is given by ten raised to the power -(a*depth)
BTW, what does ‘HTH’ mean?
Sorry, too much texting, ‘Hope that helps’.
[snip] Repeated use of the d-word.