By Steve Goddard

Guardian photo : Ann Daniels Enjoying The Warming Arctic
Yesterday, WUWT reported on a University of Melbourne study claiming that melting ice is behind the warming of the Arctic.
“Findings published in Nature today reveal the rapid melting of sea ice has dramatically increased the levels of warming in the region in the last two decades. The sea ice acts like a shiny lid on the Arctic Ocean. When it is heated, it reflects most of the incoming sunlight back into space. When the sea ice melts, more heat is absorbed by the water. The warmer water then heats the atmosphere above it.”
If this were true, we would expect to see that months with the most ice loss would also show the most warming. In fact, we see the exact opposite. As you can see in the graph below, most Arctic warming from 1979-present has occurred in the winter and spring, with very little warming during the summer.
")
By contrast, ice extent trends over that same time interval show that ice loss has occurred mainly during the summer. It appears that the relationship between warming and ice loss is inconsistent with the claims in the University of Melbourne study. Temperatures have increased the least during times of year when ice loss was the greatest.
")
April is the month which has warmed the most, a full seven months after September – the month of peak ice loss. There is very little variation in ice extent year over year during April – except for this year which is running well above any other recent years.

http://ocean.dmi.dk/arctic/icecover.uk.php
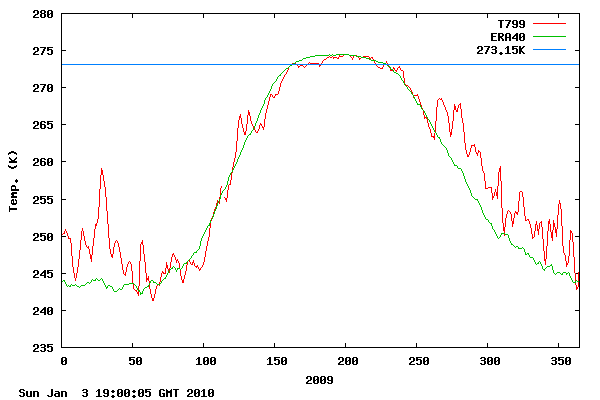
A couple of other familiar graphs showing the same issues can be seen below. Note in the DMI graph below that Arctic temperatures have not warmed at all during the summer in the central Arctic.

In the Cryosphere Today graph below, you can see that most ice loss has been during the summer, when there has been little or no temperature gain.

The scatter plot below shows Arctic temperature trends vs. the absolute value of ice extent trends, for all 12 months. Note that there is no meaningful correlation between temperature trends and ice loss. In fact, the months with the most increase in temperature seem to be the ones with little ice loss.

The article claims
” Strong winter warming is consistent with the atmospheric response to reduced sea ice cover.”
But this is inconsistent with the fact that there has been very little reduction in winter ice cover. The temperature of water under the winter sea ice is fixed by thermodynamics at -2C down to a depth of tens of metres, and does not vary from one year to the next. Furthermore, the rate of heat transfer through 2-5 meter thick 99+% concentration ice, is very low. NSIDC is currently showing ice extent right at the 1979-2000 mean, and above the 1979-2009 mean – yet temperatures in the Arctic have been well above the mean all through the spring. How is the heat escaping through all the thick, high concentration ice?

http://ocean.dmi.dk/arctic/meant80n.uk.php
The article also claims :
“reduced summer sea ice cover allows for greater warming of the upper ocean….The excess heat stored in the upper ocean is subsequently released to the atmosphere during winter.”
There is a major problem with that theory. The summer minimum occurs at the autumnal equinox when the Arctic is receiving almost no SW radiation, and that which is being received is well below the critical angle of water. By September, the shortage of insulating ice cover is actually causing a net loss of heat from the ocean. NSIDC explains it like this:
“In the past five years, the Arctic has shown a pattern of strong low-level atmospheric warming over the Arctic Ocean in autumn because of heat loss from the ocean back to the atmosphere. …. As larger expanses of open water are left at the end of each melt season, the ocean will continue to hand off heat to the atmosphere.”

In other words, loss of summer ice should produce atmospheric warming in the autumn, but not in the winter and spring when ice is cover is normal or near normal.
Two years ago, WUWT published this article after review by Walt Meier at NSIDC, Roger Pielke Sr. at CU, and Ben Herman at the University of Arizona. It explains why changes in ice cover probably are causing a net cooling effect. None of the reviewers had any substantive disagreements with the conclusions.
Conclusion: The University of Melbourne study claims are not supported by the available data. The authors seem to have jumped right into statistical analysis without proposing a physical mechanism that works. Heat flows across differences in temperatures, yet the winter water temperature under the ice is fixed at -2C. Thus elevated winter air temperatures should actually cause a reduction in heat flow out of the ocean. Whatever is driving increases in winter Arctic temperatures is not heat coming out of the Arctic Ocean, which is covered with insulating ice.
A more logical conclusion would be that the decline in ice thickness is associated with warmer winter temperatures.
If scientific reasoning were limited to the logical processes of arithmetic, we should not get very far in our understanding of the physical world. One might as well attempt to grasp the game of poker entirely by the use of the mathematics of probability.
– Vannevar Bush
Discover more from Watts Up With That?
Subscribe to get the latest posts sent to your email.
(I am posting this for a second time, delete if the first posting was actually successful)
Is it appropriate to simply compare between months within a year (see first 2 bar graphs)?
Is this is only considering seasonal effects?
Would it be more appropriate to look for relationships between temperature anomalies (also consider time lags and seasonal corrections) and time points having equal ice extent using many years of data?
jeff brown says:
May 1, 2010 at 8:34 am (Edit)
You seemed to be responding to something I had said … but you didn’t say what it was you were responding to. You had said:
What did I say, that you were replying to by telling me to “go to NCEP’s web pages and …”
w.
Ulric Lyons says:
May 1, 2010 at 8:57 am
“This would project to the AO being in a positive phase till 2035, exceptions aside.”
“What really bothers me is not loss of Arctic ice, but cold Northern Hemisphere winters.
Deterministic seasonal forecasts for the next 20 years anybody? I jest not.”
Here’s a broad forecast of temperatures for the next 100y based on our somewhat sketchy, proxy-ridden temperature history. This is based on solar activity and long-term weather quasi-cycles. However, because deterministic chaos drives our weather systems it can only show broad relative temperatures, also the timing is not exact. As long-term weather is self similar at all time scales, I expect the temperature within the next 100y will still oscillate up and down, but it will be cooler overall than we experienced in the previous century.
1410-1500 cold – Low Solar Activity(LSA?)-(Sporer minimum)
1510-1600 warm – High Solar Activity(HSA?)
1610-1700 cold – (LSA) (Maunder minimum)
1710-1800 warm – (HSA)
1810-1900 cold – (LSA) (Dalton minimum)
1910-2000 warm – (HSA)
2010-2100 (cold???) – (LSA???)
My prediction is that there will be an overall cooling during the next 25y compared to the last 15y temperature plateau and this will occur mainly during the NH winter. The Arctic sea ice will return to the levels seen forty years ago – the Antarctic sea ice will have a slight decline. NH farmers will revert to traditional ‘cold temperate zone’ short season crops pushing up the price of grain – swede for dinner anyone?
However. I don’t envisage any winter skating on the Thames or frost fairs, as our health and safety concious government will never let them happen!
Thanks for the link to the solar wind data, Ulric, I’ll have a play with the numbers tomorrow.
In these Annual Zonal Mean Time Series maps; http://www.cpc.ncep.noaa.gov/products/stratosphere/strat-trop/
the N.H temperature anomaly (T anom) series shows some very long lasting +ve anomalies occurring Jul/Aug/Sep at lower altitudes, from 1998 onwards, and also in 1989-91.
Tenuc says:
May 1, 2010 at 4:24 pm
Chaos means change, there are a couple of us who understand what causes these changes in weather and climate. Piers`s SWIP`s are very accurate for predicting weather events worlwide, and are determined purely by predicting spikes in solar activity. I collect the regional data for these forecasts.
My temperature forecasts, also based on the solar signal, are formed from the ability to hindcast through 350yrs of CET and explain most monthly anomalies, and the cause of all the coldest N.H. winters in the last 1500 years, such as when the two times the Nile froze, and the several times the Euphrates froze.
Timing for temperature forecasts can very accurate, within a couple days, quite often.
Ask Gabe who runs climaterealist.com, he has been badgering me for months to put my forecasts on my own section on his site, as he has been so impressed by them.
If you are interested as to how I do it, all I will tell you now, is that its very similar to how Kepler used to do it, but I have not studied his methods.
“
wobble says:”April 30, 2010 at 11:29 am
I just don’t understand how any credible scientist can really believe that the earth’s climate system is so unstable.
“Weebles Wobble but they don’t fall down!”
httpv://www.youtube.com/watch?v=qq0OQBdIhsc
R. Gates says:
Thanks for a most interesting site, R. Gates. I was surprised to see that as of today (May 1) the ice there is still thickening. It’s presently at 1.32 metres.

w.
Willis,
Right you are. I posted this site in response to Steve Goddard’s comment that the ice in the area was at least “10 feet thick” and so he could believe that there would be open ocean this summer in the area. Of course there will be open ocean as the melt season hasn’t hit Barrow yet, and this 4 ft of new winter ice will melt very fast…but you’ll have to wait until June and July to see how fast.
Nature: “When the sea ice melts, more heat is absorbed by the water. The warmer water then heats the atmosphere above it.”
Goddard: “If this were true, we would expect to see that months with the most ice loss would also show the most warming. In fact, we see the exact opposite.”
What Goddard implies is that if more area is ice free and warming faster, then the most ice-free time of year should have experienced a greater warming over the years . Verbally, this argument “sounds logical” and “convincing”. Unfortunately even brief consideration of the physics refutes it.
The reason that September open ocean shows less of a temperature change than April ice cover is that the ocean has a much larger mass to absorb the solar energy than the atmosphere and the surface of the ice, and a much greater heat capacity per pound. Consequently all that extra solar energy absorbed only produces a small increase in the open ocean temperature in summer.
Water has a heat capacity of 1 Btu per pound, roughly twice that of ice and four times that of air. This means that the same amount of energy absorbed by a mass of water will inherently produce significantly less temperature increase than the same mass of ice or air. (The UAH temperature data are atmospheric temperatures.)
Secondly, obviously ice is not liquid. Sunlight striking the ice surface mainly warms only the surface of the ice because the ice does not mix and heat transfers by slow conduction rather than by fast convection. In contrast, sunlight directly penetrates water down to 100-200 meters, directly warming to that depth (mostly near the surface). In addition, the water mixes, so that heat is distributed efficiently throughout the top 100 meters of ocean by convection. Therefore the amount of sunlight at the April equinox warms the lower atmosphere and a small amount of ice at the surface, whereas the same amount of energy at the September equinox is distributed into air and a much greater mass of water.
Therefore, when you combine the much greater mass of water plus air heated by the sun in the open ocean (Sept) vs. the much smaller mass of ice/air on an ice sheet (April), divided by water’s greater heat capacity and therefore smaller “sensitivity” to energy input, and divided by ice’s lower absorptivity, it is still possible to have a higher year-over-year temperature increase in April than in September based on very simple laws of physics.
The problem with Goddard’s logic is that UAH atmospheric temperature DOES NOT EQUAL energy absorbed. It equals energy absorbed divided by mass and heat capacity and is thus comparing apples with elephants. Even within that graph, the mechanism producing temperature in April is different from the mechanism producing temperature in September, so temperature alone only tells part of the story. Because the September open ocean condition is physically dividing energy absorbed by a much larger number of both mass AND heat capacity (vs April ice) to physically arrive at temperature, the temperature increase comes out lower in September than in April, EVEN THOUGH three times more energy is absorbed by the ocean in September than by the ice in April.
Regrettably for Mr. Goddard, this shows that he does not seem to have even a basic understanding of the physics of climate change, and yet half the people commenting on his blog regard him as if he’s some kind of scientific authority. It also shows the great risk of drawing wrong conclusions from the thoughtless application of statistical methods. There is a REASON why PhD scientists, like medical doctors, have to spend 8 or 10 years or more on higher education and training. Surely you would not hand a blogger a scalpel and say “go study for a few hours and then fix my heart attack”. For the very same reason, neither should we put our complete trust in bloggers’ analyses of climate change!
Steve,
In re April 30, 3:36 PM: To points…
You say “there is no conduit for heat to move from the Arctic Ocean to the atmosphere during the winter”.
But there is. The surface of the ice is extremely cold in winter. Inevitably this draws heat out of the ice and cools the underside of the ice, causing more fresh water to freeze out of the ocean onto the underside of the ice sheet. The ocean temperature remains relatively constant because the ice will freeze at a near constant temperature. Seawater densified by the freezing out of fresh water sinks, exposing the bottom of the ice sheet to more “fresh” sea water. Of course, the heat transfer from the ocean is dramatically reduced in the winter because there is no evaporation and because of the insulating effect of the ice.
You also said: “There is little landmass around to absorb incoming UV, so the atmosphere over ice remains cold all summer in the Arctic Basin.”
Never thought about increased effect of UV in the Arctic or Antarctic due to “ozone hole” effects. Wonder what that does??
However, ice has a high albedo – it reflects lots of the sunlight that hits it, not just UV but all frequencies. Fresh snow is even more reflective. Water has a low albedo – it absorbs most of the radiation that hits it. So ice effectively gets three or more times less energy than the arctic ocean at the exact same latitude. (It may interest your readers to know that at the summer solstice, the poles receive the most incoming daily solar radiation of any place on the planet at any time of the year, even more than the equator! The south pole receives even more than the north pole because the Earth is closer to the sun in December than July. Nevertheless, the ice remains frozen thanks to low air temperature because so much of that light is reflected back into space by snow and ice. )
Also, ice is like land in the desert. You may have heard that it gets very cold in the desert at night even though it may be scorching during the day. That is because the air is very dry and there is very little water vapor (greenhouse gas) to block the radiation trying to leave for space, and also because dry ground doesn’t hold much heat and cools down very rapidly. (It’s low heat capacity, and lack of water, is also why its temperature gets so high during the day.) Similarly, it will get very cold at night on an ice sheet if there are no clouds. Unlike the desert, the ice surface doesn’t heat up too much during the day because it reflect so much more light back into space. In contrast, the summer Arctic ocean is warmer than the ice to start with, courtesy of its lower albedo, and it has more water vapor above it than the ice, thanks to liquid water being both present and above freezing, so it has more of a greenhouse effect above it at night, and it has a large flowing, convecting heat sink tens of meters deep so that its surface temperature changes much less from day to night.
From R. Gates on May 2, 2010 at 12:15 am:
Right you are. I posted this site in response to Steve Goddard’s comment that the ice in the area was at least “10 feet thick” and so he could believe that there would be open ocean this summer in the area.
That comment seems to be at a different article, can’t find it here. But in any case…
This site?
So to counter a comment about “10 feet thick” ice, which would sure seem to indicate multi-year and/or pack ice, you point to where they are monitoring acceptably-stable landfast first-year ice?
Excerpts from: Jbar on May 2, 2010 at 9:21 am
My, such a strong statement in that first part! You should have highlighted it, that would have saved some people the trouble of wading through the rest of your long comment.
His blog? Has all of two posts on it with only two comments, both at the latest post. One is commenting on the local weather, the other briefly mentions something not in the post.
Oh, we’ve discussed here about such “thoughtless applications” many times, when reviewing the work of Michael Mann, James Hansen, many other prominent climate scientists. It’s quite amazing how they have gotten by with screw-ups that big for so long. Maybe they can audit some stats courses and figure out how to get things right.
Well then, until we have confirmation that you have such an advanced education in climate science, by your own words you are unqualified to comment about how wrong or right Steven Goddard’s work with regards to climate science actually is. Thus until such confirmation is provided, your critiques have no value and can be ignored.
Good bye!
Kadaka, I suggest you read Jbar’s two posts in detail. They explain why Steve Goddard’s conclusions in this blog post are invalid. I don’t know where you live, but living in CO mountains I can tell you that even though the solar input is maximum in June, temperatures here don’t really get warm until July and August, well past the solar maximum and in September, temperatures can be just as warm as in June despite the sun being lower in the sky than in June. Think about why that is and then tell me how Steve Goddard’s conclusion:
“If this were true, we would expect to see that months with the most ice loss would also show the most warming. In fact, we see the exact opposite.
can possibly be valid.
jeff brown says:
May 2, 2010 at 3:04 pm
I can’t answer for Steve. But as you point out, we see a good temperature rise by June, with the max temp a month or so after the peak insolation.
So we should see the same thing with ice loss, with warming in September and more warming in October and November.
Perhaps you could point that out in the data …
Willis, if you go to NCEP’s interactive web pages, you can plot anomalies in near surface air temperature (I recommend 925 mbars), or you can also plot anomalies for the entire atmospheric column. If you do this for say seasons (SON-autumn, DJF-winter, MAM-spring, JJA-summer), you will see the season of the most warmth. I looked at the anomalies for the last 5 years relative to a 1979-2009 mean since the satellite data record is the most accurate and I focused on 60-90N, but you can use any latitude bands. I would attach images here if I knew how to do that. But their web site is very easy to use.
Spring-time warming is likely a result of atmospheric circulation changes and cloud cover. Winter-time warming should be mixture of atmospheric circulation changes and some reduction in the winter ice concentrations (note the differences in vertical structure of the warming signal for autumn compared to winter and spring).
This is why I believe there is an autumn amplified warming signal related to loss of summer ice.
kadaka (KD Knoebel) says:
May 2, 2010 at 1:03 pm
“Thus until such confirmation is provided, your critiques have no value and can be ignored.
Good bye!”
That’s a bit harsh kadaka. There’s a lot of viable dialogue there. Wouldn’t it be better to sort the ‘chaff from the wheat’ by discussion?
Best regards, suricat.
suricat said on May 2, 2010 at 5:08 pm:
That’s a bit harsh kadaka. There’s a lot of viable dialogue there. Wouldn’t it be better to sort the ‘chaff from the wheat’ by discussion?
Best regards, suricat.
Perhaps, but the repetitive nonsense gets annoying. And visually that was just one long spewing, with the obligatory “You’re an uneducated moron, you do not possess the sacred knowledge only many years of study will yield!” stuck in there. Thus there sure didn’t seem to be an attempt at honest dialogue in there.
So, cut to the chase. You make the appeal to authority, state how only those with the long training in the sacred climatology tradition may speak of climatology, then show you have that training or sit down and shut up. Well, you can parrot what a climatologist said, but no analysis allowed as you’re not qualified.
This is a valid and logical approach to take, and if commentators are going to seriously challenge someone else’s logic then they should stick to their own logic first and foremost. That’s only fair.
From jeff brown on May 2, 2010 at 3:04 pm:
(…) Think about why that is and then tell me how Steve Goddard’s conclusion:
“If this were true, we would expect to see that months with the most ice loss would also show the most warming. In fact, we see the exact opposite.
can possibly be valid.
Gee, let’s see now…
First we go back to Dr James Screen’s statement in the press release:
Item 1: On the straight reading, sea ice reflects most of the incoming sunlight back into space when it is heated. So unheated or cooling sea ice doesn’t reflect like that? He should have worded that better if he was not implying such.
Item 2: When the sea ice melts, as in right then as it is occurring, more heat is absorbed by the water. He said “when,” not “after,” there is no time lag indicated in the wording. Thus, as Steve Goddard worded it, ““If this were true, we would expect to see that months with the most ice loss would also show the most warming.” His statement is valid.
You have pointed out there is a time lag between maximum solar input and the most warmth. Mr. Goddard has pointed out the same thing, and shown how much longer the lag is, which comes from the ice having to melt first before the water temperatures can go up. You in the Colorado mountains and I in central Pennsylvania have a shorter lag as basically we only have to wait until the oceans in the Northern Hemisphere warm up. Even Jbar, deep in the many words, is pointing out there is a lag.
So we all agree there is a lag. By the wording supplied by that scientist, there is no lag. So basically we have all agreed that scientist is wrong.
BTW, from Jbar on May 2, 2010 at 9:21 am:
The incoming sunlight will be at a very shallow angle to the surface. When it hits the water, provided the angle is great enough that the light doesn’t reflect off it, due to the differences in the indexes of refraction it will enter the water at a steeper angle. Even then the angle is still rather shallow, to achieve a vertical penetration of 100-200 meters the sunlight would have to travel quite a bit further than 100-200 meters through the water.
I’m not exactly sure what definition Jbar is using for “directly penetrates,” but offhand it seems that would have to be some mighty clear water for light to travel that far. Thus his statement and reality, to me at least, do not seem to be in agreement. If you can find something that supports his statement then please post it. Then I may explore the other little bits of what he’s said that I am finding questionable. 😉
jeff brown says:
May 2, 2010 at 4:18 pm
Well, I just wandered all around the NCEP web site and couldn’t find any such page … could you provide a URL?
Thanks,
w
JER0ME says:
May 1, 2010 at 4:08 am.
“OK, fair enough to some extent, but I am seeing a figure of 100 m in ‘pure’ seawater (whatever that may be – as you say, it is difficult to find, although the author seems to have found some (I lost the name of the sea)).”
Probably the ‘Sargasso’, it has less particulates, but is also full of weed.
100m is what you see, but I see more like ~300-400m to extinction in a realistic scenario at the Arctic (healthy discourse for the inclusion of particulates). Let’s not forget that salinity, gas absorption and phase change (between ice and water) doesn’t alter the reactance of H2O to EM radiation to any marked degree.
“Assuming this is correct, and I would probably only be able to read a page of that lot without nodding off, skimming that section did not mention ice apart from to lump it in with liquid water once.”
While I’ll admit that it took several reads by me to partly understand the data, I persisted. My conclusion was that deep ocean energy was increased via a ‘window’ of blue vis and UVa spectra, initialised by water and ice per se (where atmospheric conditions and insolation permit). There’s a graph describing ice absorption on page 70, figure 2.15. This almost mimics its liquid water counterpart.
“You can’t normally see through it AT ALL, let alone a few cm, except in rare circumstances.”
You wouldn’t expect coherence, only a level of illumination at a specific spectral band that proves the transmission of energy.
Just a word on the Arctic ocean/atmosphere interface. Ocean ice cover is a radiative barrier to IR ocean warming, a barrier to convection at ocean surface and, thus, greatly prohibits ocean surface evaporation. I can’t see any scenario where this will ‘not’ affect cloud albedo and surface temperature. More ice, less cloud, raised surface temperature and less ice, more cloud, lowered surface temperature. Then take into account ocean currents, it’s not surprising that Arctic ice cover seems to be cyclical.
Sorry for the delayed response, just noticed your last post. 🙂
Best regards, suricat.
The normally accepted limit for photosynthesis is ~650 feet. In open ocean water the light level drops to ~1% of surface value at ~200m.
Phil. says:
May 3, 2010 at 8:12 am
“The normally accepted limit for photosynthesis is ~650 feet. In open ocean water the light level drops to ~1% of surface value at ~200m.”
Perhaps I’m reading the data that I linked to wrongly?
Page 63, figure 2.13. I see the blue spectral band of the VIS spectrum as dropping to ~10^-2 (~100 metres), with UVa ascending the graph. Thus, at ~100 metres depth a power rating of 1 w/m^2 at the surface becomes 0.5 w/m^2, or is subjected to a 50% attenuation. At ~200 metres the power rating only drops to 25% of the surface value.
Am I reading the graph correctly? To save you searching back up the thread, here’s another link:
http://books.google.com/books?id=C5kRs1z_CYoC&pg=PA56&lpg=PA56&dq=UV+absorption+of+water+vapour&source=bl&ots=bLYkuKb6z8&sig=ShuCKHswM8g8Axo3FbNG27gSi7w&hl=en&ei=7KqASrLnO8SMjAem5IH2CQ&sa=X&oi=book_result&ct=result&resnum=9#v=onepage&q&f=false
Best regards, suricat.
Willis, sure go here:
http://www.esrl.noaa.gov/psd/cgi-bin/data/composites/printpage.pl
from there you can also link to daily composites as well as time-series analysis. Have fun!
jeff brown Reur May 1, 2010 at 8:34 am
I’ve noticed that some of your wording is remarkably similar to that in a comment of nom de blog Wildred on an older WUWT thread as in item [2] below. Since there has been no response from Wildred, and you at least have similar interests, I thought I’d repeat my reply comment here:
Hi Kadaka…
to address some of your points:
1) First we go back to Dr James Screen’s statement in the press release:
“The sea ice acts like a shiny lid on the Arctic Ocean. When it is heated, it reflects most of the incoming sunlight back into space. When the sea ice melts, more heat is absorbed by the water. The warmer water then heats the atmosphere above it.”
Item 1: On the straight reading, sea ice reflects most of the incoming sunlight back into space when it is heated. So unheated or cooling sea ice doesn’t reflect like that? He should have worded that better if he was not implying such.
When the sea ice is covered by snow it will reflect 80-90% of the incoming solar radiation back out to space. So this is the case early in the melt season. As the snow melts, the grain sizes become larger and reduce the reflectivity of snow (say around 70%). When the snow melts off, and the bare ice is exposed the surface albedo is around 50-60%. During advanced states of melt, melt ponds lower the albedo even further, to say 40%. It’s not so much about the heat of the ice, as it is the physical characteristics of the actual grains. Small grains (like in dry new snow) reflect nearly 90% of the incoming solar radiation, the larger the grain size, the lower the reflectance.
2) Item 2: When the sea ice melts, as in right then as it is occurring, more heat is absorbed by the water. He said “when,” not “after,” there is no time lag indicated in the wording. Thus, as Steve Goddard worded it, ““If this were true, we would expect to see that months with the most ice loss would also show the most warming.” His statement is valid.
This is when the ice has disappeared and the ocean is what is now absorbing the sun’s energy instead of the ice. You can look at NSIDC’s web pages and look at trends in ice concentration (go to their sea ice index web pages). All summer months (and spring for that matter) show negative trends in sea ice concentration. This either implies (1) a decrease in sea ice (i.e. more open water), or (2) more melt ponds on the surface of the ice (that the passive microwave algorithm mistakes for open water instead of ice). If you were to download the NSIDC sea ice concentration data sets and compute for yourself the incoming solar radiation per pixel in the sea ice grid, you could compute for yourself the amount of absorbed solar radiation (assuming constant values of albedo for ice or open water). Note, you can compute the incoming solar radiation as a function of latitude and time of day for a first draft. The actual incoming solar radiation at the surface is of course modified by the atmosphere, but it’s a good place to start.
3) So we all agree there is a lag. By the wording supplied by that scientist, there is no lag. So basically we have all agreed that scientist is wrong.
In the actual paper I don’t think the wording was wrong, but in the press release maybe. That shows more the problem of communication of science by journalists than anything else. And I believe journalists with their alarmists headlines are one of the major problems in effectively communicating science.