By Steve Goddard

Guardian photo : Ann Daniels Enjoying The Warming Arctic
Yesterday, WUWT reported on a University of Melbourne study claiming that melting ice is behind the warming of the Arctic.
“Findings published in Nature today reveal the rapid melting of sea ice has dramatically increased the levels of warming in the region in the last two decades. The sea ice acts like a shiny lid on the Arctic Ocean. When it is heated, it reflects most of the incoming sunlight back into space. When the sea ice melts, more heat is absorbed by the water. The warmer water then heats the atmosphere above it.”
If this were true, we would expect to see that months with the most ice loss would also show the most warming. In fact, we see the exact opposite. As you can see in the graph below, most Arctic warming from 1979-present has occurred in the winter and spring, with very little warming during the summer.
")
By contrast, ice extent trends over that same time interval show that ice loss has occurred mainly during the summer. It appears that the relationship between warming and ice loss is inconsistent with the claims in the University of Melbourne study. Temperatures have increased the least during times of year when ice loss was the greatest.
")
April is the month which has warmed the most, a full seven months after September – the month of peak ice loss. There is very little variation in ice extent year over year during April – except for this year which is running well above any other recent years.

http://ocean.dmi.dk/arctic/icecover.uk.php
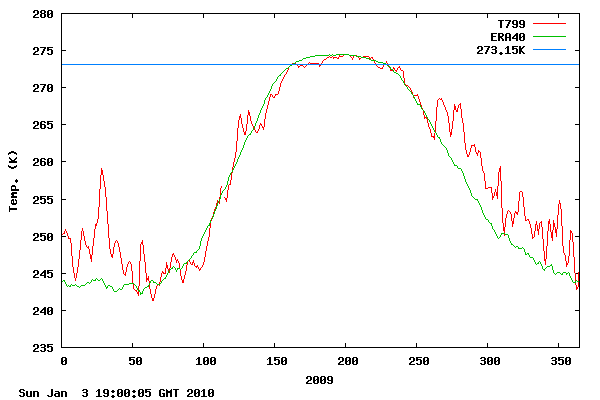
A couple of other familiar graphs showing the same issues can be seen below. Note in the DMI graph below that Arctic temperatures have not warmed at all during the summer in the central Arctic.

In the Cryosphere Today graph below, you can see that most ice loss has been during the summer, when there has been little or no temperature gain.

The scatter plot below shows Arctic temperature trends vs. the absolute value of ice extent trends, for all 12 months. Note that there is no meaningful correlation between temperature trends and ice loss. In fact, the months with the most increase in temperature seem to be the ones with little ice loss.

The article claims
” Strong winter warming is consistent with the atmospheric response to reduced sea ice cover.”
But this is inconsistent with the fact that there has been very little reduction in winter ice cover. The temperature of water under the winter sea ice is fixed by thermodynamics at -2C down to a depth of tens of metres, and does not vary from one year to the next. Furthermore, the rate of heat transfer through 2-5 meter thick 99+% concentration ice, is very low. NSIDC is currently showing ice extent right at the 1979-2000 mean, and above the 1979-2009 mean – yet temperatures in the Arctic have been well above the mean all through the spring. How is the heat escaping through all the thick, high concentration ice?

http://ocean.dmi.dk/arctic/meant80n.uk.php
The article also claims :
“reduced summer sea ice cover allows for greater warming of the upper ocean….The excess heat stored in the upper ocean is subsequently released to the atmosphere during winter.”
There is a major problem with that theory. The summer minimum occurs at the autumnal equinox when the Arctic is receiving almost no SW radiation, and that which is being received is well below the critical angle of water. By September, the shortage of insulating ice cover is actually causing a net loss of heat from the ocean. NSIDC explains it like this:
“In the past five years, the Arctic has shown a pattern of strong low-level atmospheric warming over the Arctic Ocean in autumn because of heat loss from the ocean back to the atmosphere. …. As larger expanses of open water are left at the end of each melt season, the ocean will continue to hand off heat to the atmosphere.”

In other words, loss of summer ice should produce atmospheric warming in the autumn, but not in the winter and spring when ice is cover is normal or near normal.
Two years ago, WUWT published this article after review by Walt Meier at NSIDC, Roger Pielke Sr. at CU, and Ben Herman at the University of Arizona. It explains why changes in ice cover probably are causing a net cooling effect. None of the reviewers had any substantive disagreements with the conclusions.
Conclusion: The University of Melbourne study claims are not supported by the available data. The authors seem to have jumped right into statistical analysis without proposing a physical mechanism that works. Heat flows across differences in temperatures, yet the winter water temperature under the ice is fixed at -2C. Thus elevated winter air temperatures should actually cause a reduction in heat flow out of the ocean. Whatever is driving increases in winter Arctic temperatures is not heat coming out of the Arctic Ocean, which is covered with insulating ice.
A more logical conclusion would be that the decline in ice thickness is associated with warmer winter temperatures.
If scientific reasoning were limited to the logical processes of arithmetic, we should not get very far in our understanding of the physical world. One might as well attempt to grasp the game of poker entirely by the use of the mathematics of probability.
– Vannevar Bush
Discover more from Watts Up With That?
Subscribe to get the latest posts sent to your email.
So, H2O’s phase change from solid to liquid is an endothermic process?
Whoda thunk it.
Phil. says:
April 30, 2010 at 4:40 pm
Steve used a host of data above, including DMI data. In this case, all of them seem to generally agree. I have posted my objections to the DMI data before. So I’m not sure what your point is here.
The DMI use the ERA reanalysis data as well, so I don’t place a lot of reliance on them either. As I said above, they may be the best we have … which ain’t sayin’ much …
However, DMI seem to screw even that up, because in many years there is a large jump between the last day of one year and the first day of the next. I don’t know why.
Dave F says:
April 30, 2010 at 10:48 pm
Not sure if this is a woosh, but there is lots of wind data at that most marvellous of resources, the KNMI database.
April 6, 2010
Cold snap causes late-season growth spurt
http://nsidc.org/arcticseaicenews/
” This was the latest date for the maximum Arctic sea ice extent since the start of the satellite record in 1979.”
suricat says:
April 30, 2010 at 11:38 pm
OK, fair enough to some extent, but I am seeing a figure of 100 m in ‘pure’ seawater (whatever that may be – as you say, it is difficult to find, although the author seems to have found some (I lost the name of the sea)).
Assuming this is correct, and I would probably only be able to read a page of that lot without nodding off, skimming that section did not mention ice apart from to lump it in with liquid water once. Assuming that the absorption is similar, and you had ‘pure’ ice, you may then go for 100m depth. I do not think that ice remains ‘pure’ in most circumstances outside of domestic ones. It cracks and ripples all possible ways. You can’t normally see through it AT ALL, let alone a few cm, except in rare circumstances. I know that is visible light, not UV, but deflection is deflection, and the wavelengths are very comparable.
“Dave F says:
April 30, 2010 at 10:48 pm
Are there long term trends in wind direction?”
Yes, a strong run of Major Mid Winter Sudden Stratospheric Warming events since 1998 (marked * );
http://www.geo.fu-berlin.de/en/met/ag/strat/produkte/northpole/index.html
extend that list here;
http://acdb-ext.gsfc.nasa.gov/Data_services/met/ann_data.html
The longer CT keeps those old graphs up to push their agenda, the greater will be skepticism of AGW. It just helps the skeptics cause so I’m all for them NOT updating the graphs. In fact, I would surmise that it is precisely for this reason that skepticism is growing day by day. I don’t think the MSM realizes this either…
Dave F;
Compare;
http://ocean.dmi.dk/arctic/meant80n.uk.php
to;
http://www.geo.fu-berlin.de/en/met/ag/strat/produkte/northpole/index.html
noting the month the SSW occurs.
Also can you see Canadian Warmings on the decline from the early 1990`s, but returning again since 2004/5.
Thanks Steve for another excellent and thought provoking post which debunks another piece of poor climate science.
I think a big factor which dictates the degree of summer melt, which contributes to the annual ice minimum, is the degree of cloud cover. This is a snippet from the NSIDIC site:-
“The most important characteristic of clouds in the Arctic is the summer stratus. From about mid-June to mid-September, the ocean area covered by sea ice is 80 to 90 percent covered with this cloud type. Summer stratus has important effects on the radiation balance of the surface.”
This indicates to me that TSI is also not a significant factor in the melt and we need to look at changes to strength, direction and temperature of ocean currents to account for variations in sea ice minimums. Wind strength and direction also play a significant role in the melt process. It would be interesting to find out if solar activity effects sea and air currents, although I suspect that the paucity of solid information about what happens in the Arctic basin would make this difficult?
paul jackson
Walt Meier at NSIDC explains :
If her mouth was really like that, I’d marry her. Every day would be a comedy show.
“Tenuc says:
May 1, 2010 at 5:14 am
It would be interesting to find out if solar activity effects sea and air currents,”
This has already been acheived. In mid 2007, I made a successfull forecast for a strong uplft in the solar signal, and the associated temperature uplift, from mid Jauary 2008. This coincided with a strong SSW. On this basis, from my weekly forecasts last winter, I expected a minor warming early December 2009, and a moderate warming from mid January 2010. This matches the results very well. I have also established that the Lunar position can pinpoint the few days that the SSW is most likey to occur at.
“Tenuc says:
May 1, 2010 at 5:14 am
This indicates to me that TSI is also not a significant factor in the melt”
I would suggest you look at solar wind velocity rather than TSI.
Study the values for December/January/February in recent winters;
http://www.solen.info/solar/coronal_holes.html
Willis Eschenbach says:
May 1, 2010 at 2:00 am
Phil. says:
April 30, 2010 at 4:40 pm
Willis Eschenbach says:
April 30, 2010 at 4:10 pm
However, DMI seem to screw even that up, because in many years there is a large jump between the last day of one year and the first day of the next. I don’t know why.
I think it’s because they only graph 360 days!
Willis Eschenbach says:
May 1, 2010 at 1:33 am
Willis, sorry I don’t know what you mean.
But anyway, let me ask you this. If there is a trend towards less sea ice in summer in the Arctic (which NSIDC and other institutions clearly show in their graphics). Then doesn’t that also mean a corresponding trend towards open water?
And if water absorbs more solar energy than the ice, what happens with that heat? Where does it go? Do you have evidence to show where it does?
How does water freeze? Where does the heat go? If you don’t want to believe the ocean is giving up it’s heat to the atmosphere before it refreezes, then what other explanation can you give?
Honestly the Nature paper isn’t all that noteworthy. It’s saying something we already know.
10% of global river discharge feeds the Arctic, changes in flow rate – yearly/monthly?
It all adds up.
The phase of the AO is also crutial; http://jisao.washington.edu/ao/
If I dared to look for a cylce, I would be looking at a 90yr cycle, positive from 1900, and negative from 1945, with strong +ve exceptions at very warm years like 1948/9, 1975/6 and the late 1980`s. And -ve exceptions in colder years like 1915, 1919, 1931, 1936, 1940/1/2 and 1947. This would project to the AO being in a positive phase till 2035, exceptions aside.
stevengoddard said on April 30, 2010 at 1:35 pm:
What big oil paycheck? You post here so often it is obvious Anthony has you on the payroll. Your own neglected site hasn’t seen an update since February, so clearly you are contractually obligated to offer such posts for publication on WUWT first with republishing on your own site not allowed (and Anthony buys everything to avoid the competition). We’ve noticed it no longer says “Guest post by” thus you’re now part of the team. (BTW Did you avoid any pesky IP rights clauses? It’d be a shame if WUWT Inc. had any claims against those fat royalty checks from your journal-published peer-reviewed papers.)
Oh, I expect we’ll see that increased off-shore drilling about the same time they start constructing those “clean safe” nuclear power plants that were promised during the election. Yup, that’ll happen any day now…
kadaka
payroll? contract?
ROFL – you have an active imagination. I get paid exactly the same amount for writing as I do for coaching rec soccer. Speaking of which, I am just back from another Arctic soccer match. Colorado is now into it’s eighth straight month of winter.
From stevengoddard on May 1, 2010 at 10:59 am:
ROFL – you have an active imagination.
Or I have merely just demonstrated how HTML could use not only a “sarcasm” tag but a “spoof” one as well… Although a simple method of denoting “not serious” could take care of up to 90% of all internet conflicts. Which could remove up to 95% of the internet’s potential for amusement thus on practical grounds it shall never be done.
I think some may find this excellent research article of interest. It’s pretty technical, but nicely summarizes some of the interrelated issues going on with AGW, sea ice, N. Hemisphere circulation, warming, etc:
http://www3.interscience.wiley.com/cgi-bin/fulltext/122665675/PDFSTART
I found this sentence from the conlcusion, very interesting:
“The most important conclusion of this and several recent papers is that the loss of summer Arctic sea ice can have an impact on larger Northern Hemisphere atmospheric circulation.”
But please read the whole article, and at least some of you who are still open minded might realize that things are a lot more complicated than they seem, and that the reduction of sea ice can have broader impacts than those discussed here, namely that the warming of air temperatures at other times of the year (other than peak insolation) can can be indirectly related to more open water through changes in atmospheric circulation patterns. The result of these changes would mean that temperatures could be higher at any time of year, and looking for some direct linear or immediate coorelation misses the more subtle interconnections of sea temperatures and atmospheric circulation patterns.
File LFC16 has been now updated with more information.
http://www.vukcevic.talktalk.net/LFC16.htm
“Ulric Lyons says:
May 1, 2010 at 8:57 am
This would project to the AO being in a positive phase till 2035, exceptions aside.”
What really bothers me is not loss of Arctic ice, but cold Northern Hemisphere winters.
Deterministic seasonal forecasts for the next 20 years anybody? I jest not.
One more thing…this is a great site to monitor during the melt season, to watch the sea ice melt inch by inch near Barrow AK:
http://www.gi.alaska.edu/snowice/sea-lake-ice/Brw10/
Had anyone else noticed that none of the good data/monitor/weather/climate sites are from the UK, and the really misleading ones are from Switzerland?
Is it appropriate to simply compare months within a year (see first 2 bar graphs)?
Is this only considering seasonal effects?
Would it be more appropriate to compare temperature anomalies between times of equal ice extent (including various lag times and possible adjustments for seasonal effects) over many years?