By Steve Goddard

Guardian photo : Ann Daniels Enjoying The Warming Arctic
Yesterday, WUWT reported on a University of Melbourne study claiming that melting ice is behind the warming of the Arctic.
“Findings published in Nature today reveal the rapid melting of sea ice has dramatically increased the levels of warming in the region in the last two decades. The sea ice acts like a shiny lid on the Arctic Ocean. When it is heated, it reflects most of the incoming sunlight back into space. When the sea ice melts, more heat is absorbed by the water. The warmer water then heats the atmosphere above it.”
If this were true, we would expect to see that months with the most ice loss would also show the most warming. In fact, we see the exact opposite. As you can see in the graph below, most Arctic warming from 1979-present has occurred in the winter and spring, with very little warming during the summer.
")
By contrast, ice extent trends over that same time interval show that ice loss has occurred mainly during the summer. It appears that the relationship between warming and ice loss is inconsistent with the claims in the University of Melbourne study. Temperatures have increased the least during times of year when ice loss was the greatest.
")
April is the month which has warmed the most, a full seven months after September – the month of peak ice loss. There is very little variation in ice extent year over year during April – except for this year which is running well above any other recent years.

http://ocean.dmi.dk/arctic/icecover.uk.php
A couple of other familiar graphs showing the same issues can be seen below. Note in the DMI graph below that Arctic temperatures have not warmed at all during the summer in the central Arctic.

In the Cryosphere Today graph below, you can see that most ice loss has been during the summer, when there has been little or no temperature gain.

The scatter plot below shows Arctic temperature trends vs. the absolute value of ice extent trends, for all 12 months. Note that there is no meaningful correlation between temperature trends and ice loss. In fact, the months with the most increase in temperature seem to be the ones with little ice loss.

The article claims
” Strong winter warming is consistent with the atmospheric response to reduced sea ice cover.”
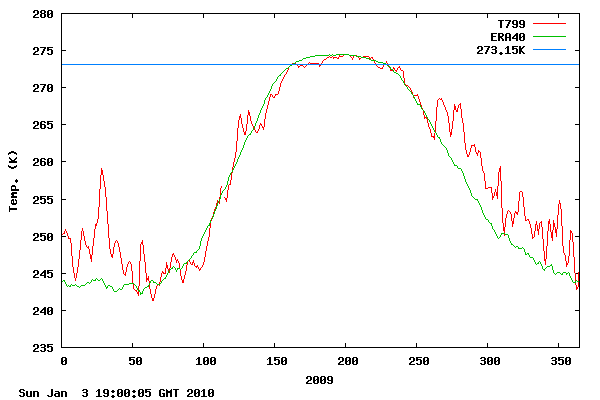
But this is inconsistent with the fact that there has been very little reduction in winter ice cover. The temperature of water under the winter sea ice is fixed by thermodynamics at -2C down to a depth of tens of metres, and does not vary from one year to the next. Furthermore, the rate of heat transfer through 2-5 meter thick 99+% concentration ice, is very low. NSIDC is currently showing ice extent right at the 1979-2000 mean, and above the 1979-2009 mean – yet temperatures in the Arctic have been well above the mean all through the spring. How is the heat escaping through all the thick, high concentration ice?

http://ocean.dmi.dk/arctic/meant80n.uk.php
The article also claims :
“reduced summer sea ice cover allows for greater warming of the upper ocean….The excess heat stored in the upper ocean is subsequently released to the atmosphere during winter.”
There is a major problem with that theory. The summer minimum occurs at the autumnal equinox when the Arctic is receiving almost no SW radiation, and that which is being received is well below the critical angle of water. By September, the shortage of insulating ice cover is actually causing a net loss of heat from the ocean. NSIDC explains it like this:
“In the past five years, the Arctic has shown a pattern of strong low-level atmospheric warming over the Arctic Ocean in autumn because of heat loss from the ocean back to the atmosphere. …. As larger expanses of open water are left at the end of each melt season, the ocean will continue to hand off heat to the atmosphere.”

In other words, loss of summer ice should produce atmospheric warming in the autumn, but not in the winter and spring when ice is cover is normal or near normal.
Two years ago, WUWT published this article after review by Walt Meier at NSIDC, Roger Pielke Sr. at CU, and Ben Herman at the University of Arizona. It explains why changes in ice cover probably are causing a net cooling effect. None of the reviewers had any substantive disagreements with the conclusions.
Conclusion: The University of Melbourne study claims are not supported by the available data. The authors seem to have jumped right into statistical analysis without proposing a physical mechanism that works. Heat flows across differences in temperatures, yet the winter water temperature under the ice is fixed at -2C. Thus elevated winter air temperatures should actually cause a reduction in heat flow out of the ocean. Whatever is driving increases in winter Arctic temperatures is not heat coming out of the Arctic Ocean, which is covered with insulating ice.
A more logical conclusion would be that the decline in ice thickness is associated with warmer winter temperatures.
If scientific reasoning were limited to the logical processes of arithmetic, we should not get very far in our understanding of the physical world. One might as well attempt to grasp the game of poker entirely by the use of the mathematics of probability.
– Vannevar Bush
Discover more from Watts Up With That?
Subscribe to get the latest posts sent to your email.
I’m no scientist, but when ice melts in my gin and tonic the temperature of the drink goes down.
What about soot?
mb
My main objection is that there is no conduit for heat to move from the Arctic Ocean to the atmosphere during the winter. The water is -2C for several tens of metres depth, and above is capped by ice. Any “excess” heat that is contained in deeper layers of the ocean has no mechanism to move vertically into the atmosphere.
The summer warming theory is based on the idea that seawater is less reflective than ice, and thus warms both the water and the air above. There is little landmass around to absorb incoming UV, so the atmosphere over ice remains cold all summer in the Arctic Basin.
Completely off topic, but typical –
It turns out, by the way, that oil rigs today generally don’t cause spills. They are technologically very advanced. Even during Katrina, the spills didn’t come from the oil rigs.
Barack Obama – April 2, 2010
Ray says:
April 30, 2010 at 1:37 pm (Edit)
Actually, Ray, much of the time the water is warmer than the air, and often is the cause of the melting. Consider ice in the spring, when the air temperature is say -10°C. The water under the ice is typically just below freezing, which for sea water is about -1.9°C. If the water warms slightly (remember there is a constant current running under the ice which may be bringing in warmer water), the ice will start to melt, even though the air temperature is well below freezing.
Another often unremarked fact is that ice is a pretty good insulator. If the water under the ice warms, the ice keeps that warmth from radiating to space, and thus keeps the system warmer. Ice keeping the system warmer … go figure. I don’t know if this is accounted for in the climate models, it may well be. But I don’t see it in the study.
Finally, the study doesn’t use actual data, but ERA reanalysis data. While reanalysis data is better than nothing, I wouldn’t place a whole lot of reliance on it …
w.
Willis Eschenbach says:
April 30, 2010 at 4:10 pm
Finally, the study doesn’t use actual data, but ERA reanalysis data. While reanalysis data is better than nothing, I wouldn’t place a whole lot of reliance on it …
As reliable as the DMI data that Steve uses then?
Gee Ann Daniels should cover up those lips.
brc says:
April 30, 2010 at 3:17 pm
I’m no scientist, but when ice melts in my gin and tonic the temperature of the drink goes down.
I think the G&T has confused the ‘temperature inversion’ level of ~4C in water with the temperature of ice formation in water (~0C). 🙂
Best regards, suricat.
More alarm on the effects of CO2 from one of the paper’s authors:
”
Says Melbourne-based climate expert Professor Ian Simmonds: “Progressively you are creating an environment which is going to encourage more intense cyclones. In terms of statistics they are becoming less frequent but more intense.’
Simmonds and Brazilian scientist Alexandre Pezza last year published a groundbreaking paper arguing global warming had contributed to the appearance of the first documented tropical cyclone in the South Atlantic.
”
I’d like to see their evidence !
This paper makes the classic mistake of assuming that statistical correlation implies causation. The strong statistical correlation between air temperature and sea ice coverage shown in Figure 2 could occur: a) because the trend towards reduced sea ice causes a trend towards higher temperatures (the author’s hypothesis), b) because the trend towards higher temperatures causes a trend towards reduced sea ice, or c) because both move in parallel with changes in a third phenomena, for example the AMO. (The Atlantic is a major source of energy input into the Arctic.)
What evidence does Dr. Screen offer to support his hypothesis that sea ice controls temperature? His only evidence is that the temperature increase is strongest at surface, a phenomena that wasn’t present in the ERA-40 data but is found in ERA-Interim data. (He also discusses two other alternative explanations. 1) Trends in cloud cover do not correlate with trends in temperature/sea ice. 2) A trend towards increased water vapor is present in the summer, when the trend towards increased temperature is weakest.)
Does Dr. Screen’s hypothesis make sense? It certainly doesn’t in winter, when the strongest temperature trend is observed. The methods summary indicates that “changes in sea ice cover were calculated by averaging sea ice concentrations over the Arctic Ocean (north of 70 degN)”. In winter, the only region in the Arctic north of 70 deg that is not consistently covered with sea ice lies between Scandinavia, Svalbard, Nova Zembla, and Greenland. Dr. Screen is asking us to believe that modest changes in ice coverage in this region (about 60 deg of latitude at 75 degN) manages to influence temperatures throughout the entire Arctic basin and produces a temperature trend of +2 degC/decade at 85 degN.
How does Dr. Screen explain why the temperature trend is much weaker in the summer when the trend in sea ice is much stronger? “The near-surface warming is modest in summer because energy is used to melt remaining sea ice and warm the upper ocean.” Where does this “energy” come from? It doesn’t come from the air, because Figure 1 shows only a weak trend (none of the dreaded “Arctic Amplification”) towards warming at the surface during the summer. And there is a trend towards less ice to melt and consume energy. Furthermore, the greatest warming trend in the spring and fall occurs at 85-90 degN, but the greatest trends in sea ice are occurring much further south during these seasons.
The worst aspect of the paper is the alarmist statement at the end of the abstract – which isn’t supported by any evidence or discussion in the paper: “The findings reinforce suggestions that strong positive ice–temperature feedbacks have emerged in the Arctic, increasing the chances of further rapid warming and sea ice loss, and will probably affect polar ecosystems, ice-sheet mass balance and human activities in the Arctic.” First, the Greenland ice sheet only melts in the summer, when the hypothesized influence of sea ice on temperatures is weakest and far south of the greatest change in temperature (north of 75 degC). The observed moister air could produce increased snowfall to negate melting. Second, there are no human activities and little, if any, ecosystem where the dramatic warming has been observed (north of 75 deg). Since the warming mostly occurs in the non-summer months, it is probably beneficial.
stevengoddard says:
April 30, 2010 at 3:36 pm
“The summer warming theory is based on the idea that seawater is less reflective than ice, and thus warms both the water and the air above. There is little landmass around to absorb incoming UV, so the atmosphere over ice remains cold all summer in the Arctic Basin.”
You mention UV, but UV penetrates ocean depth (and ice) to far greater depth than IR, and fractionated snow only diffuses UV. Thus, I assume that energy from UV will present with a large delay.
Why a large delay? Because IR penetrates 2-3 metres of ocean depth whereas UV penetrates to <700 metres of ocean, or ice, depth.
Let me correct that! The depths I quoted are for pure water and ice.
Best regards, suricat.
Typo in the main post:
“NSIDC is currently showing ice extent right at the 1989-2000 mean,”
Should be 1979.
[Fixed, thanx ~dbs]
You must be mistaken Steve. After all you are just depending on actual observations and simple physics while those real scientists in Melbourne probably have a brand new computer and a neat programme.
And I wonder why the Australian government has got cold feet over an ETS?
Observe that the Cryosphere Today graph is 3 years out of date. Anyone who visits there regularly will be familiar with the way the site keeps very nearly up to date on a daily basis in many of its data, while the elements showing the greatest efforts on their part to promote date from about 2007, coincidentally the year of record low sea ice extent.
A year ago I asked them directly why certain aspects of the site appear to show neglect or are arranged in a particular way, and why the southern hemisphere is given short shrift. The reply I received said, in part,
Given the seasonal progression of sea ice I can see why there is probably little interest among “users interested in climate change detection…” in updating this graph.
Obviously this article is merely displaying the “breathtaking ignorance”* of WUWT posts as per usual.
Please Anthony, keep it up – this sort of ‘ignorance’ is fantastic ammunition against all the HGW hysterics out there.
* http://climateprogress.org/2009/06/05/nsidc-director-serreze-death-spiral-arctic-ice-wattsupwiththat/
(last one got swallowed, poss because of a link in it)
suricat says:
April 30, 2010 at 5:22 pm
From my experience of ice, I would be extremely surprised if anything could get through 700 metres of the stuff. Half a mile? Come on….
In the winter, the weatherman around here always say “and 5 to 10 degrees warmer by the water” until lake Huron ices over; when the arctic ocean water is -4.5 degrees and the air temp is -40 degrees, a little open water is going to warm the air pretty fast. It’s actually pretty awe inspiring to see the lake steaming in the winter.
stevengoddard says:
April 30, 2010 at 3:48 pm
As was the language in use today as NOAA spoke of “leaking oil faster than was previously thought”.
So what happened, did the valve get put in backwards where on is off, global warming causes global cooling, and melting sea ice causes heat to be generated?
Maybe they should the yellow submarine back down there and tell them to turn the shutoff valve to the ‘other off’.
R. Craigen says: April 30, 2010 at 6:30 pm
“Observe that the Cryosphere Today graph is 3 years out of date. ”
http://arctic.atmos.uiuc.edu/cryosphere/IMAGES/seasonal.extent.1900-2007.jpg
Yes, it is most troubling that this chart is not kept current, thus obscuring the present arctic sea ice conditions and potentially misleading a casual reader. Perhaps we should email them at;
Requests about polar data to cryosphere-data@atmos.uiuc.edu
and Questions and/or comments about polar science to cryosphere-science@atmos.uiuc.edu
to see if we can get them to update this chart…
Are there long term trends in wind direction?
If the Earth, generally speaking, had winds blowing air from the equator to the poles, rather than from the poles to the equator, for an extended period of time this would make a bit of difference on temperature globally.
How about it, any good data on wind direction/speed in the ol’ climate database? No?
I am shocked something important was overlooked.
JER0ME says:
April 30, 2010 at 7:27 pm
suricat says:
April 30, 2010 at 5:22 pm
“”Why a large delay? Because IR penetrates 2-3 metres of ocean depth whereas UV penetrates to <700 metres of ocean, or ice, depth.""
"From my experience of ice, I would be extremely surprised if anything could get through 700 metres of the stuff. Half a mile? Come on…."
"Come on" nothin'! Read this!
http://books.google.com/books?id=C5kRs1z_CYoC&pg=PA56&lpg=PA56&dq=UV+absorption+of+water+vapour&source=bl&ots=bLYkuKb6z8&sig=ShuCKHswM8g8Axo3FbNG27gSi7w&hl=en&ei=7KqASrLnO8SMjAem5IH2CQ&sa=X&oi=book_result&ct=result&resnum=9#v=onepage&q&f=false
After you've read it you'll understand my caveat of 'pure'! Lab experiments are not the same as experiments in the field, they require logical extension. However, they do offer insight.
Best regards, suricat.
“In fact, we see the exact opposite.”
Seems to be a lot of that with global warming predictions.
Where is the famous ‘death spiral’ of Mr. Serreze? http://nsidc.org/data/seaice_index/images/daily_images/N_timeseries.png
jeff brown says:
Seems like you left out the quote of what I said … so I’m not sure what you mean. What am I missing?
stevengoddard says:
Sorry for the lack of clarity, Steve. I understand why the arctic cools in the fall. I was referring to the claim by R. Gates that
If R. Gates is right, the low summer ice (bottoming in September) should have caused warming that would be “released” in October and November, not December. My point was that we haven’t seen that, so R. Gates claim is very doubtful.