
Guest Post by Steven Goddard
Steve McIntyre points out that NOAA’s Susan Solomon saw fit to exclude a statement of measurements from IPCC WG1. With such certainty then, it’s no wonder she’s certain that our current situation is “irreversible”. Well then, let’s not worry about it if one of NOAA’s lead scientists says the effects are well nigh irreversible. What she’s serving up is pure alarmism.
NOAA has issued a warning to the occupants of (some) planet :
Global warming has reached the point of no return, a study published in the Tuesday edition of the Proceedings of the National Academy of Sciences by a joint team of the U.S., French and Swiss researchers concludes. Even if the world reduces emissions of CO2 to the level before the industrial revolution, it will take at least 1,000 years to reverse the climate change effect that have already taken hold, AP on Sunday quoted the team as saying. Dr. Susan Solomon of the U.S. National Oceanic and Atmospheric Administration’s Earth System Research laboratory led the study. “People have imagined that if we stopped emitting carbon dioxide the climate would go back to normal in 100 years, 200 years; that’s not true,” she said, adding the effects are well nigh irreversible.
That got me wondering what she meant by “back to normal.” Perhaps it means sea ice at normal levels? No that can’t be it, because sea ice area has already recovered to “normal.”![]()

http://arctic-roos.org/observations/satellite-data/sea-ice/observation_images/ssmi1_ice_area.png
Perhaps she means violent weather, like strong tornadoes? Longing for a return to the 1970s, when there were lots more of them?

http://lwf.ncdc.noaa.gov/img/climate/research/tornado/tornadotrend.jpg
In 1908, a hurricane formed on March 6, the earliest on record. Ah, for the good old days of early spring hurricanes…..
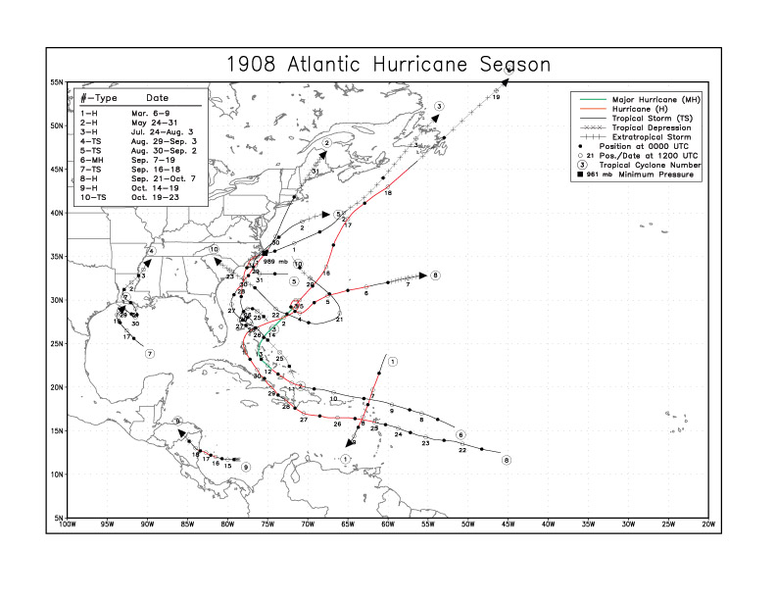
http://en.wikipedia.org/wiki/File:1908_Atlantic_hurricane_season_map.png
In 1954, Hurricane Alice formed on December 30, the latest on record. Nothing like a New Year’s hurricane to brighten up the holidays.

http://en.wikipedia.org/wiki/File:1954_Atlantic_hurricane_season_map.png
In 1961, Hurricane Carla made landfall in Texas. It was the most intense hurricane to ever hit the US.

http://en.wikipedia.org/wiki/Hurricane_Carla
In 1900, a hurricane killed 8.000 people in Galveston, Texas.

http://en.wikipedia.org/wiki/Galveston_Hurricane
In 1780, a hurricane killed more than 27,500 people in the Carribean.

http://en.wikipedia.org/wiki/Great_Hurricane_of_1780
In 1960, 60% of the farmland in China received no rain. Somewhere between 20 and 43 million people died due to extreme weather and mismanagement by the socialist government.
In the 1930s, the US suffered extreme heat and drought, resulting in the dust bowl. It was the warmest decade on record in the US (at least before USHCN cleverly adjusted it downwards.)

http://www.giss.nasa.gov/research/briefs/hansen_07/fig1x.gif

http://en.wikipedia.org/wiki/Dust_bowl
Rhys Jaggar (08:14:06) :
“Remember that PNAS papers are submitted by members, so no formal peer criticism takes place”.
that is simply not true, PNAS papers are subject to peer review.
jeff brown (10:17:17) :
Oh, look, a new model!
Ryan
How long did it take between the “discovery” of electricity, and the implementation of generators, wiring and lightbulbs ?
Was it necessary to ban or tax candles ?
It is my understanding that before the invention of the automobile
horse waste was a big problem.
Did they have Horse-waste credits back then to mitigate the pollution ?
You can’t force this stuff without some backfires ( like frozen windmills and snow covered solar panels)
Allow ingenuity to take its proper course.
jeff brown (10:01:59) :
So far, the relationship between temperature and CO2 looks fairly linear, with a extrapolated 2C rise at 550 ppm.
http://docs.google.com/View?id=ddw82wws_592d7v6sdf8
“”” George E. Smith (10:06:10) : Your comment is awaiting moderation
“”” Alberta Slim (17:51:18) :
George E. Smith (16:27:36) :
This my reference
http://www.junkscience.com/Greenhouse/ “””
For what ? “””
I see it now Slim.
I wasn’t quibbling about the fact that you said “exponential” rather than “logarithmic”. Everybody understnads that its just a matter of which vartiable is where.
My whole point is that we have no recent (say last 200 years or less) experimentally measured data, that has small enough error bands to be definitive as to the mathematical relationship. A simple T = m.CO2 + c fits just as well as T = m.log(CO2) + C or even T = m, exp(CO2) + c
You can even fit it to T = m.Sin(CO2) + c with just as good a fit, as the data errors will permit.
So experimental data doesn’t uniquely define the correct mathematical relationshitp (if any such exists) and there simply isn’t any Physical theoretical model that would call for any particular mathematical model.
The logarithmic argument is a direct consequence of the mythology that the mean global surface Temperature (not anomaly) increases by a fixed amount called “THE CLIMATE SENSITIVITY” for each doubling of the atmospheric CO2 abundance.
The available surface thermal radiation emittance must vary by about an order of magnitude from the very coldest Antarctic winter midnights (places like Vostok) to the very hottest tropical desert surfaces; and the peak wavelength of that radiation varies by about 1.82:1 over the earth for the same reason; so a fixed amount of CO2 in the local atmosphere can’t possibly have a fixed “forcing” effect in terms of Watts/m^2, so “climate sensitivity” varies wildly over planet earth; so it must be sampled to determine even somethign like a global average value; and there is no such sampling network that complies with the laws of sampled data systems.
And in any case something like a simple forcing even if constant ove the earth surface; still ignores the quite non-linear effects caused by cloud variations; which completely negate any possible direct CO2 to Temperature causal relationship.
So notwithstanding your citation of junkscience.com there is neither physical theory nor experimental observation to support any mathematical relationship between atmospheric CO2 abundance and mean global surface Temperature. Even if it should be so, that those two are causally related in some way; there is no basis for determining what that relationship is; since the system is quite chaotic.
stevengoddard (10:27:22) :
ok, if you smooth temperature and CO2 over the past 50 years, it does look linear (btw…that figure you pointed me to was of temperature anomalies, not actual temperature and I don’t know the baseline for the computation of the anomalies). But if you look at the last 150 years, it’s not linear. And this gets to the point of how results depend on the time-period analyzed. Over the long-term it is not linear, but recently it looks to be. But then again, if you plot Arctic sea ice extent over the satellite data record with CO2, it also looks linear, but I don’t think any scientist would say that GHGs are solely responsible for Arctic ice melt.
jeff brown (10:41:41):
“…I don’t think any scientist would say that GHGs are solely responsible for Arctic ice melt.”
That implies that GHGs [actually, the hypothesis is specifically CO2] is causing Arctic ice melt.
If you’re right, that means carbon dioxide is excluded from the Antarctic: click
jeff brown (10:41:41)
The linear trend line I showed was for all GISS data, starting in 1890.
Smokey (10:48:43) :
yes the hypothesis is that warming induced by GHGs is causing Arctic sea ice to melt. But the system has BOTH natural variability and GHG-induced warming acting on it. So..they are BOTH responsible for changes we are seeing today. I don’t think the scientists have yet been able to say xx% is due to natural variability and xx% is due to GHGs. At least I haven’t seen a study like that published anywhere.
GHG-induced warming is also affecting the Antarctic ice cover. Pronounced warming has occurred in the western Antarctic where the sea ice IS retreating. GHGs and ozone depletion have also resulted in stronger westerlies around Antarctica that cause the wind to push the ice away from the coast in the Ross Sea (where the ice is actually increasing). Both the increases and decreases in Antarctic sea ice are attributed to GHGs and ozone depletion.
But just so you understand, the ocean’s thermal intertia and ability to mix delay any temperature signal from the ongoing absorption of heat. The circumpolar currents around Antarctica actually act as a buffering preventing warm water from the tropics from transporting heat to the south pole, a buffer that does not exist in the north.
In this link it doesn’t look linear. GISS are modeled temperatures though, right? And
they don’t get the warming it the 1930s/1940s right, or do they?
http://zfacts.com/metaPage/lib/zFacts-CO2-Temp.gif
jeff brown (10:55:06):
“…the system has BOTH natural variability and GHG-induced warming acting on it. So..they are BOTH responsible for changes we are seeing today.”
Thus, the effect of CO2 is negligible, and can be disregarded for all practical purposes. QED.
And the Western Antarctic peninsula is atop a hot spot, as has been discussed here often. It is only a small part of Antarctica. The rest is cooling: click
Smokey…the more recent results on Antarctica actually show warming everywhere in Antarctica. See the Nature paper by Steig et al. But again, it all depends on your time-period of trend analysis. anyone can make any trend by carefully choosing their start and end points. Of course for the observational record, there isn’t much choice in those start and end points, so you have to go with what you have.
jeff brown (10:59:42) :
The relationship between CO2 and temperature does look very linear in your graph, because the temperature and CO2 curves track each other closely.
Smokey (11:03:06) :
also, just because natural variability is also a factor, that doesn’t mean GHGs are negligible. solar variation explains less than 10% of the warming since 1850. so where is the other 90% coming from?
jeff brown (10:59:42) :
if dT/dt == k * dCO2/dt
then dT/dCO2 == k i.e. linear
On January 17, 1961, in his farewell address to this nation, President Eisenhower warned us about a military-industrial complex gaining control of policy making. Most remember that one. But it appears no one seems to remember his other warning:
<<<>>>
Indeed, domination of this nation’s scholars by Federal employment, project and, in paticular, grant allocations, and the power of money is now evident, and public policy has been taken captive by a scientific-technological elite.
Oops, the other warning
“In the councils of government, we must guard against the acquisition of unwarranted influence, whether sought or unsought, by the military-industrial complex. The potential for the disastrous rise of misplaced power exists and will persist.
We must never let the weight of this combination endanger our liberties or democratic processes. We should take nothing for granted. Only an alert and knowledgeable citizenry can compel the proper meshing of the huge industrial and military machinery of defense with our peaceful methods and goals, so that security and liberty may prosper together.
Akin to, and largely responsible for the sweeping changes in our industrial-military posture, has been the technological revolution during recent decades.
In this revolution, research has become central, it also becomes more formalized, complex, and costly. A steadily increasing share is conducted for, by, or at the direction of, the Federal government.
Today, the solitary inventor, tinkering in his shop, has been overshadowed by task forces of scientists in laboratories and testing fields. In the same fashion, the free university, historically the fountainhead of free ideas and scientific discovery, has experienced a revolution in the conduct of research. Partly because of the huge costs involved, a government contract becomes virtually a substitute for intellectual curiosity. For every old blackboard there are now hundreds of new electronic computers.
The prospect of domination of the nation’s scholars by Federal employment, project allocations, and the power of money is ever present – and is gravely to be regarded.
Yet, in holding scientific research and discovery in respect, as we should, we must also be alert to the equal and opposite danger that public policy could itself become the captive of a scientific-technological elite.”
@ur momisugly stevengoddard (Is that really “Steven Goddard”?) on fusion:
Fusion works good on a brute-force basis. Pressure, heat, light elements in a plasma state, voila. Meanwhile we have attempts at “controllable” fusion like ICF at the National Ignition Facility (NIF) where they are attempting to shatter a boulder with a thousand little chisel blows, when one well-placed stick of dynamite will do the job.
The products of a fusion bomb to note are heat and pressure. We’ve detonated them underground before. So why don’t we just build a large underground chamber that can contain those products, set off a small one, and generate power from those products? At this posting they’re discussing using old mines to store energy as compressed air. Well then, get the siting right and the pressure storage will take care of itself.
Fusion power now that uses existing technology, versus “sometime in the future when we get the details worked out.” What’s not to like?
stevengoddard (11:14:42)
except I suppose for the warming in the 30s/40s which doesn’t appear to respond linearly to CO2. Also the CO2 curve is non-linear throughout the time-period shown and the temperature shows some cooling and warming whereas the CO2 shows a non-linear increase.
jeff brown (11:16:40) :
Based on the trends, it appears that another 1.5C warming is possible by the end of the century. Is this a catastrophe?
kadaka (12:02:46) :
Good idea, but Obama wants a world free of nuclear weapons, like we had during the happy years of WWI and WWII.
Same person, BTW.
Jeff Brown
Explain the warming in your graph from 1910 – 1945
Explain the cooling in your graph from 1945 – 1970
What forced it? (it was not the sun)
By the way see a nice picture: http://www.archive.org/details/SVS-3630
jeff brown (12:16:42) :
I know the theory, but when I plot GISS or CRU vs. CO2, I see a linear trend – though CRU is lower than GISS.
Feet2theFire (10:17:42) :
you write: And Antarctica is going the OTHER way, with the greatest ice extent ever recorded. So, where is all this melt water to come from? If not Greenland and not Antarctica, where?
Um…why are you mixing up sea ice and Antarctic ice? It is the sea ice in winter that has shown about a 1% increase per decade in Antarctica, not the Antarctic ice sheet. Sea ice is frozen ocean water.
I have not seen a single projection for 100s of meter sea level rise. The current estimate is 1m by the end of this century. That is well below 100 meters. Plus, all of Antarctica and Greenland together do not even contain 100 meters of ice.
Lets be realistic. If all of Greenland were to melt, humans would likely no longer exist on this planet…that would be too warm of a world to live on. Right now land glaciers are contributing most to the projected sea level rises anyway, though the major ice sheets might start kicking in more if the warming reaches values projected by the end of this century.
Why can’t we discuss the factors that are relevant?
BTW- The girl in the photo is one of the CRU’s models. Their models can be manipulated into being: hot, hotter or outright fraud even AL would feel guilty about! Now that’s hot!