
Guest Post by Steven Goddard
Steve McIntyre points out that NOAA’s Susan Solomon saw fit to exclude a statement of measurements from IPCC WG1. With such certainty then, it’s no wonder she’s certain that our current situation is “irreversible”. Well then, let’s not worry about it if one of NOAA’s lead scientists says the effects are well nigh irreversible. What she’s serving up is pure alarmism.
NOAA has issued a warning to the occupants of (some) planet :
Global warming has reached the point of no return, a study published in the Tuesday edition of the Proceedings of the National Academy of Sciences by a joint team of the U.S., French and Swiss researchers concludes. Even if the world reduces emissions of CO2 to the level before the industrial revolution, it will take at least 1,000 years to reverse the climate change effect that have already taken hold, AP on Sunday quoted the team as saying. Dr. Susan Solomon of the U.S. National Oceanic and Atmospheric Administration’s Earth System Research laboratory led the study. “People have imagined that if we stopped emitting carbon dioxide the climate would go back to normal in 100 years, 200 years; that’s not true,” she said, adding the effects are well nigh irreversible.
That got me wondering what she meant by “back to normal.” Perhaps it means sea ice at normal levels? No that can’t be it, because sea ice area has already recovered to “normal.”![]()

http://arctic-roos.org/observations/satellite-data/sea-ice/observation_images/ssmi1_ice_area.png
Perhaps she means violent weather, like strong tornadoes? Longing for a return to the 1970s, when there were lots more of them?

http://lwf.ncdc.noaa.gov/img/climate/research/tornado/tornadotrend.jpg
In 1908, a hurricane formed on March 6, the earliest on record. Ah, for the good old days of early spring hurricanes…..
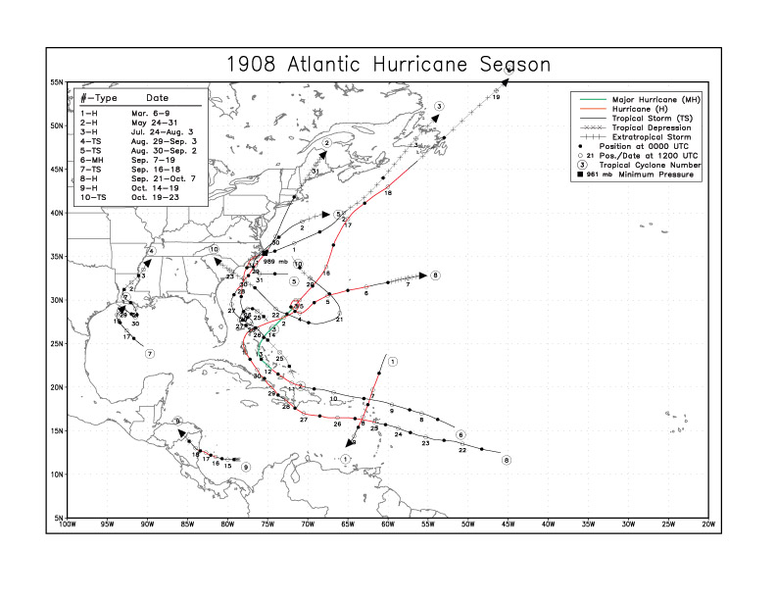
http://en.wikipedia.org/wiki/File:1908_Atlantic_hurricane_season_map.png
In 1954, Hurricane Alice formed on December 30, the latest on record. Nothing like a New Year’s hurricane to brighten up the holidays.

http://en.wikipedia.org/wiki/File:1954_Atlantic_hurricane_season_map.png
In 1961, Hurricane Carla made landfall in Texas. It was the most intense hurricane to ever hit the US.

http://en.wikipedia.org/wiki/Hurricane_Carla
In 1900, a hurricane killed 8.000 people in Galveston, Texas.

http://en.wikipedia.org/wiki/Galveston_Hurricane
In 1780, a hurricane killed more than 27,500 people in the Carribean.

http://en.wikipedia.org/wiki/Great_Hurricane_of_1780
In 1960, 60% of the farmland in China received no rain. Somewhere between 20 and 43 million people died due to extreme weather and mismanagement by the socialist government.
In the 1930s, the US suffered extreme heat and drought, resulting in the dust bowl. It was the warmest decade on record in the US (at least before USHCN cleverly adjusted it downwards.)

http://www.giss.nasa.gov/research/briefs/hansen_07/fig1x.gif

http://en.wikipedia.org/wiki/Dust_bowl
Wren (21:24:43) :
One might get the impression from reading the article the Solomon study is new. It’s not. Here is a link to the study.
http://www.pnas.org/content/early/2009/01/28/0812721106.full.pdf+html
REPLY: Nobody implied that it was new, but with Steve McIntyre’s pointing out Solomon’s recent aversion to having a statement in WG1 about measurement, It reminded Goddard of her overblown claims about CO2 residence time, so we decided to have a little fun.
Of course you wouldn’t understand that, being all puffed up with CO2 and all that. Bring on on the wailing, and no I don’t care what you’ll have to complain about next. – A
=====
I probably should have know when the article just said “Tuseday” it didn’t mean today or last week, but some Tusday in 2008.
REPLY: Or you can look at the tag “satire” and laugh along with everyone else or check the date on the linked story and not worry about it. Jeez go to bed and quit your nit picking it’s 3AM in Maryland. -A
[snip – sorry wren, your posting privileges have been revoked for the night, we’re just getting tired of you. Go to bed, its 3AM in Maryland]
“Fusion power is where we should be headed.”
Ha, ha, ha. Another example of socialist science – that is, the kind of science the taxpayer is forced to fund because capitalist science doesn’t see much chance of it ever making money. I wonder why that is? Could it be that 50 years of fusion research hasn’t made one jot of progress?
Since the climate change is now considered irreversible even by its proponents it seems that wasting more time and money on socialist science projects like nuclear fusion and other daft schemes to reduce CO2 would be better spent on building up those flood defences. But we have a hundred years to prepare so I would suggest a “wait and see” strategy for deciding where best to put the barriers up.
Ryan (03:34:20) :
Here is a practical example of fusion power. It looks like a real source of energy to me.
http://www.nationalarchives.gov.uk/cabinetpapers/images/cabinetpapers/he2d04-wha006994-main.jpg
Here is another one.
http://www.luminousnuminous.com/blog/wp-content/uploads/2009/05/sun_tour.jpg
irreversible – should try a stick shift (gear stick to us brits) I never have trouble finding reverse.
And a thought just occured to me, in 200 years when they make a family tree of climate scientists (with the invention of the interweb all comments, statements and lies are now recorded electronically (unlesse requested to be deleted before an FOI request) so historians will be able to accurately prove who said what and when) who would be at the top, i’m guessing Susan Solomon and Al gore as mum and dad, with Jones and Mann as the kids?
I wonder just how those people whose sole aim is to protect the enviroment are going to feel when they find out that they have been used and abused by mega rich banksters/carpet bagger capitlaists/carbon trading snake oil salesmen all along.
All the demos and sit ins,all the lectures and seminars and all to provide a smokescreen cover for the biggest ever fraud perpetrated against humanity. The earth will carry on doing what the earth always has,the political elite and the carpet baggers will be rich beyond their wildest dreams and in fact the draconian laws being crafted now will mean that the carpet baggers will be free to rape the earth without restriction.
Look closely and you find that the rich wil get richer, the crooked and the political elite will get richer and more powerful and the poor will be left to rot.
Another CACC ( Catastrophic anthropogenic Climate Change ) prevision. Cacc.. Cacc… Cacc… Sorry I couldn’t resist…
G.P.
Remember that PNAS papers are submitted by members, so no formal peer criticism takes place.
Course, you’ll look a right chump if you put forward a paper that is demonstrably idiotic, so I am sure the member concerned thought long and hard before doing so.
Key to this sort of paper is defining ‘beyond the point of no return’. It will all be based on assumptions in a model. Has to be.
Because none of us can see the future to measure it yet, can we??
Those models, I just adore them.
Don’t you??
Now we are manufacturing demons and ghosts. If Susie uses the eskimo stories to season her sermons, so be it. If I were an Alaskan native, I also would ask for a new modular home if claiming the last one was too close to the waves would get me a new one. I notice in NOLA many folks living below sea level recieved FEMA trailors for several years as free housing.
Ben Kellett (15:32:27) : You said “I am in fact completely astonished by the lack of “best practice” as regards climate science as has been highlighted on this site. But if you live by the sword, you die by the sword – so if you are accusing people of manipulating data etc, you may stand to be accused of the same thing if you make statements like “sea ice area has returned to normal”. It has NOT in arctic for any meaningful period of time.”
You have just said “It has NOT in arctic for any meaningful period of time.”, COMPARED TO WHAT, you are doing exactly what you accuse Steve and others on this site of doing?
The Main loss of sea ice took place in 2007 and had nothing to do with “warming”, but all to do with sea currents and Wind Direction and Force.
But if it is to do with warming, how much sea ice do you think there was when Greenland was Ice Free when the Vikings Colonised it?
Please Note Anthony’s answers to wren, this is a “Satire” thread, i.e. a JOKE on ms Solomon.
@stevengoddard: plugging my vacuum cleaner into a H-bomb explosion looks a bit anti-social if you ask me.
The Sun has gravity on its side to squash those atoms together – bit difficult to reproduce on earth. H-bombs use a fission reaction to set off an A-bomb to squash the atoms together – also a bit difficult to reproduce in a controlled manner.
Ryan (08:46:17) :
Scientists perform controlled fusion reactions on a regular basis.
You probably don’t have a nuclear reactor in your vacuum cleaner either.
In 1895, Nansen took a boat to 83N and a kayak to 86N. Lewis Pugh got stuck at 81N, after completing 1% of his journey.
@”stevengoddard”: “Scientists perform controlled fusion reactions on a regular basis.”
They certainly do, if you pump enough energy in you can squash two single atoms together. But I rather thought the idea was to get some energy OUT???
Please Steven, I know all about JET and ITER and you are being as disengenuous as Team-AGW.
rbateman (15:05:57)
When did I say that temperature was responsible for ice loss in 2007?? Why make things up like that? Temperature, winds, thin ice, ocean temperatures were ALL responsible for the anomalously low sea ice in 2007. Natural variability = atmospheric circulation, which can bring warm temperatures into a region one year and not the next, which can create strong storms and winds one year and not the next. Again, it seems you conflate weather with climate. Long term trends are what is of interest, not the year-to-year variability. Once the average person understands that, the discussion on climate change will actually be productive.
Ryan (09:43:57) :
It is just a technology problem. Sooner or later it will get solved.
jeff brown (09:54:59)
As you said, temperature did play a big part in the 2007 summer minimum.
Alberta Slim (15:42:55) :
when did I say that CO2 and temperature changes were linear? Please don’t make things up.
Of course it is not linear, and thankfully not so. But do you realize that global temperature change is not EQUAL everywhere on the planet? If you look at a 2100 temperature rise of 3oC for the planet, that means about 7oC in the Arctic. Of course none of the climate models currently being used for future assessments of climate incorporate the feedback from the permafrost thawing in such warming scenarios. Do you know that there is more Carbon in the permafrost today than in the atmosphere? And when that is released in the form of methane it is more powerful of a greenhouse case than CO2.
Basically, we don’t really know what will happen in the future because climate models still are unable to model key processes in things like cloud formation, aerosols, precipitation. But we do know that if we continue business as usual, atmospheric greenhouse gases will continue to increase and we know that they cause warming. Let’s hope there are some self-regulating mechanisms in the climate system that will allow us to survive..
Not A Carbon Cow (17:12:19)
I agree with you. I do not believe cap and trade is a solution that will work, nor is it the right approach. Looking to renewables for energy is the right approach in the long-term, and doing things to curb CO2 emissions today, such as more energy efficiency, carbon sequestration, etc. are good short term solutions.
“”” Alberta Slim (17:51:18) :
George E. Smith (16:27:36) :
This my reference
http://www.junkscience.com/Greenhouse/ “””
For what ?
Mike D. (17:21:57)
Actually Mike, the coastal erosion in the Arctic is caused by (1) permafrost thawing and (2) less sea ice that exposes the coasts to larger ocean waves. So, ask yourself what is causing the permafrost to thaw and the sea ice to retreat in summer? Also ask yourself if you would mind having to move your entire town because your home fell into the ocean. I think it’s one thing to have these changes so external to ourselves, but it’s another thing to have it happening in our own community.
That’s the thing with climate change, if it’s not bothering our lifestyles, why should we care? The scientists would probably make more headway if they could actually tells us what will happen to us if things like the Arctic sea ice cover disappeared in summer. Unfortunately, the models aren’t all that great yet at modeling impacts and we have no other way of knowing.
TimiBoy (17:25:14) :
[snip]
Phillep Harding (17:39:57)
really? where did you hear that? I would like to read it. Can you point me to the reference for it?
From Berner (Science, vol 249)
A new model has been constructed for calculating the
level of atmospheric CO2 during the past 570 million
years. A series of successive steady states for CO2 is used
in order to calculate CO2 level from a feedback function
for the weathering of silicate minerals. Processes considered
are: sedimentary burial of organic matter and carbonates;
continental weathering of silicates, carbonates,
and organic matter; and volcanic and metamorphic degassing
of CO2. Sediment burial rates are calculated with the
use of an isotope mass-balance model and carbon isotopic
data on ancient seawater. Weathering rates are calculated
from estimates of past changes in continental land area,
mean elevation, and river runoff combined with estimates
of the effects ofthe evolution ofvascular land plants. Past
degassing rates are estimated from changes in the rate of
generation of sea floor and the shift of carbonate deposition
from platforms to the deep sea. The model results
indicate that CO2 levels were high during the Mesozoic
and early Paleozoic and low during the Permo-Carboniferous
and late Cenozoic. These results correspond to
independently deduced Phanerozoic paleoclimates and
support the notion that the atmospheric CO2 greenhouse
mechanism is a major control on climate over very long
time scales.
Playing around with Central Greenland temperatures (here), I saw something quite revealing, IMHO.
I have tried to get images to display here, but whatever I am doing doesn’t seem to work. (If anyone could tell me how to do that it would be appreciated; the toolbar icon doesn’t seem to give anything that actually displays.)
The most current temp in the data is 95 years ago and it was -31.59C. At 3300 BP, the temp maxed out at -28.86C, nearly 3C above 1915. There were several times in the Holocene when that -28.86C was approached. At 980 years ago, in the middle of the MWP, with the Vikings farming in Greenland, the indicated temperature was -30.63C, almost 2C warmer than now, but nearly a full 1C below the max. Since the end of the ice age the MWP seems to be about AVERAGE, very much so.
Since the MWP central Greenland has been in its only protracted cold spell since the end of the Younger-Dryas. We are only now beginning to come out of that cold spell.
The real story is in the big picture. The ice core data goes back to 49.98k years ago. The obvious thing about it all is that the several warm periods did not “melt all the ice in Greenland,” since the ice from 50,000 years ago is still there – even after weathering the warm periods. They certainly could not have gotten ice core samples if all the ice had melted.
This is probably a brain-dead observation, but it seemed so obvious I couldn’t not speak up about it:
If the MWP and its warmer predecessors did not “melt all the ice in Greenland,” any belief that we are in danger of having passed the tipping point – or that we are remotely in danger of doing so – is just pathetic.
It is CERTAIN that central Greenland can warm up at least by another 3C without melting down to bedrock, since we have the proof of it. If the MWP or the warmer periods – more than 10 of them since the Younger-Dryas – did not melt the ice in Greenland, we are certainly safe, AND sea level cannot rise if the ice doesn’t melt in Greenland. If the ice had all melted, we wouldn’t be able to measure it now, would we?
Literally, the ice in central Greenland won’t melt until the temperature there gets above 0C, so not only do we have the 3C between 1915’s temperature and 3300BP, but we THEN have the other 28C to go before the ice in central Greenland even BEGINS to melt.
And Antarctica is going the OTHER way, with the greatest ice extent ever recorded. So, where is all this melt water to come from? If not Greenland and not Antarctica, where?
Like I said, this seems a brain-dead observation, but if this is so brain dead, then what does that say for those who claim scores or hundreds of meters of sea level rise?