Sediments Show Pattern in Earth's Long-Term Climate Record

The eccentricity, axial tilt, and precession of the Earths orbit  vary in several patterns, resulting in 100,000-year ice age cycles
The eccentricity, axial tilt, and precession of the Earth's orbit vary in several patterns, resulting in 100,000-year ice age cycles. Image: wikimedia

From UCSB News: (h/t to David Schnare) UCSB Geologist Discovers Pattern in Earth’s Long-Term Climate Record

Lorraine Lisiecki

Lorraine Lisiecki

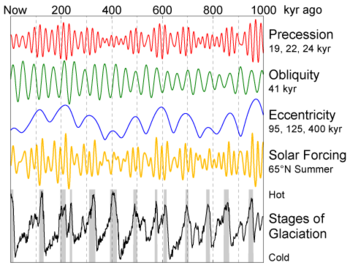
(Santa Barbara, Calif.) –– In an analysis of the past 1.2 million years, UC Santa Barbara geologist Lorraine Lisiecki discovered a pattern that connects the regular changes of the Earth’s orbital cycle to changes in the Earth’s climate. The finding is reported in this week’s issue of the scientific journal Nature Geoscience.

Lisiecki performed her analysis of climate by examining ocean sediment cores. These cores come from 57 locations around the world. By analyzing sediments, scientists are able to chart the Earth’s climate for millions of years in the past. Lisiecki’s contribution is the linking of the climate record to the history of the Earth’s orbit.

It is known that the Earth’s orbit around the sun changes shape every 100,000 years. The orbit becomes either more round or more elliptical at these intervals. The shape of the orbit is known as its “eccentricity.” A related aspect is the 41,000-year cycle in the tilt of the Earth’s axis.

Glaciation of the Earth also occurs every 100,000 years. Lisiecki found that the timing of changes in climate and eccentricity coincided. “The clear correlation between the timing of the change in orbit and the change in the Earth’s climate is strong evidence of a link between the two,” said Lisiecki. “It is unlikely that these events would not be related to one another.”

Besides finding a link between change in the shape of the orbit and the onset of glaciation, Lisiecki found a surprising correlation. She discovered that the largest glacial cycles occurred during the weakest changes in the eccentricity of Earth’s orbit –– and vice versa. She found that the stronger changes in the Earth’s orbit correlated to weaker changes in climate. “This may mean that the Earth’s climate has internal instability in addition to sensitivity to changes in the orbit,” said Lisiecki.

She concludes that the pattern of climate change over the past million years likely involves complicated interactions between different parts of the climate system, as well as three different orbital systems. The first two orbital systems are the orbit’s eccentricity, and tilt. The third is “precession,” or a change in the orientation of the rotation axis.

###

0 0 votes
Article Rating
197 Comments
Oldest
Newest Most Voted
Inline Feedbacks
View all comments
phlogiston
April 6, 2010 11:56 am

This is real climate science. Like the earth – this rocks!

tty
April 6, 2010 12:00 pm

And this is supposed to be NEWS? Hasn’t she ever heard of the Milankovich curve?
I guess the sole reason for this rehash lies in the sentence:
“This may mean that the Earth’s climate has internal instability in addition to sensitivity to changes in the orbit,”
Now if she had an explanation why the glacial cycles switched from the 41,000 year obliquity cycle to the 100,000 year eccentricity about a million years ago, that would be NEWS (note that the graphics stops at one million years).

Tad
April 6, 2010 12:03 pm

This has been known for ages, e.g., the Milankovich cycles. I don’t understand what is new about her research unless it correlates new ocean sediments with these cycles as opposed to previous studies that have shown the same thing.

Henry chance
April 6, 2010 12:06 pm

On one hand we have satellite data for 30 years. On the otherhand, many cycles and oscillations are longer than that. We have a problem They are trying to measure the distance to the moon with a 12 inch ruler.

B. Smith
April 6, 2010 12:07 pm

This looks to be real science, with a real scientist at work that appears not to have a climate-related political bias one way or the other. Observations of real events with data that can be analyzed by other scientists. Discoveries with surprises that create more questions to be answered and begging more research to find those answers.
Science looking to solve the mysteries of our universe, not to alter politics. How refreshing!

April 6, 2010 12:08 pm

This is clearly very interesting, but I’m sure the AGW people will say it’s irrelevant.
To them, nothing but CO2 can explain the “recent sudden rise in temperature”. Even if we could prove that 100% of any temperature increase was explained by this — or any other — theory, they still wouldn’t accept it. The fact that increasing CO2 concentration leads to increasing temperature overrides any natural explanation whatever it might be.

Boudu
April 6, 2010 12:10 pm

Careful tty, she knows where you live. 😉

Enneagram
April 6, 2010 12:14 pm

CO2 anyone? This suggests that NADW formation is strongly
sensitive to factors beyond ice volume and summer insolation at high northern latitudes

Neo
April 6, 2010 12:17 pm

Obviously, CO2 is pretty much meaningless … we’re all doomed no matter.

Mike Ford
April 6, 2010 12:18 pm

The graph makes perfect sense to me, although this isn’t newly discovered in any way. Is all that’s happened here is a thorough review of Milankovich?

mdjackson
April 6, 2010 12:19 pm

Wow! Real science!

mdjackson
April 6, 2010 12:20 pm

Uhhh… I just looked at the diagram again. Is it just me or does it look like it’s about to get real cold?

Steve Sloan
April 6, 2010 12:21 pm

So where does the Goracle’s orbit around the rest of us fit into this theory?

Al Gored
April 6, 2010 12:22 pm

This will be fun. Like the Creationists arguing that God arranged the fossils, I’m half expecting to see Realclimate suggest that Big Oil has secretly been arranging sediments (while pretending to drill for oil) as part of their grand conspiracy to kill the planet.
Agree with tty, particularly the last point.

Pete
April 6, 2010 12:23 pm

This stuff is giving me a headache…. why no say; it’s hot in the summer and cold in the winter and tell Al Gore to go blow himself.

April 6, 2010 12:27 pm

So, once again C02 has little/nothing to do with “climate change”?
Should we expect this information to be in the next IPCC report?????

TerryBixler
April 6, 2010 12:28 pm

Not to put a damper on this new research, but it clearly does not demonstrate how CO2 controls the orbital variations of the earth.

Yarmy
April 6, 2010 12:38 pm

So what’s new here that James Croll and Milankovitch didn’t already discover?

Alec, a.k.a. Daffy Duck
April 6, 2010 12:39 pm

hmmmm….from the same lady:
Sunlight Has More Powerful Influence On Ocean Circulation And Climate Than North American Ice Sheets
ScienceDaily (Nov. 7, 2008) —
The distribution of sunlight, rather than the size of North American ice sheets, is the key variable in changes in the North Atlantic deep-water formation during the last four glacial cycles, according to the article. The new study goes back 425,000 years, according to Lorraine Lisiecki, first author and assistant professor in the Department of Earth Science at the University of California, Santa Barbara….
http://www.sciencedaily.com/releases/2008/11/081106153633.htm

B. Smith
April 6, 2010 12:40 pm

tty (12:00:43) :
And this is supposed to be NEWS? Hasn’t she ever heard of the Milankovich curve?
____________________________________________________________________
“Lisiecki’s contribution is the linking of the climate record to the history of the Earth’s orbit.”
There are assumptions and theory, but nothing beats having empirical, duplicable hard data to back up assumptions and theory.

Phillep Harding
April 6, 2010 12:43 pm

tty, it’s news if few people heard of it. I recall reading about this a long time ago, but could not remember it clearly, and that was before the internet, anyhow. Good article, IMO.
Looks like we are right at a peak, and that’s a pretty sharp drop off staring us in the face. Not a good thing. (Time to buy stock in the company that makes Sorells.)

Jay
April 6, 2010 12:44 pm

The real news is that a young woman at UCSB is actually making observations and writing about climate mechanisms that don’t somehow depend upon carbon dioxide in the atmosphere. This “blasphemy” is somehow getting some legitimate attention without the geologist being completely condemned.
Looks like progress to me.

Urederra
April 6, 2010 12:45 pm

tty (12:00:43) :
And this is supposed to be NEWS? Hasn’t she ever heard of the Milankovich curve?

My thoughts exactly.

Klausb
April 6, 2010 12:45 pm

More stuff from Mrs. Lisiecki is here:
http://lorraine-lisiecki.com/

red432
April 6, 2010 12:46 pm

So if I stop going north to ski and south to surf every year will this prevent the Earth tilt increase and avert catastrophic climate change?

stumpy
April 6, 2010 12:46 pm

The AGW crowd will tell you the solar forcing is too low and it was co2 that caused the ice ages and warm periods, even though it lags by a few hundred years. I actually saw a BBC documentary a while (within the last 1-2 years) that actually claimed small changes in co2 were responsible for the start and end of ice ages!!!!!
I and my geologist collegues were shocked at the poor one sided science! It was like Realclimate wrote the script for them ;0)

mike core
April 6, 2010 12:49 pm

Although M-Cycles have been understood for some time, Cyclostratigraphy and mapping M-Cycles together in such a way that maps with a significant degree of correlation with glacial-interglacial phases is relatively novel. It would be interesting to know how she mapped the corelation and with what sediments. I know varves show a good correlation.
Unless you are waiting on a pizza order , a million years is not a long time, and the sediments are not likely to be much more than mud.
Must see if this paper is online. The links dont much get into the detail of how.
And yes, it sounds like real science. And yes, the post-modernist pseudoscientists will probably dismiss it.

Tom in Florida
April 6, 2010 12:54 pm

How can this get by as news? This is old hat ….. Milankovitch Cycles. The key is that about every 100,000 years the NH summer solstice is at perihelion and the axis tilt is at max, 24.5 degrees in relation to the orbital plane. As conditions approach this maximum, insolation at 65N increases causing the great northern ice sheets to melt away putting Earth into an interglacial warm period. As the cycles drift away from this condition the Earth will go back into glaciation for another 100,000 years until the right combination of cycles again creates another interglacial warm period. So let’s face it, the ice is coming and there ain’t nothing we can do about it.

Klausb
April 6, 2010 12:58 pm

… and a bunch of data
is here:
http://www.ncdc.noaa.gov/paleo/indexoce.html

Doug in Seattle
April 6, 2010 12:59 pm

Geologists rule! Perhaps Lisiecki can help clean up the egregious mistakes of the treemometer crowd.
Check out Lisiecki’s CV at:
http://www.lorraine-lisiecki.com/lisieckiCV.pdf

mike core
April 6, 2010 1:00 pm

A bit more here:
Links between eccentricity forcing and the 100,000-year glacial cycle Lorraine E. Lisiecki1
Abstract Variations in the eccentricity (100,000 yr), obliquity (41,000 yr) and precession (23,000 yr) of Earth’s orbit have been linked to glacial–interglacial climate cycles. It is generally thought that the 100,000-yr glacial cycles of the past 800,000 yr are a result of orbital eccentricity1, 2, 3, 4. However, the eccentricity cycle produces negligible 100-kyr power in seasonal or mean annual insolation, although it does modulate the amplitude of the precession cycle. Alternatively, it has been suggested that the recent glacial cycles are driven purely by the obliquity cycle5, 6, 7. Here I use statistical analyses of insolation and the climate of the past five million years to characterize the link between eccentricity and the 100,000-yr glacial cycles. Using cross-wavelet phase analysis, I show that the relative phase of eccentricity and glacial cycles has been stable since 1.2 Myr ago, supporting the hypothesis that 100,000-yr glacial cycles are paced8, 9, 10 by eccentricity4, 11. However, I find that the time-dependent 100,000-yr power of eccentricity has been anticorrelated with that of climate since 5 Myr ago, with strong eccentricity forcing associated with weaker power in the 100,000-yr glacial cycle. I propose that the anticorrelation arises from the strong precession forcing associated with strong eccentricity forcing, which disrupts the internal climate feedbacks that drive the 100,000-yr glacial cycle. This supports the hypothesis that internally driven climate feedbacks are the source of the 100,000-yr climate variations12.
And from her site.
http://www.lorraine-lisiecki.com/simple.html
How are glacial cycles measured?
Landscape features like Cape Cod and Half Dome in Yosemite are evidence of the large ice “sheets” over Canada and the northern U.S. The size of these ice sheets at any given time affects a certain property of the shells of tiny animals (called foraminifera) that live in the ocean. These shells get buried in the ocean, and we can find shells that grew at almost any time over the last 70 million years. The property we measure is d18O, which describes the ratio of two different types of oxygen in the shell. The lighter type of oxygen, O16, is more concentrated in the snow that gets trapped on the continents to form ice sheets. This leaves more of the heavier O18 in the ocean. The ratio of the two types of oxygen in the shells is affected by the ratio in the ocean but is also affected by the temperature of the water. This makes it very difficult to know exactly how much ice was on the continents at any one time. However, separate measurements of ocean temperature in the past can be used to improve our estimates of ice sheets size. Read more about d18O here.
Download Power Point slides illustrating how d18O measures ice volume.
As part of my research, I averaged together 57 different records of change in d18O over the last 5.3 million years. This average, known as the LR04 stack, gives us a better record of change in ice volume (and temperature) than we have ever had before because averaging together many records improves the quality of the data (reduces noise and localized changes) and because it allowed me to better constrain the time at which each glacial cycle occurred.
Yep, this looks like proper Climate Science.

Tenuc
April 6, 2010 1:08 pm

I don’t think CO2 is going to help much when the next big freeze hits us!
It’s interesting how the rate of change between warm and cold climate, as shown on the ‘Stages of Glaciation’ part of the chart, seems fairly constant – I wonder why?

Yarmy
April 6, 2010 1:09 pm

Actually, reading the poster link there are plenty of references to Milankovitch and others. It’s just the silly press release giving the impression she’s discovered the link between orbital changes and the climate.
There’s seems to be an ongoing problem with misleading science press releases. (*cough* NASA)

carddan
April 6, 2010 1:10 pm

Yes, she has heard of Milankovitch and seems intent on expanding that knowledge. From her website: “I am particularly interested in the evolution of Plio-Pleistocene climate as it relates to Milankovitch forcing, 100-kyr glacial cycles, and deep-ocean circulation.”

Klausb
April 6, 2010 1:10 pm
Ed
April 6, 2010 1:15 pm

I always come back to the phasing between the obliquity and eccentricity signals. When in phase, long wide interglacial (today and 420/800kys), when out of phase, shorter and double peaked (220/600kys). At least recently for the ice age.

April 6, 2010 1:26 pm

I hate to mention it, but she got all of this off of measuring one tree in her backyard.
That, and she’s a Denialist! Funded by Exxon! And Big Tobacco! And Satan!
But in all seriousness, I’m glad there are people who are out there conducting research and pattern analysis. Gives me warm fuzzies all over.

Andrew W
April 6, 2010 1:34 pm

The Milankovich cycles have been long accepted as the driver of the glacial-interglacial cycles, changes in atmospheric CO2 follow this cycle and, in the view of most climate scientists, accentuate the temperature changes that occur through these cycles.
So while Lorraine Lisiecki’s work may strengthen the evidence linking the Milankovich cycles to the glacial-interglacial cycles, it does nothing to change the evidence supporting AGW.

Steve
April 6, 2010 1:39 pm

The earth’s orbit is 3 dimensional. She left out inclination, which has been proposed as a factor in climate change.
But yeah, it’s science, although the presentation is a bit wonky. She’s essentially using sediment data to confirm ice core data, which is what science is supposed to do – take data from different fields of study to confirm the theory.
What we don’t get from the article (you need the full research paper) is how sediment can be used as an accurate climate proxy going back 1.2 million years. The raw data would just show “change X occurs at point Y in the sediment”, and the scientist infers from there. Without the paper I would assume she’s using the microbial population approach.

April 6, 2010 1:47 pm

Boudu (12:10:55) :
Careful tty, she knows where you live. 😉
+1 AGW Internets to you, sir.

April 6, 2010 1:49 pm

Al Gored (12:22:21) :
This will be fun. Like the Creationists arguing that God arranged the fossils,……….
You know, damned few “Creationists” argue that belief. There is a difference between a belief in a design and a conspiracy.

George E. Smith
April 6, 2010 1:51 pm

So bottom line; does her new research and pattern discovery alter the predictions; excuse me; make that projections that IPCC has handed out to the world’s leaders to act on in the next few decades ?
If not; then what is her point; sure we know that the whole solar system orbital parameters all change continually, since the planetary orbital times are not commensurate with each other;
But what does that have to do with the next 100 years of earth climate changes.
Well what does she care; I’m sure she will still keep on getting research grants to study more sediments, and find new geologic variables.

April 6, 2010 1:51 pm

Speaking of people that absolutely know things…….
http://www.foxnews.com/scitech/2010/04/06/climate-gate-michael-mann/

Bill Illis
April 6, 2010 2:03 pm

The Milankovitch Cycles and the Eccentricity of the Orbit do not match up with the ice age records. There is some correlation but it is not consistent and is often contradictory. And the ice ages are not actually a regular 100,000 years apart either – the length varies and so does the interglacial periods.

Jeef
April 6, 2010 2:04 pm

Gotta love geology. Understanding climate cycles has to involve more than making a computer guess what the temperature is going to be based on some fudged temperature record over the last 150 years. Lisiecki is doing the hard yards rather than pretending for her research grant money. Good on her.

George E. Smith
April 6, 2010 2:05 pm

One thing that scientists learn very early in their careers, is that you don’t want to be too close to any real action; as in real world action. First they will start calling you an engineer rather than a scientist, if you get too close to doing real practical things; and then they will start trying to figure out how you can make money for them.
Whereas, if you stay out in the blue sky country, when it gets to where you are facing real problems to solve; you can simply move on to the latest research subject du jour; where most of what you find will be shown to be false many years later; then you can leave behind the engineers to solve the real problems, and make some practical use of what the employer spent his money on.
What could be more useless information, than knowing that the earth’s orbit changes over time scales too long to be of any interest to humans ?

RockyRoad
April 6, 2010 2:06 pm

mdjackson (12:20:52) :
Uhhh… I just looked at the diagram again. Is it just me or does it look like it’s about to get real cold?
——————-
You are correct, grasshopper. But I really, really wish you weren’t.

John Trigge
April 6, 2010 2:08 pm

This will be ignored by the warmists as M. Lisiecki is a geologist, totally untrained in ‘climate’ science, hence her work will be relegated in favour of more ‘robust’ research such as treemometers, GCMs, etc.
Only the likes the real ‘climate scientists’ (whatever that means) such as Jones, Mann and Co seem to have the requisite knowledge to determine how climate operates.
(/sarc off)

Steve Goddard
April 6, 2010 2:14 pm

If feedbacks were dominantly positive, the earth would either move towards a permanent and progressively colder ice age, or a Venus like state of incredible heat.

H.R.
April 6, 2010 2:19 pm

@red432 (12:46:18) :
“So if I stop going north to ski and south to surf every year will this prevent the Earth tilt increase and avert catastrophic climate change?
Not enough data. How much do you weigh? How much does your surfboard and skis weigh?

pettyfog
April 6, 2010 2:21 pm

Just a comment on the comments….
Look, I dont want to have to go do a search on what Milankovitch specifically relates to, but I DO know it’s news to me as a layman.
Not the concepts of it.. I’ve read that before… I mean the scientific correlations backed up by relatively hard – provable- facts.
So, if this is old ammo, why hasnt it been loaded and fired many times? Even if it’s a TOTAL REHASH, it STILL needs to be gotten out there.

AlexB
April 6, 2010 2:22 pm

Why are people complaining that she is following the Milankovich cycle theory? This is one of the big problems in science. Everyones so keen to scream how important replication is to the scientific method and independant verification yet as soon as someone actually undergoes that practice and finds new evidence to support it then people shout them down. This is why replication is so poorly done in modern science because although people say they think its important in scientific method thier not actually bothered about it at all.

Jason F
April 6, 2010 2:23 pm

OT this is a good conspiracy theory wonder if there is any truth to it, two trillion barrels of oil under the rockies
http://www.abovetopsecret.com/forum/thread558871/pg1

tty
April 6, 2010 2:24 pm

mike core (13:00:47) :
Still very little that is new.

Ray
April 6, 2010 2:25 pm

Carbon dioxide was like any other molecule, going about, minding its own business… until Al Gore arrived.
Al Gore pointed an accusing finger at an innocent little molecule. But CO2 was proven innocent by scientists that clearly showed that the sun as well as the eccentricity, tilt and precession of the Earth was the real culprit to climate changes on Earth.
However, Al Gore won’t stop at such serious and robust scientific details, he will come back and blame the speed at which we expel CO2… which in his (cooked) science book is responsible for the changes in the Earth’s eccentricity, tilt and precession.

AEGeneral
April 6, 2010 2:27 pm

I’ve never heard of it, so it passes as “news” to me.
Thanks for posting it.

Paul Vaughan
April 6, 2010 2:35 pm

“Lisiecki found a surprising correlation. She discovered that the largest glacial cycles occurred during the weakest changes in the eccentricity of Earth’s orbit –– and vice versa. She found that the stronger changes in the Earth’s orbit correlated to weaker changes in climate. “This may mean that the Earth’s climate has internal instability in addition to sensitivity to changes in the orbit,” said Lisiecki.”
I’d recommend caution interpreting “internal”. The solar system (which includes things like Earth’s moon) is full of confounding. Noting a relationship between X & Y is great; noticing that they both relate to Z is sometimes even better.

Peter Miller
April 6, 2010 2:53 pm

None of this is new news, but it is real climate science.
Having ploughed through Montford’s book on the Hockey Stick Illusion and being an avid reader of WUWT and Climate Audit, I have no choice but to take every comment and report by any member of the Establishment climate clique with a huge sack of salt.
I still cannot believe so much of the original AGW BS was based on rare, split bark, bristlecone pines, where the ‘true’ temperature is supposedly recorded, rather than using normal trees, where the growth rings are inconveniently small and heretically do not prove global warming.
But even worse – tree ring growth to measure temperature changes? What about variations in rainfall, droughts, CO2 fertilisation, nitrogen fertilisation from lightning or forest fires, the effect of wind? The list goes on and on.
But in reality, it was just another unjustified scare story, a ploy to help promote the politicians’ need for more taxes. In return, as their side of the bargain, the politicians would provide ever larger grants to fund the dubious science of global warming.

R. de Haan
April 6, 2010 3:03 pm

Doug in Seattle (12:59:54) :
Geologists rule! Perhaps Lisiecki can help clean up the egregious mistakes of the treemometer crowd.

Check out Lisiecki’s CV at:
http://www.lorraine-lisiecki.com/lisieckiCV.pdf
The Treering analyses here did show a Medieval Warm Period and LIA:
http://pages.science-skeptical.de/MWP/MedievalWarmPeriod.html
Note, especially: Luckmann (Central Canada), (among others) Linderholm (Scandinavia), Seppa (using tree pollen profiles from Fennoscandian lake sediments), Treydte (Karakoram Mtns), Zhang (Tibetan Plateau), etc.
Their science may be in question, but so are the other analytical methods in my opinion.
(Two cents from a non-scientist)

pat
April 6, 2010 3:11 pm

“This won’t fly. She does nor sound like a crack pot. Defund her and make sure she never gets anything in print. ” P. Jones

hmccard
April 6, 2010 3:17 pm

Has anyone read Lisiecki’s paper? I have only read the abstract that Klausb (13:10:45) provided. As others have observed, it seems clear to me that Lisiecki understands the Milankovich theory. IMO, Lisiecki’s contibution to science will depend on the extent to which her analysis of climate by examining ocean sediment cores from 57 locations around the world links the climate record to the history of the Earth’s orbit.

tune-in
April 6, 2010 3:18 pm

“So let’s face it, the ice is coming and there ain’t nothing we can do about it.”
According to 30,000 scientists we can counter it with CO2. I’ll be counting on their good work to save us all.

Britannic no-see-um
April 6, 2010 3:18 pm

Ocean cores provide an excellent potential history of that environmental domain, but seabed temperature cyclicity may be influenced by a whole raft of variables, some independent, some in common with subaerial environments. Comparisons between ocean sediment core and icesheet core, etc seem advisable.

jack mosevich
April 6, 2010 3:19 pm

AlexB(14:22:48): I agree with you. Why the attacks here be people who probably have not even read her paper?Please people let us not become RealClimateers.

DavidS
April 6, 2010 3:21 pm

I rather like this. It appears to be based on proper data and has made me thinkmore deeply about the climate meta-cycles. Excellent.
DavidS

KimW
April 6, 2010 3:23 pm

Heck, I did my Geology degree in the 60’s and Milankovitch was well known then. Climate is naturally variable and it irritates the heck out of me for these climate activists to blame CO2 – how arrogant can you get ?. Still, they have a cause to get excited about rather than do the years of interdisciplinary studies to find out how little we know.

D. Patterson
April 6, 2010 3:24 pm

Bill Illis (14:03:37) :
The Milankovitch Cycles and the Eccentricity of the Orbit do not match up with the ice age records. There is some correlation but it is not consistent and is often contradictory. And the ice ages are not actually a regular 100,000 years apart either – the length varies and so does the interglacial periods.

The Milankovitch Cycle modulates all paleoclimates on a scale of thousands of years (40,000–100,000), hot and cold. The Milankovitch cycle does not correlate well with tens of millions and hundreds of millions of years duration of the ice ages, because the Milankovitch Cycle is a comparatively minor superimposition on the much grreater amplitude and far far longer duration ice age cycle. The Milankovitch Cycle is detectable in the varves of the Devonian, indicating changes of climate substantial enough to make large changes in sea levels, yet the amplitude of temperature changes remain minor in comparison to the major changes in temperature upon the occurrence of a rare ice age.
In other words, the Milankovitch Cycle is a relatively very very short cycle of minor amplitude in comparison to the two major bi-state conditions represented by the hot house and cold house climates the Earth cycles between.

Phillep Harding
April 6, 2010 3:28 pm

6 04 2010 Andrew W (13:34:36) : “So while Lorraine Lisiecki’s work may strengthen the evidence linking the Milankovich cycles to the glacial-interglacial cycles, it does nothing to change the evidence supporting AGW.”
Nothing added to zero, does not change zero. Very true.
Will a return of the glaciers (which will return no matter what humans do) be considered proof of AGW?

Joe Samuels
April 6, 2010 3:28 pm

Here is a reference to the recent Arctic Ice data and a correct call for all of mankind to take a course on humility regarding climate analysis. Good approach. Thanks Anthony for all you do.
http://symonsez.wordpress.com/2010/04/06/arctic-sea-ice-shows-extensive-growth-in-march-2010/

EdB
April 6, 2010 3:28 pm

Andrew W (13:34:36) :
“The Milankovich cycles have been long accepted as the driver of the glacial-interglacial cycles, changes in atmospheric CO2 follow this cycle and, in the view of most climate scientists, accentuate the temperature changes that occur through these cycles”
Can you provide references? When I look at the ice core data, CO2 slavishly follows the temperature rise or drop. There should be a different slope on the backside of the temperature drop if CO2 had the ability to “accentuate”.

R.S.Brown
April 6, 2010 3:30 pm

For those needing a bit of background or a refresher on
Milutin Milankovitch and Milankovtch Theory, NASA has a good starting point at:
http://earthobservatory.nasa.gov/Features/Milankovitch/milankovitch_2.php
To go from obital forcing to a much broader (and much more
controversial) application of orbital dynamics and possible influences on Earth’s climate, you can check out Timo Niroma’s work at:
http://personal.inet.fi/tiede/tilmari/sunspot3.html
None of these take into account gradual continental drift or
magnetic pole reversals as influences on climate… basically
because no one has done much research into possible
connections.

starzmom
April 6, 2010 3:33 pm

How soon before her funding is slashed since she doesn’t blame CO2?

erik sloneker
April 6, 2010 3:40 pm

Interesting stuff…..it appears we rapidly descend into glacial periods (bad news for us), and emerge from them very slowly. I wonder why. To my knowledge, the Milankovitch Cycles don’t account for this variation. One would think, based on orbital eccentricities as the driver of continental glaciations, that the front and back slopes of each event would look the same.
Apologies to anyone who may have commented above on this observation.

April 6, 2010 3:42 pm

Lets hear it for Professor Lisiecki for doing some good science, the way it is supposed to be done. Maybe it is about time the geologists reclaimed the stage in this debate. It should be remembered that climatology is noting more then another earth science and only a branch of geology and physical geography.

Mike G in Corvallis
April 6, 2010 3:46 pm

By the way, please don’t criticize lisiecki for not mentioning the Milankovich correlation in the press release. She didn’t write the press release. Someone in the UC Santa Barbara Public Affairs Office wrote the press release. This person may or may not be a science writer and may or may not understand the science involved, but he or she definitely is paid by the university rather than by the researcher. The publicist’s job is to make the university look good, so anything that can amp the rah-rah-we-are-great! up to eleven is going to be highlighted and anything that acknowledges prior work by other researchers elsewhere is going to be downplayed or omitted.
Trust me on this, folks — I’ve had to deal with pissed-off scientists at other institutions because someone wanted to make my own site look good and did some creative rewriting.

Tom G(ologist)
April 6, 2010 3:50 pm

What’s new here is empirical support FOR Milankovich, and it’s world-wide data which all correlate and reveal another internal correlation. It’s one thing to measure the oribital variations of the Earth and to make predicitons about the effects of those variations on climate and glaciations. But EVERY piece of empirical evidence in the form or indisputable observation in the real world is BIG NEWS.
As I tell my students, the pure experimental sciences tell us how various things react with each other in a lab. Geology is the search to see if those things happen on their own.

kwik
April 6, 2010 3:58 pm

Andrew W (13:34:36) :
“So while Lorraine Lisiecki’s work may strengthen the evidence linking the Milankovich cycles to the glacial-interglacial cycles, it does nothing to change the evidence supporting AGW.”
I do not agree.
Callion et al implies that CO2 is delayed by approx 800 years after temperature;
Science ;
http://www.sciencemag.org/cgi/reprint/299/5613/1728.pdf

Peter of Sydney
April 6, 2010 3:59 pm

This is real science. Don’t criticize it. Criticize the corrupt science peddled by AGW alarmists.
Reply: All science is subject to criticism. Criticism and correction is part of how science progresses. Criticism is not to be confused with name calling. ~ ctm

Jimbo
April 6, 2010 4:01 pm

Steve Goddard (14:14:58) :
“If feedbacks were dominantly positive, the earth would either move towards a permanent and progressively colder ice age, or a Venus like state of incredible heat.”

***************
Herein lies the Achilles heel of AGW. Also temperature and CO2 feedback weaker than previously thought.
http://www.sciencedaily.com/releases/2010/01/100127134721.htm
http://www.nature.com/nature/journal/v463/n7280/full/nature08769.html
http://news.bbc.co.uk/2/hi/science/nature/8483722.stm

April 6, 2010 4:02 pm

AEGeneral (14:27:42) :
“I’ve never heard of it, so it passes as “news” to me.
Thanks for posting it.”
That’s great!!! For those whining because this isn’t news, AEGeneral exemplifies why it is necessary to reiterate what’s already known. Because we more often don’t, is why history repeats itself. For example, communism was more brutal than fascism and failed, glaciers osculate, gravity works on CO2, and submarines surfacing near the north pole should be repeated over and over again. Plant life thriving better in CO2 rich environment, same.
Now, I look forward to the next article about the sun being the source of earth’s heat.

RockyRoad
April 6, 2010 4:03 pm

Andrew W (13:34:36) :
The Milankovich cycles have been long accepted as the driver of the glacial-interglacial cycles, changes in atmospheric CO2 follow this cycle and, in the view of most climate scientists, accentuate the temperature changes that occur through these cycles.
So while Lorraine Lisiecki’s work may strengthen the evidence linking the Milankovich cycles to the glacial-interglacial cycles, it does nothing to change the evidence supporting AGW.
————————
Reply:
CO2 trails the inception of a glacial epoch by ~ 800 years, and 100,000 years later, CO2 also trails the inception of the thawing interglacial. How on earth does that not destroy any theory that CO2 causes AGW?
Or are we looking for invisible “tipping points” again? (Epiphany–since this process is obviously going back and forth, over and over, maybe I should be kind and refer to them as “teeter-totter points”, especially since they have definite predictable cyclicity to them?)

April 6, 2010 4:28 pm

Good on her! Doing good science in the face of poor funding, by not sucking up to the AGW gravy train. All she needed was a good university that would help her find more parts of the truth.
The more studies that cover empirical evidence and more global area at the same time, expand the knowledge of what really goes on. From these tools and additional coverage data sets a better platform can be built toward the understanding of how the weather becomes the climate, globally and regionally. It will be good to see the infilling of the Ice core gaps with parallel lines of proxies, if all things stay synchronized.
Study of the shorter periods of effects on the Earth’s weather will give leads to follow other than CO2, (I hate cul de sacs in mazes). I could not find her e-mail addy to send some input for her consideration, so in hopes she reads these comments, I include this link to my research into shorter periods of Lunar weather driving cycles.
http://research.aerology.com/aerology-analog-weather-forecasting-method/

suricat
April 6, 2010 4:33 pm

It’s refreshing to see some ‘joined up’ thinking which reinforces M cycles for our recent history. However, the ‘clincher’ would also show solar activity at that part of the M cycle! Could we use a ‘horoscope’ to determine this? 😉
Good work Lorraine!
Best regards, suricat.

AJ
April 6, 2010 4:40 pm

I think she is arguing that glacial periods cannot be explained by changes in solar forcing alone. Strong feedbacks in ocean circulation must be brought in to the picture. The term “insolation” is used frequently in the pdf. Is she saying that the circulation is easily blocked by minor solar changes?

April 6, 2010 4:41 pm

The Milankovitch cycles don’t change the total amount of solar insolation but the way in which it is distributed – for example, the amount of insolation at 65’N in the summer.
The explanation for how it could lead to such large changes in climate is difficult one.
One possibility is that the climate is highly sensitive to small changes (or highly sensitive under certain historical conditions that were present). Otherwise the Milankovitch cycles couldn’t have caused the ice ages.
A small commentary without much depth in Ghosts of Climates Past
-hopefully to be followed up at some stage with more on this fascinating subject.

April 6, 2010 4:42 pm

Reading the paper, what I gathered was that in trying to confirm or refute the SPECMAP research project, she found that certain aspects of North Atlantic circulation don’t phase map with Milankovich cycles (which are indeed central to the paper). And others do.
Nothing earth shattering, just another piece of the puzzle.
First time I’ve ever seen a science paper formatted like a full page Popular Mechanix ad for a 200 mpg carburetor.

Gary
April 6, 2010 4:44 pm

Here’s the original 1976 reference linking the Milankovich cycles to ice ages. http://www.es.ucsc.edu/~rcoe/eart206/Hays_OrbitPacemaker_Science76.pdf
It was produced by the CLIMAP project which spawned the SPECMAP project that Lorraine Lisiecki is referencing in her research poster. Among other things, these two projects improved the stratigraphic correlation and assignment of more accurate ages to points in deep-sea sediment cores. They were multi-institutional and international research projects that used sediments cores collected in the 60s and 70s from the world’s ocean before the Deep Sea Drilling Project got under way.

R. Gates
April 6, 2010 4:45 pm

Ms. Lisiecki’s work is important research that supports the general and more refined Milankovitch cycles theory. It is not a new, novel, or a unique idea, but it important data gathering to support an already well established theory. We know earth is in the middle of an interglacial period that is part of the Quaternary Period ice age that we are in. Based on the cycles that Ms. Lisiecki is studying, the next best chance for a full fledged glacial period is not for at least 50,000 years, with a really good chance coming in about 130,000 years.
Wiki actually has an excellent write up on all this, with some amazingly detailed charts at:
http://en.wikipedia.org/wiki/Milankovitch_cycles

April 6, 2010 4:46 pm

RockyRoad:

CO2 trails the inception of a glacial epoch by ~ 800 years, and 100,000 years later, CO2 also trails the inception of the thawing interglacial. How on earth does that not destroy any theory that CO2 causes AGW?

The answer is a simple one.
All other things being equal, a warmer climate leads to less CO2 being able to be stored in the oceans. Therefore, more CO2 in the atmosphere.
More at CO2 Lags Temperature in the Ice-Core Record. Doesn’t that prove the IPCC wrong?
Increases in CO2 also cause more “radiative forcing” at the earth’s surface (and throughout the troposphere).
Therefore CO2 increases can be a cause of temperature rise and a result of temperature rise.

Andrew W
April 6, 2010 4:47 pm

The transition from glacial to interglacial starts about 800 years before atmospheric CO2 concentrations start to rise, the total time the transition takes is about 5000 years, so increasing CO2 can play a role in the warming for over 80% of the transition period.
This sort of thing has been taken into consideration in climate science since before the AGW debate started.

April 6, 2010 4:49 pm

I’m afraid this is old news–the Adhemar-Croll-Milankovitch cycles have been know for a long time (the concept generally accorded to Milankovitch was actually first suggested by Adhemar and later expanded by Croll and finally quantified by Milankovitch). In the absence of any way to date deep sea cores accurately, orbital curves are fitted to ocean sediment cores by the ‘accordion method’ (you just expand and contract orbital cycles and deep see cores until they match and then claim that because they match, one must be the cause of the other!) Three major, major problems with the concept are (1) you can’t date deep sea cores accurately so you can’t claim temporal correspondence, (2) if this was the cause of climate change, the climate in the southern hemisphere should always be the opposite of that in the northern hemisphere (just like modern seasons), ie. when you have a glaciation in one hemisphere, you should have an interglaciation in the other hemisphere, and (3) the discovery in polar ice cores of very sudden, short lived changes (like the Younger Dryas) from glacial to nonglacial climates occurs so rapidly that they cannot possibly be explained by the slow methodical changes in orbital parameters.
In short, the Adhemar-Croll-Milankovitch concept falls well short of expaining glaciations and interglaciations. Sorry!

Kum Dollison
April 6, 2010 4:51 pm

Apologies for O/T, but the SOI is starting to rock:
1-Apr-2010 1011.05 1006.55 15.21 -10.01 -12.19
2-Apr-2010 1012.24 1006.65 23.07 -8.39 -12.03
3-Apr-2010 1013.20 1007.65 22.78 -6.87 -11.83
4-Apr-2010 1013.58 1007.60 25.88 -4.83 -11.70
5-Apr-2010 1013.01 1006.85 27.18 -2.82 -11.52
6-Apr-2010 1013.40 1007.05 28.55 -1.10 -11.17

igloowhite
April 6, 2010 5:13 pm

Chaco Canyon.
Moon Cycles.
Sun Cycles
Round Rocks.
People with only facts to work with.

pwl
April 6, 2010 5:26 pm

Wow, when I suggested that you have an article that gets into this very topic on your last article’s comments I didn’t expect it to be the very next article! Good work Anthony!
More along this line would be interesting. The Rotisserie Earth Theory (it’s the sun Sol), oh, proven facts from direct observations, not just hypothesis or disconnected theory.

George E. Smith
April 6, 2010 5:26 pm

“”” jack mosevich (15:19:46) :
AlexB(14:22:48): I agree with you. Why the attacks here be people who probably have not even read her paper?Please people let us not become RealClimateers. “””
Well I can’t say that I have read much here that I would call attacks. Certainly a good deal of ‘ho hum’, but not really attacks. I’m sure that reports of her paper would go down well on other blogs that are currently heavily into geologocal phenomena.
But as far as earth climate, and more importantly what if anything humans ought to do either individually, or collectively about it; her paper is about as useful as some report that the eventual collision of the Andromeda Galaxy with the Milky Way, will actually occur about 60% further into the future than prevuiously thought.
Interesting; but so is the information that some bee and Ant queens only have sex during one day of their lives; which lasts them for the rest of their lives to lay all the fertile eggs they want. Wonderful; but it isn’t going to solve any climate problems which might be solvable, or might not.

Phillep Harding
April 6, 2010 5:44 pm

R Gates, I would not expect a repeating pattern such as that shown (stages of glaciation graph) to suddenly produce a square wave. Maybe the data availible indicates 50,000 years to the next glaciation and a “real good chance” of a maximum in 130,000 years, but an eyeball of that graph suggests we will be in a glaciation in 50K yrs and might be coming out of glaciation in 130K yrs. There’s something wrong with that Wiki article.

Starwatcher
April 6, 2010 5:44 pm

Goddard
“If feedbacks were dominantly positive, the earth would either move towards a permanent and progressively colder ice age, or a Venus like state of incredible heat.”
Actually Steve, that is only true if the gain factor’s absolute value is greater then 1.

Pamela Gray
April 6, 2010 6:33 pm

Rant on:
re: sniping about “we know that already so this is not news”
There is much to learn about the specifics related to the cycles. This researcher understands the process of narrowing the topic. Yes the cycles are known. But not all that well known. Just because it has a name that is hard to spell doesn’t mean that everything is known about it.
I had the same criticism leveled at my research. Yes many drugs are known to cause hearing loss and kidney damage so why bother with understanding the specificity of the hearing mechanism to tone bursts delivered while the patient naps? Who cares?
Ever been sick? Take naps? Be unconscious getting hearing-toxic drugs pumped into your system? Ever wonder if hearing loss is a precursor to kidney loss (read up on how these two systems are connected “in-utero”)? For me, I would want to know whether or not the sensitivity of the hearing mechanism predicts kidney damage. You can live well without your hearing. Can’t live well without your kidneys.
Ask my mom. Oh. You can’t. She died. Antibiotic drugs destroyed her hearing in her teen years then destroyed what was left of her kidneys in her 40’s. With kidney failure comes an enlarged heart. She died of an enlarged heart in her 50’s. Had they been monitoring very specific frequencies of hearing, they might have noticed hearing loss and changed her antibiotics to less kidney damaging ones.
Knowing the detailed specifics is important. Ya got my hen-feathers ruffled!
Rant off.

Ron
April 6, 2010 6:41 pm

The results of the paper might not be news to some of us here, but hey, the corroboration of a theory has value.

April 6, 2010 6:42 pm

George E. Smith (17:26:29) :
“”” jack mosevich (15:19:46) :
AlexB(14:22:48):
You guys are all interesting. Alex, I agree. The negative feedback is probably unwarranted. No, this isn’t new, really. But it’s nice to see reaffirmation of what we’ve already assumed was true. Further, it is new material for some people. That is a positive as far as I concerned.
It speaks volumes to the people worried about what we should do about our current condition. It seems we’ve been here before. What did we do the last time? Nothing? Probably the standard with which we should work from.
As far as solving climate problems, let’s first establish that there is a “climate problem”. Lisiecki’s findings seem to indicate that there isn’t one, or at least it is possible that there isn’t one. It may very well be that there isn’t anything to “solve”.
I’ve heard, my entire life, that we’re using so much fossil fuels, that we’ll run out shortly. If that proposition is true, then will not anthropological CO2 emissions diminish significantly anyway? I find the CAGW theory to be a self-defeating circular argument that shouldn’t be worthy of any consideration at all, except the people that worry about it are insisting that I participate in the madness……………unless, WE ALL DROWN BEFORE THE OIL RUNS OUT!!!! OMG WE’RE ALL GOING TO DIE!!!! WE’RE ALL GOING TO DIE!!!!

bubbagyro
April 6, 2010 6:53 pm

As a scientist of 40+ years, I have been looking at earth’s very complicated picture, and I keep seeing amazing buffer systems at work. That is why we have such low correlation coefficients with each hypothesis, since climate is so multivalent with polynomial high order equations operating. Feedback systems suppress any great pitch or yaw created by any singular event. Here are some of these buffers, but it is a great exercise to think of many others:
1) Ocean heat storage system (oscillators) – these operate to redistribute regional heat storage and thereby stabilize the whole
2) Water triple point – because of water’s tremendous heat capacities between phases, heat is sequestered or released accordingly. Because water as ice floats, it reflects irradiance. As it crystallizes, it has a high latent heat of crystallization that grabs more heat than other compounds would. When it evaporates from water phase, it cools the system, etc.
3) Tectonics – the earth’s mantle is very thin and hard. It is orders of magnitude thinner with respect to the total volume of the earth than an eggshell is to an egg, e.g. Any cooling makes the mantle contract, sliding plates together faster (producing earthquakes as a side effect). In a warming phase, the plates pull apart allowing magma to rise more easily and form volcanoes, which release aerosols which cool the earth back down. [I haven’t heard this buffer discussed before, so I present it as hypothesis here]
4) Atmosphere – CO2, O3, H2O, NOx, CH4, HCl and CxClx all have different absorptive effects which modulate acute swings in the temperature. Each of these gases, and others, are part of an exquisite buffer system.
5) Magnetic field – the earth’s field modulates the effect of cosmic ray bombardment, by switching polarity in cycles.
6) Algae and plants absorb CO2 when plentiful and proliferate, marine organisms precipitate the CO2 until the plates tuck under, and vulcanism releases the CO2 back. When CO2 is low (like today), plants grow slower and absorb less.
7) When solar or galactic events change, the system changes to interact and cope.
These are just the “tip of the iceberg”, to make a pun.
Such an amazing system has many weapons to stave off man’s puny efforts to perturb her. Almost like it was designed that way.

RoHa
April 6, 2010 6:54 pm

She’s saying the position and movement of the Earth relative to the Sun affects the climate? That is the sort of nonsense they tried to teach me at school.
Fortunately, I have now seen the light, and I know that the climate depends on how much CO2 filled foam I have on my beer.

Dan Lee
April 6, 2010 6:57 pm

“…she never heard of Milankovitch…” ??? Doesn’t anyone here read the provided links? This is from a link posted very early on in the discussion:
• Mid-depth Δδ13C has a different phase with respect to
Milankovitch forcing and ice volume at each orbital frequency.
• Our results are inconsistent with the SPECMAP hypothesis that
Milankovitch forcing drives the same sequence of circulation
response at each frequency.
(From the Conclusions section of the linked paper).
So blah-blah nothing new?? Yeah, this is new, and it’s interesting, and -just a wild guess- I’m betting she knows more about Milankovitch cycles via working through the math than some of those wondering if she’s ever heard of it.

wayne
April 6, 2010 6:58 pm

Does anybody here know the year we are going to drop over that edge into another glacial period?
You want to trust R. Gates 50,000 – 130,000 years-from-now blind guess above. I’m very much like Pamela’s comment, all research efforts in real true science is welcomed, it was offered as research, I felt no agendal threat to my life or lifestyle from her paper. Who knows, Lorraine might be the one who brings us that date someday.

Steve Goddard
April 6, 2010 7:11 pm

he found that the stronger changes in the Earth’s orbit correlated to weaker changes in climate. “This may mean that the Earth’s climate has internal instability in addition to sensitivity to changes in the orbit,” said Lisiecki.
In other words, she has no clue what it means.

April 6, 2010 7:14 pm

George E. Smith (13:51:18)
. . .what does that have to do with the next 100 years of earth climate changes?
George E. Smith (13:51:18)
. . . What could be more useless information, than knowing that the earth’s orbit changes over time scales too long to be of any interest to humans?
George E. Smith (17:26:29)
. . . her paper is about as useful as some report that the eventual collision of the Andromeda Galaxy with the Milky Way, will actually occur about 60% further into the future than previously thought.

Last I heard, this blog was about “puzzling things in life, nature, science, weather, climate change, technology, and recent news” (see the header).
Clearly the paper in question did not address “the next 100 years of earth climate changes”; that wasn’t the subject. The climate history of the ancient Earth is a fascinating topic in its own right. If anything, I suspect that the vast resources poured into contemporary ‘climate change’ studies have diverted precious funds from this kind of basic science.
It is astonishing to hear so erudite a scientist-engineer as George E. Smith denigrating pure science, simply because it has no immediate application to the mostly political and ideological kerfuffle over ‘global warming’.
I think Dennis Nikols (15:42:22) has it right:

Lets hear it for Professor Lisiecki for doing some good science, the way it is supposed to be done. Maybe it is about time the geologists reclaimed the stage in this debate. It should be remembered that climatology is nothing more then another earth science and only a branch of geology and physical geography.

Right on! And so is Pamela Gray (18:33:27), who drives the point home in a dramatic, but sad, way.
/Mr Lynn

Frank
April 6, 2010 7:17 pm

The geological record (ice cores and fossil reefs) has always been a stumbling block for the alarmists. We’re living in “icehouse” era conditions presently, less than a few thousand years before reverting back to full-scale glaciation, and the alarmists are worried about 1-2 degrees C. Sheesh!
http://en.wikipedia.org/wiki/Geologic_temperature_record

April 6, 2010 7:29 pm

bubbagyro (18:53:54) : ………….(great stuff)………..Such an amazing system has many weapons to stave off man’s puny efforts to perturb her. Almost like it was designed that way.
And now maybe when “Lisiecki found a surprising correlation. She discovered that the largest glacial cycles occurred during the weakest changes in the eccentricity of Earth’s orbit –– and vice versa.”, we can add that to the list of dynamics that regulate our climate, almost like it was designed. Weird.
Tectonics and aerosols, hmmm…..

Bernd Felsche
April 6, 2010 7:31 pm

Although there’s a line for “Solar Forcing” shown, I don’t see any incorporation of techtonic plate movements. There’s been significant movement over a million years, which not only change the surface albedo, but perhaps more significantly, the ocean currents.
Then there’s a complication like ice ages which cover some of the surface with white stuff, freezing a lot of water, lowering sea levels and exposing more land near the Equator. “Data” as to the location of the plates, the extent of the ice and sea levels over much of the period covered, are at best; educated guesses with large degrees of uncertainty.
We observe that there are substantial differences in the response of the climate system to perturbations between northern and southern hemispheres. The response appears to be greater than that expected out of orbital eccentricity. The distribution of land, sea and ice are “chief suspects” to help to explain why this is so.

Lorraine Lisiecki
April 6, 2010 7:31 pm

As the author of this study, I would like to clarify a couple points.
(1) This study specifically deals with the last million years. It does not include any analysis of the warming trend of the last century, which is much faster than changes that would be produced by slow changes in Earth’s orbit over tens of thousands of years. The current changes in orbit would be expected to cause gradual cooling over the next ~90,000 years.
(2) The new results in this study are finding (a) a statistically significant correlation between climate and eccentricity specifically and (b) a negative correlation in the strength of the cycles. This suggests that the primary reason we have 100,000-yr glacial cycles is internal instability within the climate system. Eccentricity appears to affect the timing of these changes and (in some cases) weaken them.
REPLY: Ms. Lisiecki, thank you for taking the time to comment here and to add additional insights. – Anthony Watts

Phil Uebes
April 6, 2010 7:32 pm

Why publish such speculative nonsense? 1.2 million years? How stupid are we becoming that we think we can extrapolate our knowledge to such ridiculous boundaries? We can’t even predict next weeks’s weather, nor even accuratley recall weather data from a mere thirty years ago.
If this sedimentation theory can be passed off as science then we need to leave science to childrens’ story writers, and come up with a new name for the genuine practice of experimental observation.

Gail Combs
April 6, 2010 7:33 pm

B. Smith (12:40:22) :
tty (12:00:43) :
And this is supposed to be NEWS? Hasn’t she ever heard of the Milankovich curve?
____________________________________________________________________
“Lisiecki’s contribution is the linking of the climate record to the history of the Earth’s orbit.”
There are assumptions and theory, but nothing beats having empirical, duplicable hard data to back up assumptions and theory.
REPLY:
I did not read all the comments but here is a very old article on the first confirmation of Milankovich cycles using seabed cores: http://corior.blogspot.com/2006/02/part-15-ice-ages-confirmed.html
” In the spring of 1971, as part of the International Decade of Ocean Exploration, a group of scientists and researchers organized a series of studies known as CLIMAP — the Climate Long Range Investigation, Mapping and Prediction project. One of their first missions was to analyze sea cores and deduce the climate changes that have taken place during the 700,000-year Brunhes Epoch.
To achieve the goal, investigators needed a core rich in forams that could be analyzed for oxygen isotopes. In December, CLIMAP scientists located such a specimen — it had been raised from the western Pacific early in the year — and after confirming that it dated back beyond the magnetic reversal that marked the start of the Brunhes Epoch, they shipped samples of the core to Nicholas Shackleton at Cambridge University.
Shackleton, an expert at analyzing the isotopic contents of marine fossils, studied the core samples and plotted two isotopic curves, one showing the ratio of light and heavy oxygen isotopes in the remains of surface-dwelling forams, and the other plotting isotopic variations in forams that lived on the sea floor. If, as Cesare Emiliani had theorized some years earlier, the proportion of oxygen isotopes in marine fossils is governed by sea temperatures, the second curve should have shown much smaller deviations than the first: No matter what the climate, the temperature of the water at the bottom of the ocean remains close to freezing. In fact, as Shackleton showed the CLIMAP team in mid-1972, the two isotopic curves were nearly identical……
In January 1973, Hays located a core in the Lamont collection that seemed to meet his requirements. Core RC11-120 had been raised from the southern Indian Ocean six years earlier by Geoffrey Dickson aboard the Robert Conrad. After counting the radiolaria and sending samples to Shackleton for isotopic analysis, Hays was gratified to find that the deposition rate was high enough for his purposes (three millimeters per century). When the data were plotted, the answer to Croll’s question was immediately apparent: climatic changes in the northern hemisphere were essentially synchronous with those of the southern hemisphere. Although this result alone was important enough to justify his efforts, Hays was disappointed to find that the core only extended back about 300,000 years, to the base of Stage 9 in Emiliani’s isotopic scheme. To provide a suitable record for spectral analysis, a core extending back at least 400,000 years would be needed.
When it became clear that the needle Hays was looking for was not to be found in the Lamont haystack, he decided to search elsewhere. In July, he went to Florida State University in Tallahassee, where an extensive collection of Antarctic cores was maintained. There, he continued the search for cores taken near the site of RC11-120. Soon he came upon several cores taken by Norman Watkins aboard the Eltanin in 1971. With the assistance of two graduate students, Hays began to open the Watkins cores. Later he would recall: “The cores were kept in cold storage, and we were all shivering in our parkas. But when core E49-18 was opened, we stopped shivering. I knew right away we had something interesting because the color-banding matched perfectly with the oscillations in Shackleton’s oxygen curve for V23-238.” Counting down, Hays found that the core extended to Stage 13 — giving it an age of 450,000 years. He had found his needle at last.”

Lisiecki is adding knowledge to the 1973 break through, and more importantly bringing this theory back in front of the mass media’s attention.

StarBP
April 6, 2010 7:33 pm

“the stronger changes in the Earth’s orbit correlated to weaker changes in climate.”
Uh oh… I guess that means the weaker orbital changes correlated to stronger climate changes? Take another look at that graph… look at the left side (the present). The earth’s orbit just had one of the weakest eccentricity spikes on record (spikes in eccentricity often precede glaciation). The gun is cocked… and I happen to have a theory as to what kind of rare event pulls the trigger. In such an event, the harshest cooling (~17 degrees Celsius globally) would occur the very year after the event, with gradual (~10 yr.) rise back to near-Maunder temperatures (3 degrees Celsius below normal) afterward. HOWEVER… Add in two low solar cycles just after the catastrophic event and you get less rise over that decade, and Arctic freezing coupled with increased cloud formation ala Svensmark would essentially prevent much temperature rise after that decade is over. My only hint as to what event I am talking about is this link.
http://www.seis.utah.edu/req2webdir/recenteqs/Maps/Yellowstone.html
THIS HAS NOTHING TO DO WITH THE MAYAN CALENDAR, SO DON’T ASK!!!

RockyRoad
April 6, 2010 7:38 pm

scienceofdoom (16:46:39) :
RockyRoad:
CO2 trails the inception of a glacial epoch by ~ 800 years, and 100,000 years later, CO2 also trails the inception of the thawing interglacial. How on earth does that not destroy any theory that CO2 causes AGW?
The answer is a simple one.
All other things being equal, a warmer climate leads to less CO2 being able to be stored in the oceans. Therefore, more CO2 in the atmosphere.
More at CO2 Lags Temperature in the Ice-Core Record. Doesn’t that prove the IPCC wrong?
Increases in CO2 also cause more “radiative forcing” at the earth’s surface (and throughout the troposphere).
Therefore CO2 increases can be a cause of temperature rise and a result of temperature rise.
————————————
Reply:
But your answer is wrong and illogical.
It wasn’t the rise of CO2 that caused the heating (since it trailed the heating), and it wasn’t the fall of CO2 that caused the cooling (since it trailed the cooling).
In other words, because CO2 is a Johnny-come-lately to the whole process (by 800 years, mind you, but it wouldn’t matter if it were 8 years or 800 years), it cannot be invoked as causing either the rise or fall of the temperature change. (It isn’t this phantom “tipping point” you’re looking for.)
To believe it could would require that CO2 has a memory, which it does not, or that it can project it’s influence into the future. CO2 is simply a lagging indicator of temperature, unless you’re telling us it is the product of freaky parallel universes and can somehow time travel:
http://www.foxnews.com/scitech/2010/04/05/freaky-physics-proves-parallel-universes/
Hence the complete falacy of your argument.
But I’ll allow that you did get one thing right: the influence of the TEMPERATURE on the CONCENTRATION of the gas CO2 (and NOT the other way around). You correctly pointed out that a warmer temperature regime caused more CO2 to be in the atmosphere; conversely, that a cooler temperature regime caused there to be less CO2 to be in the atmosphere. What is NOT correct is that more CO2 caused a warmer climate; converselely, that less CO2 caused a cooler climate.
You have provided the proof and logic that has destroyed your own theory.
Congratulations.

Gary
April 6, 2010 7:52 pm

Don Easterbrook (16:49:42) :

In the absence of any way to date deep sea cores accurately, orbital curves are fitted to ocean sediment cores by the ‘accordion method’ (you just expand and contract orbital cycles and deep see cores until they match and then claim that because they match, one must be the cause of the other!) Three major, major problems with the concept are (1) you can’t date deep sea cores accurately so you can’t claim temporal correspondence…

No, it’s not as haphazard as you suggest. Sediment cores can be dated reasonably accurately — within a couple of thousand years for cores with sedimentation rates of several centimeters per Kyr. It’s not like tree rings where you count annual layers, of course, but adequate for Milankovich time scales. Besides radiometric dating, extinction points for certain microfossils are known and be cross-correlated between cores. Micro-fossil abundance frequencies, CaCO2 and other chemical properties, oxygen and carbon isotope ratios, and other variables are measured to produce downcore curves that are then cross-matched to develop chronologies for each core. Using multiple measures to constrain the estimates you eventually end up with a best approximation for age to depth. It may be “wiggle-matching,” but the analysis is based on multiple curves.

edwardt
April 6, 2010 8:09 pm

The glacial has already started about 4kyrs ago. Plot Vostok and GISP2 and average. Pretty flat average until 4kyrs ago, we’re down about 0.75°C. Very similar to the 420kyr when Eccentricity and Obliquity were in phase. It was good for humanity. If you scale GISP2 for the last 3 warming periods the next one won’t be over until 2200 AD. Though we’ll likely enjoy the next 30yrs of zero to negative trend, it should resume like gang-busters if the GISP2 record is any indication. What will it be? The Sun, the Sun/Ocean, Sun/Cosmic? Fun times…

pat
April 6, 2010 8:09 pm

[snip off topic]

Andrew W
April 6, 2010 8:30 pm

Don Easterbrook (16:49:42) :
(2) if this was the cause of climate change, the climate in the southern hemisphere should always be the opposite of that in the northern hemisphere (just like modern seasons), ie. when you have a glaciation in one hemisphere, you should have an interglaciation in the other hemisphere,
That makes no sense, the axial tilt of the Earth at any particular time is the same at the south pole as the north pole, and the eccentricity of the Earths orbit at any time is the same for both hemispheres.

pat
April 6, 2010 8:33 pm

must read:
6 April: WaPo: David A. Fahrenthold: Scientists’ use of computer models to predict climate change is under attack
If policymakers don’t heed the models, “you’re throwing away information. And if you throw away information, then you know less about the future than we actually do,” said Gavin Schmidt, a climate scientist at NASA’s Goddard Institute for Space Studies.
“You can say, ‘You know what, I don’t trust the climate models, so I’m going to walk into the middle of the road with a blindfold on,’ ” Schmidt said. “But you know what, that’s not smart.” ..
“We’re never going to perfectly model reality. We would need a system as complicated as the world around us,” said Ken Fleischmann, a professor of information studies at the University of Maryland. He said scientists needed to make the uncertainties inherent in models clear: “You let people know: It’s a model. It’s not reality. We haven’t invented a crystal ball.”…
But Warren Meyer, a mechanical and aerospace engineer by training who blogs at http://www.climate-skeptic.com, said that climate models are highly flawed. He said the scientists who build them don’t know enough about solar cycles, ocean temperatures and other things that can nudge the earth’s temperature up or down. He said that because models produce results that sound impressively exact, they can give off an air of infallibility.
But, Meyer said — if the model isn’t built correctly — its results can be both precise-sounding and wrong.
“The hubris that can be associated with a model is amazing, because suddenly you take this sketchy understanding of a process, and you embody it in a model,” and it appears more trustworthy, Meyer said. “It’s almost like money laundering.” ..
If the models are as flawed as critics say, Schmidt said, “You have to ask yourself, ‘How come they work?’ ”
http://www.washingtonpost.com/wp-dyn/content/article/2010/04/05/AR2010040503722_pf.html

April 6, 2010 8:41 pm

Gary (16:44:37) is right. The seminal paper confirming the connection between Milankovic cycles and Ice Age glaciations is:
J. D. Hays, John Imbrie, N. J. Shackleton. 1976. Variations in the Earth’s Orbit: Pacemaker of the Ice Ages. Science, New Series, Vol. 194, No. 4270, (Dec. 10, 1976), pp. 1121-1132.
btw, The European Geosciences Union (EGU) has awarded Dr. James D. Hays, professor of Earth and environmental sciences at Columbia University, the 2010 Milutin Milankovic Medal. He is the last of the three authors to be awarded that prize.
http://westinstenv.org/sosf/2010/02/18/james-d-hays-awarded-2010-milutin-milankovic-medal/
Note to Anthony: I think that achievement is worth a post.
And Dr. Easterbrook (16:49:42) is also correct. There are some major questions that remain.
Note to Don: what might be useful is if you wrote a layman’s primer on the apparent flaws, with references.

April 6, 2010 8:41 pm

Ms. Lisiecki,
Thank you for your posting. WRT:

(1) This study specifically deals with the last million years. It does not include any analysis of the warming trend of the last century, which is much faster than changes that would be produced by slow changes in Earth’s orbit over tens of thousands of years. The current changes in orbit would be expected to cause gradual cooling over the next ~90,000 years.

You and Ms. Raymo have studied the relative speed of some of these cycles, then? Without knowing the resolution of the cores you took (millennial? centurial? decadal?) it’s a bit hard for a layman to imagine: how long does it take for one of these big (say, 10C) temperature swings to take? From your graph, it appears that the upswings (warming episodes) are generally much sharper, the declines more “toothy”. What accounts for the difference – and how rapid are the rises?

jorgekafkazar
April 6, 2010 8:42 pm

Lorraine Lisiecki (19:31:31) : “As the author of this study, I would like to clarify a couple points…”
Thank you. I’m a little disturbed by the unwarranted negativism here today.

AnonyMoose
April 6, 2010 8:49 pm

The behavior is being described as being stable in both extra-warm and extra-cool situations, but unstable when not in either situation. That suggests that there are strong feedbacks for both warm and cool situations, as if cold encourages warming and hot encourages cooling.
When the extreme conditions do not exist, the temperature can wander… and as has been pointed out, a few localized cool summers can start an ice age so an unstable situation may be sufficient to set up the situation to try for a few thousand summers to hit a group of cool summers.

April 6, 2010 9:02 pm

Anthony, I think you should have mentioned the great Milutin Milanković, the developer of the cycles you display in the opening graph. It would be interesting if Lorraine references the paper by, J. Imbrie, J. D. Hays, D. G. Martinson, A. McIntyre, A. C. Mix, J. J. Morley, N. G. Pisias, W. L. Prell, and N. J. Shackleton – “The orbital theory of Pleistocene climate: Support from a revised chronology of the marine δ18O record”, in Milankovich and Climate, Part 1, pages269–305. D. Reidel Publishing Company, 1984.
Not having read Lorraine’s paper, I decline to comment if she is just confirming previous research or has come to differering conclusions.
REPLY: I don’t always have time to add details. Given how busy I was today with my daytime business I’ll just skip it next time rather than have a bunch of people rant later about what I should and should not have done. Since as is typical of colleges, they don’t actually include the paper (gasp! and violate the sanctity of the journal?) we are left to guess.
It’s a crappy way to send out press releases. -A

Anu
April 6, 2010 9:08 pm

Klausb (13:10:45) :
a preprint is here:
http://www.nature.com/ngeo/journal/vaop/ncurrent/abs/ngeo828.html

That’s not a “preprint”, that’s an abstract.
A pre-print is the entire paper, usually in PDF form, kept by the scientist before some journal assumes all ownership of the finished product.
Here’s an example preprint – they sometimes have bad editing, etc:
http://arxiv.org/PS_cache/arxiv/pdf/0911/0911.3817v1.pdf
It’s usually easier to get a web copy of a paper after a few years:
http://lorraine-lisiecki.com/LisieckiRaymo2007.pdf
Plio–Pleistocene climate evolution: trends and transitions in glacial cycle dynamics
Lorraine E. Lisiecki, Maureen E. Raymo
The fact that so many papers are behind a paywall is a real hindrance to the public trying to follow the science, but that’s another topic.

April 6, 2010 9:40 pm

Sorry Anthony, I didn’t mean to criticize (which I wasn’t). I know you are more aware of the science of climatology than I and also a very busy man. So keep up the good work for those of us who believe that unbiased opinion in science should prevail without censorship and political interference.
REPLY: Apology also, I was brusque. I’m a bit testy today, I’m dealing with an internet stalker, a 50 year old eco-adolescent that has been harassing me. – A

Jack
April 6, 2010 9:51 pm

I just read an interesting post on California’s Climate. In a dead simple way he was showing warming entirely because of cities, using NASA’s surface data. I think it’s worth a look:
http://www.excelhero.com/blog/2010/04/california-climate.html

Amino Acids in Meteorites
April 6, 2010 9:53 pm

Gail Combs (19:33:03) :
…..and more importantly bringing this theory back in front of the mass media’s attention.
I didn’t see this study anywhere on tv. I do see something about Tiger woods, something about not using nuclear bombs, something about the Tea Party, …….mmmmm, but nope, no science.

Amino Acids in Meteorites
April 6, 2010 10:01 pm

REPLY: Apology also, I was brusque. I’m a bit testy today, I’m dealing with an internet stalker, a 50 year old eco-adolescent that has been harassing me. – A
I’m sure the guy has no life and nothing else to do. Don’t let him feel like he’s accomplishing anything. Let him continue going down with his global warming ship, unable to pull someone else down with him.

Ed Murphy
April 6, 2010 10:39 pm

StarBP (19:33:39) :
“the stronger changes in the Earth’s orbit correlated to weaker changes in climate.”
Uh oh… I guess that means the weaker orbital changes correlated to stronger climate changes? Take another look at that graph… look at the left side (the present). The earth’s orbit just had one of the weakest eccentricity spikes on record (spikes in eccentricity often precede glaciation). The gun is cocked… and I happen to have a theory as to what kind of rare event pulls the trigger…
The way I look at the graph weak eccentricity spikes were also at approximately 400k and 800k years ago but the last Y catastrophic eruption was around 640k years ago. That was during a pretty strong eccentricity spike. Don’t see a correlation to worry about there, in my opinion.
http://volcanoes.usgs.gov/yvo/about/faq/faqhistory.php#oftenerupt
What I’d really like to know is how much mass there really is to the Taurids Complex debris streams? If there was a large enough object elliptically orbiting within the inner solar system between the Sun and Jupiter to possibly change the orbit of Earth before it was pulled apart by those heavy hands? The same gravitational forces shaping the debris into a tubular shaped stream disc, as well as several dense core streams, or ‘belts’,  within the disc?
Something wiped out the Clovis people and the mega-mammals and caused the Younger/Dryas period.
Southern Taurids
http://star.arm.ac.uk/~aac/TCSTau.png
Northern Taurids
http://star.arm.ac.uk/~aac/TCNTau.png
http://en.wikipedia.org/wiki/Southern_Taurids
http://articles.adsabs.harvard.edu/cgi-bin/nph-iarticle_query?bibcode=1998MNRAS.297…23A&db_key=AST&page_ind=0&data_type=GIF&type=SCREEN_VIEW&classic=YES
http://articles.adsabs.harvard.edu/cgi-bin/nph-iarticle_query?bibcode=1993MNRAS.264…93A&db_key=AST&page_ind=0&data_type=GIF&type=SCREEN_VIEW&classic=YES
http://articles.adsabs.harvard.edu/cgi-bin/nph-iarticle_query?bibcode=1987MNRAS.225P..55C&db_key=AST&page_ind=0&data_type=GIF&type=SCREEN_VIEW&classic=YES
http://articles.adsabs.harvard.edu/cgi-bin/nph-iarticle_query?bibcode=1984MNRAS.211..953C&db_key=AST&page_ind=0&data_type=GIF&type=SCREEN_VIEW&classic=YES

Andrew W
April 6, 2010 11:20 pm

RockyRoad (19:38:05) :
“But your answer is wrong and illogical.”
Nope, scienceofdoom is correct, perhaps the way I put it in my 16:47:58 comment is simpler for you.

Mark Fawcett
April 6, 2010 11:30 pm

REPLY: Apology also, I was brusque. I’m a bit testy today, I’m dealing with an internet stalker, a 50 year old eco-adolescent that has been harassing me. – A
Happy to help out if you need assistance on tracing, blocking etc.
Cheers
Mark.

Mark Fawcett
April 7, 2010 1:24 am

May I extend a hearty thanks to Ms Lisiecki for responding to comments on this thread; welcome aboard.
I’d also like to take the chance to say that this article seems to have raised a large quantity of invective (unwarranted in my opinion) by certain posters, who can’t seem to be “arsed” to do a little background reading first.
Valid criticism is the cornerstone of good scientific debate, however, in this case it feels like the knives are out; seriously folks we can do better than this here. Let’s not descend to the level of other blogs shall we?
Cheers,
Mark

D. Patterson
April 7, 2010 2:01 am

Lorraine Lisiecki (19:31:31) :
Thank you for participating in the comments.
Your paper adds to an old question common to all papers which rely upon measurements of the isotopic fractions. To what extent do new sources of the isotopic fractions have a confounding effect upon measurements of the distributions of existing isotopic fractions? For example, how much of an effect does submarine and terrestrial vulcanism and its emissions of new isotopic fractions have upon the measurements of isotopic fractions resulting from climate and biological processes?
Do core sites located in the vicinity of the Mid-Atlantic Ridge such as 607, 664, and GeoB1312 have sediments indicating a discernable effect from contemporaneous vulcanism upon their isotopic fractions?

April 7, 2010 2:58 am

RockyRoad :

It wasn’t the rise of CO2 that caused the heating (since it trailed the heating), and it wasn’t the fall of CO2 that caused the cooling (since it trailed the cooling).

On your point, I agree. If you read what I wrote, rather than imagining what I wrote you would see this.

it cannot be invoked as causing either the rise or fall of the temperature change.

I agree.

But I’ll allow that you did get one thing right: the influence of the TEMPERATURE on the CONCENTRATION of the gas CO2 (and NOT the other way around). You correctly pointed out that a warmer temperature regime caused more CO2 to be in the atmosphere; conversely, that a cooler temperature regime caused there to be less CO2 to be in the atmosphere. What is NOT correct is that more CO2 caused a warmer climate; converselely, that less CO2 caused a cooler climate.
You have provided the proof and logic that has destroyed your own theory.

Here’s where you need to read what I actually wrote, rather than what you think I wrote.
For people interested in the subject, CO2 is released from the ocean when it heats (all other things being equal).
This particular piece of information tells us nothing about whether or not CO2 itself can have an effect on temperature. This 2nd piece of information is independent of the 1st piece of information.
The 1st piece of information tells us that as the ocean heats up CO2 will be released. Other properties of CO2 are still unknown as a result of knowing only this piece of information.
Is it therefore impossible that CO2 itself can have a warming effect? We cannot know from the 1st piece of information.
Is it illogical to believe two separate pieces of information about a substance?
A gas can be moved from one place (the ocean) to another (the atmosphere) as a result of warming of the ocean. And this same gas, if increased in the atmosphere, can also cause warming? Automatically impossible?
I believe many people come to this blog to learn. Hopefully most people can understand this simple and important point.
And I realize I have not demonstrated from these words that CO2 can be a warming agent – simply opened the possibility that CO2 could be both a consequence of warming and, when increased, a cause of warming.
You can see more at CO2 – An Insignificant Trace Gas?

ccole
April 7, 2010 3:45 am

So here is a paper. Now, don’t we apply what has been learned over the years at wuwt and climate audit and others:
-is data archived and available? (raw and “refined”)
-are methods explained? (suficient for replication)
-what statistical methods used? (standard techniques or mannian-like or possibly laddy-like in this case)
-are conclusions supported by the evidence
-what are the physical mechanisms linking climate to these specific climate proxies?
-is all data included in the study or convenient data?
-how are the several proxies combined into a time series?
-once a proxie time series is calculated, what time series does one choose to compare this to? isn’t the “target” time series itself a composite of data from elsewhere (that is, other data crunched to someones’ satisfaction into a temperature time series)?
I think that if empirical data can be shown to correlate with mathematically derived orbital characteristics, then we might have gained some knowledge. Because i am not an expert, it seems like we have a new set of geophysical data that is shown to be consistent with other (previeous) geophysical data.

Bob Layson
April 7, 2010 4:03 am

As with the atmospheric system and climate so goes the geosystem and earthquakes. Earthquakes appear to vary cyclically in number and intensity entirely without human assistance unless…co2 dooed it.

April 7, 2010 4:57 am

scienceofdoom (16:46:39) :
Therefore CO2 increases can be a cause of temperature rise and a result of temperature rise.
Now you just have to explain the correlation between increasing CO2 and decreasing temperatures.
During our previous plunges into the deep-freeze, CO2 continued to climb, and, after about 800 years, reversed and tracked downward. If increased CO2 *caused* the temperature rise, why wouldn’t it prevent — or at least slow — the temperature drop?

Stu
April 7, 2010 6:11 am

Bill Tuttle,
who’s to say it didn’t? Perhaps the precipitous temperature drop was slowed a little by CO2? We don’t have an alternative CO2-free scenario to compare with.
Besides, I don’t think there’s any contradiction, all that happens is the original solar forcing at the start of the ice age is amplified by albedo changes and all the other standard positive feedbacks, and CO2 is powerless to stop this.

D. Patterson
April 7, 2010 6:59 am

Bill Tuttle (04:57:00) :
scienceofdoom (16:46:39) :
Therefore CO2 increases can be a cause of temperature rise and a result of temperature rise.
Now you just have to explain the correlation between increasing CO2 and decreasing temperatures.
During our previous plunges into the deep-freeze, CO2 continued to climb, and, after about 800 years, reversed and tracked downward. If increased CO2 *caused* the temperature rise, why wouldn’t it prevent — or at least slow — the temperature drop?

On the geological timescale, atmospheric carbon dioxide and temperature are typically anti-correlated with divergent trends.

April 7, 2010 7:17 am

The recent glaciations were caused exclusively by the various Milankovitch cycles.
Case closed!!
Well, I have a problem with that.
The main change in eccentricity of the Earth’s orbit of about 100 000 years is a weak effect. It is a weak forcing and should not be a main driver for the glaciations.
Also, the rapid warming into interglacial like the Holocene is not fully explained by these cycles.
No, I’m not saying that the Milankovitch cycles do not exist, just that that explanation from them to fully explain glaciations is weak.
I don’t know if you have seen this, but there is a curious visual similarity between changes in solar flux after a solar flare and changes in the temperature, as measured from the Vostok ice cores, when an interglacial starts and when the temperature returns to the next glaciations.
We have first a large spike and then a gradual drop with several smaller upwards spikes. This does not sound to me to be caused by several sinusoidal smooth cycles.
So what could cause such climate variability? One such possible cause is of course the Sun.
I have tried to look for proxies of the solar activity.
Eventually I found it in this article.
http://unesdoc.unesco.org/images/0010/001065/106523E.pdf
On figure 2 there is a recording of Be10 from Vostok Antarctica.
In this paper they use the Be10 concentrations as a measure of snow accumulation in the ice core assuming that the Be10 concentrations are constant.
I don’t know if this is correct and that they can use other measure to correlate with timescale and link this correlation to precipitation. Can the proxy be used to measure solar activity? The Be10 half time is about 1 million years. How much is accumulated in snow.
I don’t think it is strait forward to assume that the Be10 concentration is directly related to precipitation. Be is an ion which I think quickly is being washed out of the atmosphere.
What do you think?
I do think there are reasons to look more closely at the Sun for some of the explanations for the ice ages. Here is one other article I found
http://physicsworld.com/cws/article/news/19866
I happen to be a believer in the barycentric influence on solar activity.
I write about it here, not to have a debate about it, but to explain a possible other explanation between the 100 000 year orbital Milankovitch Cycle and the climate.
This effect on the Earth is caused by variations of the orbit of the large gas planets.
This also effects the Sun and its barycentric movements.
I have ideas how this effect could directly affect the solar activity, possible causing the solar activity to enter prolonged periods of solar inactivity during glaciations.

Paul
April 7, 2010 7:31 am

@ scienceofdoom, RockyRoad, Bill Tuttle, et al.
Correct me if I’m wrong, but from what I can tell it appears that the onset of glaciation occurs much more rapidly and dramatically than the onset of warming. The temperature lines going down are steep and pretty straight, the lines going up tend to have several little peaks, and the warming intervals are much longer than the cooling ones.
So if CO2 (or any other factor) were to contribute to warming after released (the 800 year lag), should I not expect that the positive feedback would lead to a steeper, straighter curve for the warming? And should I not expect to see a slower decline during cooling? Since this appears to be the opposite of the observed temperature cycles, would the more appropriate conclusion not be that to the extent there is overall feedback in the system it tends to be negative, i.e. whatever initially causes things to start getting cold seems to trigger feedback in the system that accentuates the cooling, and whatever causes the warming to begin seems to trigger feedback that slows it down and can even temporarily reverse it?
Which does not demonstrate that CO2 does not have the effect that scienceofdoom claims, but that at the system level it would certainly seem to tell me that there are much bigger fish to fry, and that all of this focus on CO2 is really diverting attention from more worthwhile lines of inquiry.

beng
April 7, 2010 7:55 am

*******
7 04 2010
scienceofdoom (02:58:08) :
RockyRoad :
It wasn’t the rise of CO2 that caused the heating (since it trailed the heating), and it wasn’t the fall of CO2 that caused the cooling (since it trailed the cooling).
On your point, I agree. If you read what I wrote, rather than imagining what I wrote you would see this.
it cannot be invoked as causing either the rise or fall of the temperature change.
I agree.
But I’ll allow that you did get one thing right: the influence of the TEMPERATURE on the CONCENTRATION of the gas CO2 (and NOT the other way around). You correctly pointed out that a warmer temperature regime caused more CO2 to be in the atmosphere; conversely, that a cooler temperature regime caused there to be less CO2 to be in the atmosphere. What is NOT correct is that more CO2 caused a warmer climate; converselely, that less CO2 caused a cooler climate.
You have provided the proof and logic that has destroyed your own theory.
Here’s where you need to read what I actually wrote, rather than what you think I wrote.
For people interested in the subject, CO2 is released from the ocean when it heats (all other things being equal).
This particular piece of information tells us nothing about whether or not CO2 itself can have an effect on temperature. This 2nd piece of information is independent of the 1st piece of information.
The 1st piece of information tells us that as the ocean heats up CO2 will be released. Other properties of CO2 are still unknown as a result of knowing only this piece of information.
Is it therefore impossible that CO2 itself can have a warming effect? We cannot know from the 1st piece of information.
Is it illogical to believe two separate pieces of information about a substance?
A gas can be moved from one place (the ocean) to another (the atmosphere) as a result of warming of the ocean. And this same gas, if increased in the atmosphere, can also cause warming? Automatically impossible?
I believe many people come to this blog to learn. Hopefully most people can understand this simple and important point.
And I realize I have not demonstrated from these words that CO2 can be a warming agent – simply opened the possibility that CO2 could be both a consequence of warming and, when increased, a cause of warming.
You can see more at CO2 – An Insignificant Trace Gas?

*******
Scienceofdoom (BTW, your website is excellent), here’s the rub concerning CO2 lag in ice-cores. Going by standard GHG theory, the change in CO2 (oscillating between 180 to 280 ppm) should have shown some effect on the temp curves, both during the interglacial warm-up & the subsequent cool-down. But it doesn’t. The temp curve seems completely independent of the CO2 (OTOH, the CO2 shows definite dependence on the temp). The slope of temp doesn’t change a bit during the CO2 rise, and then even makes a complete reversal while CO2 is still rising! Again, as CO2 starts to fall at the end of the interglacial (after a ~1000 yr lag), no apparent effect on the temp slope.
A graph comparing the derivatives dTemperature/dtime and dCO2/dtime should show this non-correlation.
I can’t say this “proves” that CO2 causes no warming, but it’s pretty obvious that its effect is practically negligible compared to whatever effect(s) are actually causing glacial-period changes.

bubbagyro
April 7, 2010 8:08 am

Paul:
I think you can look no further than the enormous heat capacity and latent heat of crystallization of water. It takes a huge amount of heat to melt ice compared to the also large heat to evaporate water. Inertial dampening effect of H2O. Add that effect to the huge thermal sink of the deep oceans and I can see why cooling is so dramatically fast compared to heating.

Stu
April 7, 2010 8:21 am

Paul,
I think the sharp decline into an ice age is because it doesn’t take a thick layer of ice and snow to vastly increase albedo. As ice sheets and snow cover grow over a period of only decades to centuries, the global temperature drops quickly due to this feedback.
Then, during the ice age, the ice sheets grow large and thick. So when conditions become condusive for warming again, it takes a long time to melt all that ice.

Pascvaks
April 7, 2010 8:21 am

FYI – Milankovitch Cycles: History and Projection Graphic
(source Wikipedia – caveat emptor)
http://upload.wikimedia.org/wikipedia/commons/5/53/MilankovitchCyclesOrbitandCores.png

Ed Murphy
April 7, 2010 8:50 am

Uh, nobody knows about the size of this thing that was running around in the inner solar system up to maybe 20,000 years ago?
http://articles.adsabs.harvard.edu/full/seri/MNRAS/0251/0000636.000.html 
 
http://star.arm.ac.uk/~aac/zetataur.html 
Leif?

Steve Keohane
April 7, 2010 8:51 am

Re: The rapidity of onset of glaciation vs. warmth, here is a reference to 15°C warming in a decade in Greenland:
http://i43.tinypic.com/1zoanbc.jpg

maelstrom
April 7, 2010 8:53 am

Interesting. Good to see old science inspiring new science, really. Did Milankovitch, those long lonely years when he did his calculations in every available moment of free time, even on family vacation, ever hear of the Platonic Year? I dislike the term “forcings” as used by Ms. Lorraine, because it seems to imply there is a climatic stasis or ideal, but I note UCSB has long been a non-conformist holdout against total academic and cultural homogenization. You have to watch out for the cacti at night in Isla Vista though, when nature calls.

Andrew W
April 7, 2010 9:11 am

Paul,
I think you’re reading the graph back-to-front, “now” is at the left, so moving from right to left, there’s a very rapid rise in temperature to the interglacial temperature maximum, followed by a relatively slow temperature decline into the next glacial period.

Dan Lee
April 7, 2010 9:16 am


During the Ice Age scare in the 70’s I remember a very simple theory that a single anomalously cold summer would keep the previous winter’s snow from melting over significant portions of the northern hemisphere.
The albedo would reflect a summer’s worth of warmth back out into space, leading to even colder summers and so on, and the rapid decent would begin.
Just a cheery thought. 🙂 I’m sure it’s nonsense… :-/

Phillep Harding
April 7, 2010 9:23 am

Doesn’t Ms Lisiecki’s first paragraph in her (first?) post above presuppose the accuracy of the records used to “prove” the recent warming?
In addition, I’ve always wondered if short term spikes (<100 yrs or so) are able to leave enough trace for today's scientists to spot.
For those who want to chant "Old science, old science", may I point out that people who have never heared of Milankovitch CAN STILL VOTE !

April 7, 2010 9:52 am

Bill Tuttle:

Now you just have to explain the correlation between increasing CO2 and decreasing temperatures.
During our previous plunges into the deep-freeze, CO2 continued to climb, and, after about 800 years, reversed and tracked downward. If increased CO2 *caused* the temperature rise, why wouldn’t it prevent — or at least slow — the temperature drop?

Who says that CO2 caused the temperature rise?
Climate is very complex. CO2 is one factor in climate.
More CO2 will – all other things being equal – increase temperatures.
Less CO2 will – all other things being equal – reduce temperatures.
..why wouldn’t it (rising CO2) prevent — or at least slow — the temperature drop?
How much was CO2 rising? Clearly other factors were driving temperature down. These factors were bigger than any forcing effect from a few more ppm of CO2.

April 7, 2010 10:05 am

Steve Keohane (08:51:05) :
Thanks for the reference. Re:

The rapidity of onset of glaciation vs. warmth, here is a reference to 15°C warming in a decade in Greenland:
http://i43.tinypic.com/1zoanbc.jpg

From the article and your posting, it appears the warming episodes can and do happen with great(er) rapidity than the cooling phases:

Ice core records from Greenland show in less than a decade there was a sudden warming of around 15 degrees Celsius (27 degrees F) of the annual mean temperature. At the same time a doubling of annual precipitation occurred.
Researcher: Richard Alley

It appears the descents into cooling happen with nowhere near this rapidity.
“Timing of Major Climate Terminations”, M.E. Raymo, Paleoceanography, 1997
http://www.moraymo.us/1997_Raymo.Terminations.pdf
If true, “quick” warm-ups are the “norm”, on the million-year and greater time scale discussed here.

April 7, 2010 10:09 am

Read the graphs from right to left.

April 7, 2010 10:24 am

beng:

Going by standard GHG theory, the change in CO2 (oscillating between 180 to 280 ppm) should have shown some effect on the temp curves, both during the interglacial warm-up & the subsequent cool-down. But it doesn’t. The temp curve seems completely independent of the CO2 (OTOH, the CO2 shows definite dependence on the temp). The slope of temp doesn’t change a bit during the CO2 rise, and then even makes a complete reversal while CO2 is still rising! Again, as CO2 starts to fall at the end of the interglacial (after a ~1000 yr lag), no apparent effect on the temp slope.
A graph comparing the derivatives dTemperature/dtime and dCO2/dtime should show this non-correlation.
I can’t say this “proves” that CO2 causes no warming, but it’s pretty obvious that its effect is practically negligible compared to whatever effect(s) are actually causing glacial-period changes.

There’s much everyone would like to know about causes of past temperature rises and falls.
..should have shown some effect on the temp curves..” – are you sure the data gives this level of accuracy?
It seems hard enough to separate out causes in modern climate with a detailed instrument record.

April 7, 2010 10:46 am

When I read through the comments here and on other recent posts the picture “presented” is 1000s of climate scientists writing frantically about CO2.
-Why don’t they look at the bigger picture?
-Don’t they realize that climate is much more than CO2?
-Why this narrow focus?
Perhaps climate science is not as pictured..
Subjects of research –
– how much water vapor is in the stratosphere (plus past trends as can be uncovered) and how it gets there
– effect of stratospheric water vapor on stratospheric and tropospheric temperatures
– how the thermohaline current has changed, what effect it has on climate, what caused it to change in the past, how to model it better now
– what factors affect ice sheet melt, how to measure ice melt and understand the sea level budget
– cloud formation, cloud effect on climate, how to measure cloud effect (the “gordian knot” of climate models)
– measurement of aerosols, changes in aerosol composition, optical properties
– measuring water vapor more accurately in the troposphere, understanding the changes in water vapor
..it’s a long list, these were just the ones that came to mind.
There are lots of things that aren’t measured very well and need more comprehensive, more accurate measurements.
There are lots of factors that are poorly understood and need more research.
Not many people working out CO2’s effect on temperature.
Surprising?

kwik
April 7, 2010 11:29 am

RockyRoad (19:38:05) :
scienceofdoom (16:46:39) :
The best from Callion et al on the proof that the CO2 lag of 800 years after temperature isnt in the increasing phase of the curve.
The best proof is when everything turns and start decreasing again. If CO2 induces more warmth , the temperature should continue to rise. Right?
But it doesnt. Temperature starts decreasing FIRST, and THEN CO2 comes down.
There is indeed no tipping point, and it is indeed increased temperature that induces more CO2 . And less temperature gives less CO2.
Henry’s law, me thinks.

George E. Smith
April 7, 2010 12:00 pm

“”” Lorraine Lisiecki (19:31:31) :
As the author of this study, I would like to clarify a couple points.
(1) This study specifically deals with the last million years. It does not include any analysis of the warming trend of the last century, which is much faster than changes that would be produced by slow changes in Earth’s orbit over tens of thousands of years. The current changes in orbit would be expected to cause gradual cooling over the next ~90,000 years. “””
Well Lorraine (if that’s ok with you), as one here who basically said; “ho-hum”; not meant in any derogatory sense at all; but to say “how does that help us with today’s climate ssues; or maybe that’s tomorrow’s issues”; that little gem above; “”” The current changes in orbit would be expected to cause gradual cooling over the next ~90,000 years. “”” makes it worthwhile that Anthony referenced your paper at WUWT.
And I’m happy to see you didn’t then go on to add that “what humans are doing to destroy the planet may overcome, and reverse that cooling trend.”
We can add that caveat ourselves; if we are among those who believe in AGW; or we can say; that’s nice to know and also a slow enough effect; to not get involved in current political discussions about what humanity’s actions should be.
So thank you so much for coming here to this hornet’s nest to make those clarifications; and also good luck with the reception of your work by your peers with geologically time framed minds. Maybe we will see your paper cited often in the future literature.
George

Tim
April 7, 2010 1:01 pm

Yes this is the Milankovich cycles but Mr. Milankovich isn’t around to defend his work and spell it out nice and slowly to the AWG crowd so she is making a big contribution. AWG proponents like to dismiss the Milankovich cycles but she seems capable of defending her work which is a good thing.
Verification and a slightly deeper understanding of the work that Milankovich started is always a good thing. The fact that she is doing real science should get applause from all of us.

Steve Keohane
April 7, 2010 1:36 pm

Bill Parsons (10:05:20) : Looking at the big picture, it seems to me that every 100K years some mechanism injects a lot of heat into the earth’s climate system and it slowly loses it until the next injection.

Steve Fitzpatrick
April 7, 2010 3:49 pm

Lorraine Lisiecki (19:31:31)
Should you happen to come back: I purchased and read your article. I found it interesting and insightful; it is a very different way of looking at the 100 K-year pattern that makes a lot of sense, since it eliminates the conundrum of the very weak forcing associated with eccentricity being responsible for the timing of recent ice ages.
The inherent oscillation you propose (phase locked with the 100 K-year eccentricity cycle) is consistent with the rather rapid and large temperature changes that have taken place even during recent glacial periods. The absence of rapid/large temperature changes prior to the initial glaciation of Greenland (indeed rather remarkable temperature stability over several million years at ~2C above the present average temperature) would appear (to me at least!) to support snow/ice albedo effects as the principle feed-back that drives glacial cycles. You noted the closure of the isthmus of Panama as possibly causing the initial glaciation of Greenland. It is not clear to me why this would cause glaciation of Greenland. A gradual drop of atmospheric CO2 in the period leading up to the onset of 41 K-year cycles would seem to be a reasonable explanation.
I wonder what (if any) constraints on climate sensitivity to CO2 concentrations could be drawn from your analysis of ocean sediments. The relative stable climate, at ~2C above present temperatures, prior to the start of glaciation cycles in Greenland, combined with estimates of atmospheric CO2 during the same period ought to shed some light on climate sensitivity in the absence of snow/ice albedo feed-back in the Northern hemisphere.

Steve Goddard
April 7, 2010 4:06 pm

Starwatcher (17:44:29) :
A feedback gain of greater than 1.0 is not necessary to produce instability.
Here is the series of feedbacks for a gain of 0.9
1.0
1.9
3.61
6.859
13.0321
24.76099
47.045881
89.3871739
169.83563041
322.687697779
613.1066257801
1164.90258898219
2213.31491906616
Even a gain of 0.1 produces rapid instability.
1
1.1
1.21
1.331
1.4641
1.61051
1.771561
1.9487171
2.14358881
2.357947691
2.5937424601
2.85311670611
3.138428376721
3.4522712143931
3.79749833583242
4.17724816941566
4.59497298635722
5.05447028499294
5.55991731349224
6.11590904484146
6.72749994932561
7.40024994425817
8.14027493868399
8.95430243255239
9.84973267580763
10.8347059433884
11.9181765377272
13.1099941915

StarBP
April 7, 2010 4:24 pm

Ed Murphy (22:39:32) : The way I look at the graph weak eccentricity spikes were also at approximately 400k and 800k years ago but the last Y catastrophic eruption was around 640k years ago. That was during a pretty strong eccentricity spike. Don’t see a correlation to worry about there, in my opinion.
I didn’t say that’s the only thing that can change the state of the cycle; I’m just saying that according to the “seven summers speculation” (that a few cold summers in a row can tip the glass over), a VEI-8 eruption in a non-tropical region would be one of the possible triggers. This would be one of the only such mechanisms that causes an instantaneous (in under a decade) switch.

suricat
April 7, 2010 5:02 pm

Per Strandberg (07:17:56) :
“”The recent glaciations were caused exclusively by the various Milankovitch cycles.
Case closed!!
Well, I have a problem with that.””
So do I! I’ve been thinking along these lines for a while now. Be-10 is only formed when cosmic rays enter Earth’s atmosphere, but solar wind ~prevents cosmic rays from entering the solar system. Conclusion! Be-10 can only be formed to any degree during solar minima.
What do we know about other observations during a solar minimum? The hydrological cycle slows giving, slightly increased precipitation, less evaporation and lowering of the effective height of the tropopause as minimum approaches – and then – slightly decreased precipitation, more evaporation and raising of the effective height of the tropopause as the minimum recedes into history. Doesn’t this indicate a lower energy throughput at solar minimum causing less forcing to the hydrological cycle?
How can this be, when ‘total solar irradiation’ (TSI) only alters by ~1%! Perhaps we need to look at ocean insolation for a clue. Which spectrum warms the ocean with greatest efficiency. In a lab, the ‘infrared’ (IR) spectrum only penetrates pure water to a depth of a few metres, the ‘visible’ (vis) spectrum penetrates pure water to a depth of several tens of metres and the ‘ultraviolet’ (UV) spectrum penetrates pure water to a depth of several hundred metres (or part of the UV spectrum would, as it doesn’t all get to strike the Earth’s surface).
Because a short penetration depth to extinction of the energy can be assumed to be more efficient for thermal energy transfer (a longer path to extinction encompasses a greater chance of energy absorption by a non thermal event e.g. use of the vis spectrum in photosynthesis, or use of the UV spectrum in molecule smashing) the IR spectrum must be considered as the most “efficient” and the UV spectrum as the least “efficient”. However, this doesn’t take into account the stability of the IR and vis spectra during transitions between minima and maxima of solar cycles, whereas the UV spectrum alters by ~30% during these transitions and IMHO (I’m only an engineer and no scientist) seems to be the hydrological forcing that alters the hydrological cycle during these solar transitions.
There’s more to this. Earth’s atmosphere becomes acclimatised to UV insolation. The greater the rate of the full UV spectrum that is directed at Earth’s atmosphere, the greater the rate of ozone generation which absorbs IR from ‘outgoing long-wave radiation’ (OLR) in the upper stratosphere (lower ionosphere). However, it also absorbs IR insolation and assists global cooling (the greenhouse effect [GHE] works both ways). I’m beginning to think of the ozone layer as the most important layer of Earth’s atmosphere. It’s more likely that the “run up” and “run down” of UV during solar transitions has the most effect on climate per se.
Where does this leave us with periods of glaciation? Well I don’t think that Sol’s Barycenter actually makes much difference (a minor “Milankovich” type perturbation), but that “tidal” influence within Sol’s entity does.
This is a bit OT for here. If you want to discuss it’s best taken to your site!
Best regards, suricat.

Gail Combs
April 7, 2010 5:24 pm

Amino Acids in Meteorites (21:53:00) :
Gail Combs (19:33:03) :
…..and more importantly bringing this theory back in front of the mass media’s attention.
I didn’t see this study anywhere on tv. I do see something about Tiger woods, something about not using nuclear bombs, something about the Tea Party, …….mmmmm, but nope, no science.
Reply:
I quit watching the boob tube in 1974 so I would not know. However she has over 60,000 hits on google and it is not just on science type blogs.

Gail Combs
April 7, 2010 5:47 pm

Paul (07:31:43) :
@ scienceofdoom, RockyRoad, Bill Tuttle, et al.
“Correct me if I’m wrong, but from what I can tell it appears that the onset of glaciation occurs much more rapidly and dramatically than the onset of warming…..”
Here is the study on that http://www.whoi.edu/page.do?pid=12455&tid=282&cid=10046
“The best known example of these events is the Younger Dryas cooling of about 12,000 years ago, named for arctic wildflower remains identified in northern European sediments. This event began and ended within a decade and for its 1000 year duration the North Atlantic region was about 5°C colder. “
http://www.newscientist.com/article/mg20427344.800-mini-ice-age-took-hold-of-europe-in-months.html

George E. Smith
April 7, 2010 5:51 pm

“”” suricat (17:02:28) :
Per Strandberg (07:17:56) :
“”The recent glaciations were caused exclusively by the various Milankovitch cycles.
Case closed!!
Well, I have a problem with that.””
So do I! I’ve been thinking along these lines for a while now. Be-10 is only formed when cosmic rays enter Earth’s atmosphere, but solar wind ~prevents cosmic rays from entering the solar system. Conclusion! Be-10 can only be formed to any degree during solar minima.
…………..
How can this be, when ‘total solar irradiation’ (TSI) only alters by ~1%!
Actually suricat, TSI during a solar cycle only varies by 0.1%, not 1% as you state.
And that 0.1% can only explain 0.025% or 0.072 deg C change in some imagined black body equilibrium earth temperature (counting earth’s typical Albedo reduction and atmospheric absorption).
TSI does not explain things like the recent brief natural warming period.
If earth’s feedback regulator can take care of 30% less TSI during the early “weak sun” period; it can certainly squish any 0.1% sunspot cyclic TSI changes.

George E. Smith
April 7, 2010 5:55 pm

“”” Steve Goddard (16:06:34) :
Starwatcher (17:44:29) :
A feedback gain of greater than 1.0 is not necessary to produce instability.
Here is the series of feedbacks for a gain of 0.9
1.0
1.9
3.61 “””
Well Steve, I think most feedback discussion would consider “gain” to be Output/input, rather than output-input.
So in your example here, the gain is 1.9, not 0.9, and it most certainly could be unstable; depending on the time relationship, between input and output.
George

George E. Smith
April 7, 2010 6:32 pm

The history of “high gain” wide bandwidth” electronic amplifiers, includes a class of amplifiers, oknown as “Distributed amplifiers”.
A “distributed amplifier” contains a number of active gain elements (vaccuum tubes back then; maybe MOSFETS today). The inputs of the gain elements; grid or gate electrode, are “distributed” along a transmission line; invariably a lumped constant transmission line, in which the input stray capacitance (grid to cathode, or gate to source capacitance) formed the shunt element of the transmission line, and series inductors, often T-coupled inductors, comprised the series impedance elements. The L/C ratio at each transmission line section, set the characteristic impedance of the line, while the LC product set the propagation delay per section, for the input signal injected into the transmission line.
The output of each active element (plate or drain element) was likewise connected as part of an output transmission line, where the output stray capacitance (plate to cathode, or drain to source) formed the shunt element of an output transmission line, once again with series or T-element coupled inductors between each active element.
Teh LC product for the output transmission line, was made identical to that for the input transmission line, and the L/C ratio set the output line impedance.
Teh result was that a travelling wave input signal was sequentially applied to each active element, and its resultant output current was dumped onto an output line synchronously timed, so the outputs all added in just as the output travelling wave arrived at the correct timing.
As a result, one could have a low impedance output line, such that the Voltage gain for any one gain element; tube or MOSFET, might be less than one; but now the contributions of each active element simply add arithmetically, until the total Voltage gain was greater than one.
At that point one could couple the signal from the output transmission line of one “stage” to the input transmission line of a second stage, to get a gain multiplication.
One could put a lot of elements on a single stage, to get a large stage gain; or one could have many stages with small gains >1.0 which multiplied to a larger gain, to get some overall gain value.
One could prove that the total number of gain devices (tubes or FETs) was minimum, if each cascaded gain stage, had a Voltage gain of sqrt(e) = 1.648.
For a regular cascaded amplifier, the optimum stage fggain for maximum gain bandwidth product is (e = 2.718)
Maybe I have those two reversed; but some young electronics whizz can correct me on that.
In any case; it was a method of getting very large gain bandwidth products with devices that weren’t too swift by today’s standards.
The all time Classic implementation of a distributed amplifier, was the Vertical amplifier of the Tektronix type 511 oscilloscope. This scope had an input impedance for the input transmission line of 170 Ohms; which was very high for a coaxial transmission line; and was a special edition of the General Radio type 874 rigid coaxial line hardware.
The bulk of the amplifier was a collection of push pull triode stages using dual triode tubes; and taking advanbtage of crosscoupling of the push pull lines to neutralize the grid to plae capacitance of the triode vaccuum tubes. Totally bloody clever. There was a total of 156 vaccuum tubes in that amplifier which had a 50 MHz -3dB bandwidth, and a 50 mV per cm sensitivity from input line to the direct drive to the CRT deflection plates.
If it hadn’t been for somebody in the physics department blowing the smithereens out of the 170 Ohm termination resistor in that input stage, on the scope we had, I would now be a rich sheep farmer in NZ, instead of a struggling Physicist trying to make a living doing optics for Optical mice.
Funny how things happen.
But in any case; gain is usually considered a multiplier, and not an adder.

Steve Goddard
April 7, 2010 8:55 pm

George E. Smith (17:55:43) :
Think about what you are saying. You are suggesting a series of
1.0
0.9
0.81
0.73
That would be negative feedback, where each successive iteration is smaller than the previous one. We are discussing positive feedback.
A multiplier of 1.0 would be no feedback.
1.0
1.0
1.0
1.0
1.0
1.0
1.0
1.0
1.0
1.0
1.0
1.0
1.0
1.0
1.0
1.0
1.0
1.0
1.0
1.0
1.0
1.0
1.0
1.0
1.0
1.0
1.0
1.0
1.0
1.0
1.0
1.0
1.0
1.0
1.0
1.0
1.0
1.0
1.0
1.0
1.0
1.0

Steve Goddard
April 8, 2010 5:03 am

George E. Smith (17:55:43) :
I thought it over some more and you are correct
The feedback formula is something like F + F^2 + F^3 + F ^4 + …… F^N which does converge on a finite number for any value of F less than 1

Steve Goddard
April 8, 2010 5:15 am

Elaborating on that last post, a significant positive feedback would cause wild swings up and down in temperature, which we don’t see.
Hansen implies here on slide 14 that feedbacks are much larger than forcings, which is not what we see in the temperature record.
http://www.columbia.edu/~jeh1/2008/illwesleyan_20080219.pdf

suricat
April 8, 2010 6:13 am

George E. Smith (17:51:35) :
“”Actually suricat, TSI during a solar cycle only varies by 0.1%, not 1% as you state””
I just knew that someone would pick up on this, I was being generous. I find that TSI is a confusing term that originates from astronomers being able to relate to a star’s magnitude in the vis spectrum. We seem to confound this when discussing Sol.
For example, how can TSI only vary by 0.1% when sunspots are observed to cause <-0.3% reduction in TSI? Can they only be measuring the vis spectrum where the extra brightness is made up by faculae, or do they measure the entire EM spectrum?
I was generous with TSI variation because of measurement uncertainties and TSI variation isn't the point, but the variation in the UV spectrum as ocean surface insolation 'is' the point. Ocean surface insolation of UV is the greatest variable and it also penetrates to greatest depth.
""If earth's feedback regulator can take care of 30% less TSI during the early "weak sun" period; it can certainly squish any 0.1% sunspot cyclic TSI changes.""
Again, "weak sun" is confusing. A young Sol must actually have been more energetic, thus I should imagine was frequency shifted to a higher spectral frequency emission band (not my usual field). However, besides the fact that Earth's atmospheric composition was different then, what changes were there to ocean surface insolation? Without free atmospheric oxygen, I'm sure there would have been a lot more UV on the ocean. This is a world away from current scenarios.
Best regards, suricat.

Phil Brisley
April 8, 2010 7:05 am

I’m late to this thread and I’m hoping someone can help.
Wonderful paper Ms. Lisiecki, a necessary gem for the climate debate, and thank you Mr. Watts for this post.
My question: I gather that perihelion, the orbital/axial position that begins an interglacial occurred a while ago, does anyone know when?, and, when will its opposite, the axihelion occur?

Phil Brisley
April 8, 2010 9:23 am

Correction to above question:
when will its opposite, the aphelion occur?

Cold Englishman
April 8, 2010 9:43 am

Yes, the principles of eccentricity, progression etc, are well known even to cartographic surveyors like me. What is really good about this post is that at last somebody is doing real science, providing good data, and telling us about it. For far too long we have had vested interests, bullying us with CO2, which is politics not science. Petrol prices in England today have reached £1.20 per LITRE.
Probably 80% of which is tax, the real “reason d’etre” of Climate Science.

George E. Smith
April 8, 2010 1:01 pm

“”” suricat (06:13:23) :
George E. Smith (17:51:35) :
“”Actually suricat, TSI during a solar cycle only varies by 0.1%, not 1% as you state””
I just knew that someone would pick up on this, I was being generous. I find that TSI is a confusing term that originates from astronomers being able to relate to a star’s magnitude in the vis spectrum. We seem to confound this when discussing Sol.
For example, how can TSI only vary by 0.1% when sunspots are observed to cause <-0.3% reduction in TSI? Can they only be measuring the vis spectrum where the extra brightness is made up by faculae, or do they measure the entire EM spectrum? """
Well Suricat, the 0.1% figure I cited is well supported. We have had a series of satellites, that have observed and measured TSI over about three complete (11year) sunspot cycles, so 1 1/2 full 22 year magnetic cycles. These plots are widely available; perhaps Leif Svalgaard, can point you to the definitive web location. They clearly show a mean TSI of about 1366 W/m^2, with a P-P amplitude of about 1.3-.4 . Unfortunately, the several satellites that gathered this data, slightly disagree on absolute value; but the cyclic variation is well matched.
Now of course those curves show short term fluctuations that exceed these values; I don't call them "noise", because the really are signal; but a "noisy" signal. And very possibly those spikes do support the 0.3% spike due to a sunspot that you mention; these however are very short term transient events.
And yes; these satellite sensors do include a rather wide spectral range; although not the complete EM spectrum, which must cover at least 24 octaves of frequency range; from down to, but not including DC; out to beyond cosmetic rays.
However standard black body radiation theory shows that the vast majority of the energy is contained in a relatively small range. For rough numbers 98% of the BB spectrum lies between 0.5 times the peak wavelenght to 8 times the peak wavelenght with 1% beyond each end. That for the sun is 250 nm to 4.0 microns.
The actual spectral radiant incidence is down to 10^-5 of the peak value, at 0.2, and 40 times the peak, or 100nm to 20.0 microns for the solar spectrum.
As to this statement:P- """ Ocean surface insolation of UV is the greatest variable and it also penetrates to greatest depth. """
I can support the first assertion. The greatest deviation of the extra-atmospheric solar spectrum (so far as I know) from a perfect black body spectrum occurs in the UV where the sun is anomalously brighter than the roughly 6000 K temperature. My guess is that could be from the much hotter outer reaches of the sun (sorry Leif, my mind simply won't return the correct term).
The ground level solar spectrum is also known to be highly variable in the UV region. This can be ascribed to Ozone variability. Long before there were ozone holes (by name), it was widely known that the sun had a seasonally variable apparent color temperature; which also changed randomly over time. I have argued from time to time; that this phenomenon; known certainly back in the 1940s or earlier; was solid evidence that ozone holes had always been with us; long before there were CFCs. So no argument to your first point;
But the second part, is quite wrong.
Sea water (clean deep ocean) has its lowest spectral absorption coefficient of 0.0001 cm^-1 at a wavelength of 460 nm in the blue region of the spectrum. It is already ten times that value at the 380 nm boundary between visible and UV , and is about 0.015-0.02 at 300 nm, increasing to 0.1cm^-1 at 200 nm, where it shoots up to about 30 cm^-1 by about 180 nm. Now this is vaccuum UV, so there is virtually none of that reaches the ocean surface anyway.
In contrast, in the IR end of the spectrum, water absorptance reaches 30 cm^-1 at the 1.5 and 2.0 micron water absorption band peaks. At 3.0 microns, Water has its maximum spectral absorptance of about 9000 cm^-1, which places the 1/e depth at 1.1 microns depth. Beyond 3.0 microns, water averages about 1000 cm^-1 which makes the 1/e depth for lLWIR at 10 microns; well at least out to 10.0 microns; and the curve I have shows no sign of letting up at that point.
I hate it that I cannot cut and paste graphs and plots from text books; because it takes 1000 words to describe one picture.

George E. Smith
April 8, 2010 1:06 pm

“”” Steve Goddard (05:03:04) :
George E. Smith (17:55:43) :
I thought it over some more and you are correct
The feedback formula is something like F + F^2 + F^3 + F ^4 + …… F^N which does converge on a finite number for any value of F less than 1 “””
No biggie Steve; I figured you would see it yourself; if somebody just pointed that out
But we are on the same page; no way this thing can get into a runaway Venus condition; just isn’t possible; no matter what; as Bill Shockley would put it.

George E. Smith
April 8, 2010 2:18 pm

“”” George E. Smith (13:06:28) : Your comment is awaiting moderation
“”” Steve Goddard (05:03:04) :
George E. Smith (17:55:43) :
I thought it over some more and you are correct “””
Steve, I’m an old Circuits guy, so I tend to think of “feedback” in circuit terms.
In that methodology, a POSITIVE feedback would be any “signal” that is some fraction of the OUTPUT, that is ADDED to the original INPUT signal, so as to INCREASE the apparent input seen by the AMPLIFIER (or forward gain function). That would then make the output larger (but not necessarily unstable).
On the other hand a NEGATIVE feedback sould be any “signal” that is some fraction of the OUTPUT, that is SUBTRACTED from the original input signal, so as to DECREASE the apparent input seen by the AMPLIFIER. That would then make the output smaller.
Maybe we can draw this somehow:-
Original input signal is (i), Amplifier gain (low frequency) is (A), and output signal is (o).
Sans feedback we simply have: o = i.A so if ( A) is highly variable, then so is (o) even for a fixed (i).
So now we invoke a feedback with a factor (b) of the output being fed back to the input. Let’s do negative FB first.
Output = 0 = i.A, feedback signal = o.b = i.A.b; net input to amp is i-o.b
Then we must have: o = A.(i-o.b) Collecting up terms we get:
o(1+b.A) = i.A giving : o =i. A/(1+b.A)
If we make (A) extremely large and b.A >>1, then we have approximately:
o = i/b So now we have an output that is virtually independent of (A) and depends only on the feedback factor (b), and of course the original signal (i).
For example if we make (b) = 0.01, and A = 1E6
Then o =i. 1000,000/(1+0.01*1000,000) = i.1000,000/10,001 = i.99.99(00009999). 1/b of course is 100.
So now let us drop A from a million down to only 10,000, for my stone dead vaccuum tubes.
Then 0 = i. 10,000/(1+0.01*10000) = i.10,000/101 = i.99.0099….
So my dead amplifier whose gain dropped by a factor of 100, only changed my output by 1% from 99.99 down to 99.01. Negative feedback is magic.
Now of course we don’t get any forward gains of a million in the climate system; but it’s very simple with operational amplifiers. So climate feedbacks aren’t nearly so dramatic.
But back now to positive feedback case; well we simply reverse the sign of the fed back signal.
So now effective input signal goes from i to i+o.b
And we have o(1-b.A) = i.A giving o = i.A/(1-b.A) And we can see that the output will go towards infinity, as b.A approaches 1. With the above op-amp numbers we had b.A at 10,000 and 100, and both would go totally ape.
So in the case of POSITIVE feedback we must have b.A 1, then as you point out the output will grow without limit.
Now the very real problem in feedback, is that the above analyses, assume instantaneous feedback from output to input. In op-amp circuits, that could be nanoseconds to milliseconds. So if the input signal is varying, the varying output signal will be delayed from that, and by the time the feedback signal arrives back at the input to get dummed or differenced with the real input, that time lag, can turn what was supposed to be negative feedback, into positive feedback > 1, and you have an oscillator.
That is the constant bgaboo of feedback circuit designers; and ther are rigid conditions for stability.
When was the last time you ever heard some climate scientist Steve, talk about the time or frequency response of his feedback model of the climate.
Although climate “amplifier” systems do not have gains of hundreds or millions, there is nothing in the above feedback equations that says (A) has to be very much larger than 1. If b.A is greater than 1 so we have constant growth with +ve feedback, then even if A were <1), A/(1-b.A) will still grow without limit.
So the runaway condition for the climate is the same as for the op-amp; no matter how low the forward gain (A) actually is in whatever climate system we are modelling, when we have positive feedback. And if the output (CO2 increase) is delayed from the input (surface temperature increase); how's about 800 years, then we can expect an oscillation to occur in some circumstances.
But nobody in "climatology" seems to be concerned about the frequency response of their climate feedbacks. Well not so I have noticed.
George

suricat
April 8, 2010 2:36 pm

George E. Smith (13:01:02) :
Thanks for the response George, you’re right! The graph I’m looking at is crap. Blue vis spectrum should have greatest ocean depth penetration, with some UVa.
I googled for a better graph and came up with this:
http://books.google.com/books?id=C5kRs1z_CYoC&pg=PA56&lpg=PA56&dq=UV+absorption+of+water+vapour&source=bl&ots=bLYkuKb6z8&sig=ShuCKHswM8g8Axo3FbNG27gSi7w&hl=en&ei=7KqASrLnO8SMjAem5IH2CQ&sa=X&oi=book_result&ct=result&resnum=9#v=onepage&q&f=false
Page 63, figure 2.13., but it isn’t oceanic water. I think I’ll keep this for a favourites page though, it looks like a good reference. 🙂
“”I can support the first assertion. The greatest deviation of the extra-atmospheric solar spectrum (so far as I know) from a perfect black body spectrum occurs in the UV where the sun is anomalously brighter than the roughly 6000 K temperature. My guess is that could be from the much hotter outer reaches of the sun (sorry Leif, my mind simply won’t return the correct term).””
No need to ask Leif, the source of this is actually the dark sunspot itself. This is what confounds me when claims are made that dark sunspots reduce the TSI level. They’re so ‘hot’ that you can’t see them and I would have thought actually added to the TSI level, not reduced it.
FWIW, I think the ozone hole has been there longer than we’d care to think as well.
Best regards, suricat.

phlogiston
April 8, 2010 4:29 pm

Phil Brisley (07:05:53)
Perihelion was on January 3 this year (2010). So that should make aphelion around July 3.

phlogiston
April 8, 2010 4:47 pm

Lorraine Lisiecki (19:31:31)
How does your reconstruction of 1M year global temperatures from sediments, correlate with ice cores such as Vostok? If it is a good correlation, this is pretty impressive validation of both reconstructions.

David Deming
April 8, 2010 5:28 pm

How did she date the cores? The problem with this type of research in the past has been circular reasoning. Researchers “dated” the sediment cycles by correlating them with the solar cycles. They then turned around and pronounced that there was a cause-and-effect relationship between the two. So far as I’m aware, the Devil’s Hole data still falsify Milankovitch, or at least present a big problem for conventional Milankovitch theory.

Northern Exposure
April 8, 2010 6:47 pm

Brrr… time to get out the extra extra thick mukluks and touques it looks like.
It would be interesting to find out if the cyclical change(s) from, specifically, interglacial to glacial is preceded by intense warming just before it drops to intense cooling…
That could very well explain a lot…

beng
April 9, 2010 7:26 am

******
8 04 2010
Phil Brisley (09:23:50) :
Correction to above question:
when will its opposite, the aphelion occur?

******
Answer — pretty much right now. The earth is farthest from the sun around early July & closest early January. So we’re in the period when, usually, interglacials end (being more of a N hemisphere event). Whether that will happen, nobody can say. The interglacial period at ~400k yrs ago was unusually long & lasted over several 10k yr cycles before returning to glacial conditions.

April 9, 2010 9:17 am

phlogiston (16:47:55) :
Lorraine Lisiecki (19:31:31)
How does your reconstruction of 1M year global temperatures from sediments, correlate with ice cores such as Vostok?

She may do the correlation herself (or describe her sampling methods) somewhere. I didn’t see it either in her “Plio-Pleistocene Climate Evolution…” paper (linked above somewhere).
Just eyeballing the Wiki reproduction of Vostok and EPICA…
http://en.wikipedia.org/wiki/File:Ice_Age_Temperature.png
Dr. Lisiecki’s sediment cores suggest an approximate match for the frequency and timing of the last 6 interglacials (all that are covered in the last half-million-year Wiki graph). The sawtooth configuration of interglacials, with sudden warm-ups and gradual cool-offs, are also similar. Temps seemed to peak, in all three studies, at about the same time:
400,000 years ago
330,000
240,000
210,000
125,000
Hope she comments.

Phil Brisley
April 9, 2010 12:28 pm

phlogiston (16:29:28):
beng (07:26:16):
Thanks for the replies, my question was poorly phrased.
I resubmit: When did the orbital/axial event that begins an interglacial, with NH summer solstice at perihelion and the axial tilt maxed out at 24.5 degrees with the orbit in maximum eccentricity occur?, and conversley, when will the opposite orbital/axial event (that is, the NH summer solstice at aphelion with the axial tilt at its minimum and the orbit in minimum eccentricity) occur?

George E. Smith
April 9, 2010 12:28 pm

“”” suricat (14:36:16) :
George E. Smith (13:01:02) :
Thanks for the response George, you’re right! The graph I’m looking at is crap. Blue vis spectrum should have greatest ocean depth penetration, with some UVa.
I googled for a better graph and came up with this:
http://books.google.com/books?id=C5kRs1z_CYoC&pg=PA56&lpg=PA56&dq=UV+absorption+of+water+vapour&source=bl&ots=bLYkuKb6z8&sig=ShuCKHswM8g8Axo3FbNG27gSi7w&hl=en&ei=7KqASrLnO8SMjAem5IH2CQ&sa=X&oi=book_result&ct=result&resnum=9#v=onepage&q&f=false
Page 63, figure 2.13., but it isn’t oceanic water. I think I’ll keep this for a favourites page though, it looks like a good reference. 🙂
“”I can support the first assertion. The greatest deviation of the extra-atmospheric solar spectrum (so far as I know) from a perfect black body spectrum occurs in the UV where the sun is anomalously brighter than the roughly 6000 K temperature. My guess is that could be from the much hotter outer reaches of the sun (sorry Leif, my mind simply won’t return the correct term).””
No need to ask Leif, the source of this is actually the dark sunspot itself. This is what confounds me when claims are made that dark sunspots reduce the TSI level. They’re so ‘hot’ that you can’t see them and I would have thought actually added to the TSI level, not reduced it. “””
Suricat, the word I was struggling to find was “Corona”, so I was talking about the outer parts of the solar atmosphere where I understand temperatures can be in the million K range.
But then maybe I am wrong in assuming that region is actually responsible for the higher that 6k K BB UV amount.
As to the sun spot itself; it had always been my ‘understanding’ that sunspots were colder than the rest of the surface; which is why they look black against the background; and I think that is generally true; but Leif already explained to us, that the rim of the spot, is actually hotter than the background (and the interior of the spot) so that the NET effect of the whole spot, is in fact a HIGHER than background radiance, hence a TSI increase.
Maybe those spot perimeters could be a source of anomalous UV; but I’m thinking that the frequency of spots, and their size relative to the sun, might not be enough to explain the UV surplus anomaly.
Maybe Leif can kick in and tell us what really is the soure of that extra UV.
But I don’t disagree that the whole spot is a net TSI increase (I learn fast).

suricat
April 9, 2010 3:50 pm

George E. Smith (12:28:49) :
“”Maybe Leif can kick in and tell us what really is the soure of that extra UV.””
Unlikely, as we’re getting a bit OT here. To pull it back a bit:
It’s really the antithesis of sunspots for this thread, solar minimum. That’s when cosmic rays generate Be10 more easily. I was trying to suggest reasons why the hydrological cycle would relax during solar minima. This, in turn, would also suggest that snowfall following a minimum would be lower and the depth of Be10 to show only a narrow band in ice cores, etc..
I was also ‘toying’ with the concept that sunspots may be the end result of solar tidal forces generated by planetary orbital transitions. If so, we would have an ‘astrological’ (on a solar system scale) timetable for the exact dates of Be10 deposition, as we could ‘calculate’ the length of solar cycles and the points of solar minima. Wouldn’t this be easier, nay, make it possible?
However, I’ve already suggested that Sol’s subject is not my discipline, but if you wish to continue with this I think we should take sunspots ‘elsewhere’. That is, unless it is to determine a method for the calculation of solar minima. What would you suggest?
Best regards, suricat.

beng
April 10, 2010 10:27 am

********
9 04 2010
Phil Brisley (12:28:29) :
phlogiston (16:29:28):
beng (07:26:16):
Thanks for the replies, my question was poorly phrased.
I resubmit: When did the orbital/axial event that begins an interglacial, with NH summer solstice at perihelion and the axial tilt maxed out at 24.5 degrees with the orbit in maximum eccentricity occur?, and conversley, when will the opposite orbital/axial event (that is, the NH summer solstice at aphelion with the axial tilt at its minimum and the orbit in minimum eccentricity) occur?

*******
I’m going by memory here, so it might be best to look things up.
Look above at the top figure for the major cycle-periods.
The tilt varies from ~23 – ~24.5 deg. This is obliquity. Right now about we’re about mid-way. At 41k yrs cycle, this doesn’t seem to much influence g/i (glacial/interglacials) now, tho before 400k yrs ago it did seem to. In general, greater tilts seem to promote summer warmth — lesser tilt, cooler summers. But at the present it doesn’t seem to correlate much with the g/i events.
The time-of-yr when perihelion/aphelion (from eccentricity) occurs is called precession, w/a cycle of 22k yrs. This seems to determine the length of interglacials — they start when closest approach to sun is in N hemisphere summer, and end when NH is farthest in summer (like now) — typically about a half-cycle (11k yrs). But the interglacial at ~400k yrs ago went thru 1.5 cycles (~33k yrs) before returning to glacial.
Eccentricity is the amount of divergence of the orbit from purely circular producing the variable perihelion/aphelion distances w/a cycle of ~110k yrs. Currently this seems to dictate the overall timing of interglacial events — the “peaks” of relative high eccentricity seem to initiate these. Look at eccentricity in the top figure & the timing of the interglacials to see this correlation.
So right now we’re sitting at a point in time where the interglacials typically ended! Scary, eh? But a couple papers suggest the most similar combination of orbital characteristics compared to now occurred during the ~400k yr ago interglacial, and that the current interglacial could continue for another 22k yrs. Who knows?

phlogiston
April 11, 2010 4:22 am

Bill Parsons (09:17:48)
beng (10:27:16)
Thanks for the helpful info.

phlogiston
April 11, 2010 4:33 am

Bill Parsons (09:17:48)
beng (10:27:16)
Concerning what happens next – L. Lisiecki predicted generally a “gradual cooling over the next 90k years”. This seems a good way to hedge one’s bets. The records – e.g. Vostok – show a jagged descent but which usually starts with a quite sharp drop to a kind of “half glacial” level, followed by more fluctuation with a downward trend and eventually the full glacial chill. (But even in the middle of a full-on glacial period you can have sharp up-spikes to almost interglacial climate lasting as short as 30 years.) So I guess the drop might start with a sustained cooling (a downspike on the scale of several 100 k years can still take a century or two), but in general climate will be more variable during a cooling / glacial period than the short interglacial. Our current interglacial seems unusual in having a mini-plateau (the holocene) – others are topped by sharper spikes.

Phil Brisley
April 11, 2010 7:04 pm

beng (10:27:16)
Thanks!…..great info, I’ve enjoyed this thread more than most.