From UCSB News: (h/t to David Schnare) UCSB Geologist Discovers Pattern in Earth’s Long-Term Climate Record
![]()
| Lorraine Lisiecki |
||
|
|
||
|
|
||
|
|
||
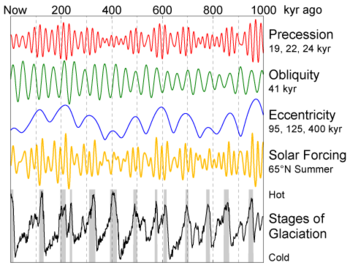
(Santa Barbara, Calif.) –– In an analysis of the past 1.2 million years, UC Santa Barbara geologist Lorraine Lisiecki discovered a pattern that connects the regular changes of the Earth’s orbital cycle to changes in the Earth’s climate. The finding is reported in this week’s issue of the scientific journal Nature Geoscience.
Lisiecki performed her analysis of climate by examining ocean sediment cores. These cores come from 57 locations around the world. By analyzing sediments, scientists are able to chart the Earth’s climate for millions of years in the past. Lisiecki’s contribution is the linking of the climate record to the history of the Earth’s orbit.
It is known that the Earth’s orbit around the sun changes shape every 100,000 years. The orbit becomes either more round or more elliptical at these intervals. The shape of the orbit is known as its “eccentricity.” A related aspect is the 41,000-year cycle in the tilt of the Earth’s axis.
Glaciation of the Earth also occurs every 100,000 years. Lisiecki found that the timing of changes in climate and eccentricity coincided. “The clear correlation between the timing of the change in orbit and the change in the Earth’s climate is strong evidence of a link between the two,” said Lisiecki. “It is unlikely that these events would not be related to one another.”
Besides finding a link between change in the shape of the orbit and the onset of glaciation, Lisiecki found a surprising correlation. She discovered that the largest glacial cycles occurred during the weakest changes in the eccentricity of Earth’s orbit –– and vice versa. She found that the stronger changes in the Earth’s orbit correlated to weaker changes in climate. “This may mean that the Earth’s climate has internal instability in addition to sensitivity to changes in the orbit,” said Lisiecki.
She concludes that the pattern of climate change over the past million years likely involves complicated interactions between different parts of the climate system, as well as three different orbital systems. The first two orbital systems are the orbit’s eccentricity, and tilt. The third is “precession,” or a change in the orientation of the rotation axis.
###
Elaborating on that last post, a significant positive feedback would cause wild swings up and down in temperature, which we don’t see.
Hansen implies here on slide 14 that feedbacks are much larger than forcings, which is not what we see in the temperature record.
http://www.columbia.edu/~jeh1/2008/illwesleyan_20080219.pdf
George E. Smith (17:51:35) :
“”Actually suricat, TSI during a solar cycle only varies by 0.1%, not 1% as you state””
I just knew that someone would pick up on this, I was being generous. I find that TSI is a confusing term that originates from astronomers being able to relate to a star’s magnitude in the vis spectrum. We seem to confound this when discussing Sol.
For example, how can TSI only vary by 0.1% when sunspots are observed to cause <-0.3% reduction in TSI? Can they only be measuring the vis spectrum where the extra brightness is made up by faculae, or do they measure the entire EM spectrum?
I was generous with TSI variation because of measurement uncertainties and TSI variation isn't the point, but the variation in the UV spectrum as ocean surface insolation 'is' the point. Ocean surface insolation of UV is the greatest variable and it also penetrates to greatest depth.
""If earth's feedback regulator can take care of 30% less TSI during the early "weak sun" period; it can certainly squish any 0.1% sunspot cyclic TSI changes.""
Again, "weak sun" is confusing. A young Sol must actually have been more energetic, thus I should imagine was frequency shifted to a higher spectral frequency emission band (not my usual field). However, besides the fact that Earth's atmospheric composition was different then, what changes were there to ocean surface insolation? Without free atmospheric oxygen, I'm sure there would have been a lot more UV on the ocean. This is a world away from current scenarios.
Best regards, suricat.
I’m late to this thread and I’m hoping someone can help.
Wonderful paper Ms. Lisiecki, a necessary gem for the climate debate, and thank you Mr. Watts for this post.
My question: I gather that perihelion, the orbital/axial position that begins an interglacial occurred a while ago, does anyone know when?, and, when will its opposite, the axihelion occur?
Correction to above question:
when will its opposite, the aphelion occur?
Yes, the principles of eccentricity, progression etc, are well known even to cartographic surveyors like me. What is really good about this post is that at last somebody is doing real science, providing good data, and telling us about it. For far too long we have had vested interests, bullying us with CO2, which is politics not science. Petrol prices in England today have reached £1.20 per LITRE.
Probably 80% of which is tax, the real “reason d’etre” of Climate Science.
“”” suricat (06:13:23) :
George E. Smith (17:51:35) :
“”Actually suricat, TSI during a solar cycle only varies by 0.1%, not 1% as you state””
I just knew that someone would pick up on this, I was being generous. I find that TSI is a confusing term that originates from astronomers being able to relate to a star’s magnitude in the vis spectrum. We seem to confound this when discussing Sol.
For example, how can TSI only vary by 0.1% when sunspots are observed to cause <-0.3% reduction in TSI? Can they only be measuring the vis spectrum where the extra brightness is made up by faculae, or do they measure the entire EM spectrum? """
Well Suricat, the 0.1% figure I cited is well supported. We have had a series of satellites, that have observed and measured TSI over about three complete (11year) sunspot cycles, so 1 1/2 full 22 year magnetic cycles. These plots are widely available; perhaps Leif Svalgaard, can point you to the definitive web location. They clearly show a mean TSI of about 1366 W/m^2, with a P-P amplitude of about 1.3-.4 . Unfortunately, the several satellites that gathered this data, slightly disagree on absolute value; but the cyclic variation is well matched.
Now of course those curves show short term fluctuations that exceed these values; I don't call them "noise", because the really are signal; but a "noisy" signal. And very possibly those spikes do support the 0.3% spike due to a sunspot that you mention; these however are very short term transient events.
And yes; these satellite sensors do include a rather wide spectral range; although not the complete EM spectrum, which must cover at least 24 octaves of frequency range; from down to, but not including DC; out to beyond cosmetic rays.
However standard black body radiation theory shows that the vast majority of the energy is contained in a relatively small range. For rough numbers 98% of the BB spectrum lies between 0.5 times the peak wavelenght to 8 times the peak wavelenght with 1% beyond each end. That for the sun is 250 nm to 4.0 microns.
The actual spectral radiant incidence is down to 10^-5 of the peak value, at 0.2, and 40 times the peak, or 100nm to 20.0 microns for the solar spectrum.
As to this statement:P- """ Ocean surface insolation of UV is the greatest variable and it also penetrates to greatest depth. """
I can support the first assertion. The greatest deviation of the extra-atmospheric solar spectrum (so far as I know) from a perfect black body spectrum occurs in the UV where the sun is anomalously brighter than the roughly 6000 K temperature. My guess is that could be from the much hotter outer reaches of the sun (sorry Leif, my mind simply won't return the correct term).
The ground level solar spectrum is also known to be highly variable in the UV region. This can be ascribed to Ozone variability. Long before there were ozone holes (by name), it was widely known that the sun had a seasonally variable apparent color temperature; which also changed randomly over time. I have argued from time to time; that this phenomenon; known certainly back in the 1940s or earlier; was solid evidence that ozone holes had always been with us; long before there were CFCs. So no argument to your first point;
But the second part, is quite wrong.
Sea water (clean deep ocean) has its lowest spectral absorption coefficient of 0.0001 cm^-1 at a wavelength of 460 nm in the blue region of the spectrum. It is already ten times that value at the 380 nm boundary between visible and UV , and is about 0.015-0.02 at 300 nm, increasing to 0.1cm^-1 at 200 nm, where it shoots up to about 30 cm^-1 by about 180 nm. Now this is vaccuum UV, so there is virtually none of that reaches the ocean surface anyway.
In contrast, in the IR end of the spectrum, water absorptance reaches 30 cm^-1 at the 1.5 and 2.0 micron water absorption band peaks. At 3.0 microns, Water has its maximum spectral absorptance of about 9000 cm^-1, which places the 1/e depth at 1.1 microns depth. Beyond 3.0 microns, water averages about 1000 cm^-1 which makes the 1/e depth for lLWIR at 10 microns; well at least out to 10.0 microns; and the curve I have shows no sign of letting up at that point.
I hate it that I cannot cut and paste graphs and plots from text books; because it takes 1000 words to describe one picture.
“”” Steve Goddard (05:03:04) :
George E. Smith (17:55:43) :
I thought it over some more and you are correct
The feedback formula is something like F + F^2 + F^3 + F ^4 + …… F^N which does converge on a finite number for any value of F less than 1 “””
No biggie Steve; I figured you would see it yourself; if somebody just pointed that out
But we are on the same page; no way this thing can get into a runaway Venus condition; just isn’t possible; no matter what; as Bill Shockley would put it.
“”” George E. Smith (13:06:28) : Your comment is awaiting moderation
“”” Steve Goddard (05:03:04) :
George E. Smith (17:55:43) :
I thought it over some more and you are correct “””
Steve, I’m an old Circuits guy, so I tend to think of “feedback” in circuit terms.
In that methodology, a POSITIVE feedback would be any “signal” that is some fraction of the OUTPUT, that is ADDED to the original INPUT signal, so as to INCREASE the apparent input seen by the AMPLIFIER (or forward gain function). That would then make the output larger (but not necessarily unstable).
On the other hand a NEGATIVE feedback sould be any “signal” that is some fraction of the OUTPUT, that is SUBTRACTED from the original input signal, so as to DECREASE the apparent input seen by the AMPLIFIER. That would then make the output smaller.
Maybe we can draw this somehow:-
Original input signal is (i), Amplifier gain (low frequency) is (A), and output signal is (o).
Sans feedback we simply have: o = i.A so if ( A) is highly variable, then so is (o) even for a fixed (i).
So now we invoke a feedback with a factor (b) of the output being fed back to the input. Let’s do negative FB first.
Output = 0 = i.A, feedback signal = o.b = i.A.b; net input to amp is i-o.b
Then we must have: o = A.(i-o.b) Collecting up terms we get:
o(1+b.A) = i.A giving : o =i. A/(1+b.A)
If we make (A) extremely large and b.A >>1, then we have approximately:
o = i/b So now we have an output that is virtually independent of (A) and depends only on the feedback factor (b), and of course the original signal (i).
For example if we make (b) = 0.01, and A = 1E6
Then o =i. 1000,000/(1+0.01*1000,000) = i.1000,000/10,001 = i.99.99(00009999). 1/b of course is 100.
So now let us drop A from a million down to only 10,000, for my stone dead vaccuum tubes.
Then 0 = i. 10,000/(1+0.01*10000) = i.10,000/101 = i.99.0099….
So my dead amplifier whose gain dropped by a factor of 100, only changed my output by 1% from 99.99 down to 99.01. Negative feedback is magic.
Now of course we don’t get any forward gains of a million in the climate system; but it’s very simple with operational amplifiers. So climate feedbacks aren’t nearly so dramatic.
But back now to positive feedback case; well we simply reverse the sign of the fed back signal.
So now effective input signal goes from i to i+o.b
And we have o(1-b.A) = i.A giving o = i.A/(1-b.A) And we can see that the output will go towards infinity, as b.A approaches 1. With the above op-amp numbers we had b.A at 10,000 and 100, and both would go totally ape.
So in the case of POSITIVE feedback we must have b.A 1, then as you point out the output will grow without limit.
Now the very real problem in feedback, is that the above analyses, assume instantaneous feedback from output to input. In op-amp circuits, that could be nanoseconds to milliseconds. So if the input signal is varying, the varying output signal will be delayed from that, and by the time the feedback signal arrives back at the input to get dummed or differenced with the real input, that time lag, can turn what was supposed to be negative feedback, into positive feedback > 1, and you have an oscillator.
That is the constant bgaboo of feedback circuit designers; and ther are rigid conditions for stability.
When was the last time you ever heard some climate scientist Steve, talk about the time or frequency response of his feedback model of the climate.
Although climate “amplifier” systems do not have gains of hundreds or millions, there is nothing in the above feedback equations that says (A) has to be very much larger than 1. If b.A is greater than 1 so we have constant growth with +ve feedback, then even if A were <1), A/(1-b.A) will still grow without limit.
So the runaway condition for the climate is the same as for the op-amp; no matter how low the forward gain (A) actually is in whatever climate system we are modelling, when we have positive feedback. And if the output (CO2 increase) is delayed from the input (surface temperature increase); how's about 800 years, then we can expect an oscillation to occur in some circumstances.
But nobody in "climatology" seems to be concerned about the frequency response of their climate feedbacks. Well not so I have noticed.
George
George E. Smith (13:01:02) :
Thanks for the response George, you’re right! The graph I’m looking at is crap. Blue vis spectrum should have greatest ocean depth penetration, with some UVa.
I googled for a better graph and came up with this:
http://books.google.com/books?id=C5kRs1z_CYoC&pg=PA56&lpg=PA56&dq=UV+absorption+of+water+vapour&source=bl&ots=bLYkuKb6z8&sig=ShuCKHswM8g8Axo3FbNG27gSi7w&hl=en&ei=7KqASrLnO8SMjAem5IH2CQ&sa=X&oi=book_result&ct=result&resnum=9#v=onepage&q&f=false
Page 63, figure 2.13., but it isn’t oceanic water. I think I’ll keep this for a favourites page though, it looks like a good reference. 🙂
“”I can support the first assertion. The greatest deviation of the extra-atmospheric solar spectrum (so far as I know) from a perfect black body spectrum occurs in the UV where the sun is anomalously brighter than the roughly 6000 K temperature. My guess is that could be from the much hotter outer reaches of the sun (sorry Leif, my mind simply won’t return the correct term).””
No need to ask Leif, the source of this is actually the dark sunspot itself. This is what confounds me when claims are made that dark sunspots reduce the TSI level. They’re so ‘hot’ that you can’t see them and I would have thought actually added to the TSI level, not reduced it.
FWIW, I think the ozone hole has been there longer than we’d care to think as well.
Best regards, suricat.
Phil Brisley (07:05:53)
Perihelion was on January 3 this year (2010). So that should make aphelion around July 3.
Lorraine Lisiecki (19:31:31)
How does your reconstruction of 1M year global temperatures from sediments, correlate with ice cores such as Vostok? If it is a good correlation, this is pretty impressive validation of both reconstructions.
How did she date the cores? The problem with this type of research in the past has been circular reasoning. Researchers “dated” the sediment cycles by correlating them with the solar cycles. They then turned around and pronounced that there was a cause-and-effect relationship between the two. So far as I’m aware, the Devil’s Hole data still falsify Milankovitch, or at least present a big problem for conventional Milankovitch theory.
Brrr… time to get out the extra extra thick mukluks and touques it looks like.
It would be interesting to find out if the cyclical change(s) from, specifically, interglacial to glacial is preceded by intense warming just before it drops to intense cooling…
That could very well explain a lot…
******
8 04 2010
Phil Brisley (09:23:50) :
Correction to above question:
when will its opposite, the aphelion occur?
******
Answer — pretty much right now. The earth is farthest from the sun around early July & closest early January. So we’re in the period when, usually, interglacials end (being more of a N hemisphere event). Whether that will happen, nobody can say. The interglacial period at ~400k yrs ago was unusually long & lasted over several 10k yr cycles before returning to glacial conditions.
She may do the correlation herself (or describe her sampling methods) somewhere. I didn’t see it either in her “Plio-Pleistocene Climate Evolution…” paper (linked above somewhere).
Just eyeballing the Wiki reproduction of Vostok and EPICA…
http://en.wikipedia.org/wiki/File:Ice_Age_Temperature.png
Dr. Lisiecki’s sediment cores suggest an approximate match for the frequency and timing of the last 6 interglacials (all that are covered in the last half-million-year Wiki graph). The sawtooth configuration of interglacials, with sudden warm-ups and gradual cool-offs, are also similar. Temps seemed to peak, in all three studies, at about the same time:
400,000 years ago
330,000
240,000
210,000
125,000
Hope she comments.
phlogiston (16:29:28):
beng (07:26:16):
Thanks for the replies, my question was poorly phrased.
I resubmit: When did the orbital/axial event that begins an interglacial, with NH summer solstice at perihelion and the axial tilt maxed out at 24.5 degrees with the orbit in maximum eccentricity occur?, and conversley, when will the opposite orbital/axial event (that is, the NH summer solstice at aphelion with the axial tilt at its minimum and the orbit in minimum eccentricity) occur?
“”” suricat (14:36:16) :
George E. Smith (13:01:02) :
Thanks for the response George, you’re right! The graph I’m looking at is crap. Blue vis spectrum should have greatest ocean depth penetration, with some UVa.
I googled for a better graph and came up with this:
http://books.google.com/books?id=C5kRs1z_CYoC&pg=PA56&lpg=PA56&dq=UV+absorption+of+water+vapour&source=bl&ots=bLYkuKb6z8&sig=ShuCKHswM8g8Axo3FbNG27gSi7w&hl=en&ei=7KqASrLnO8SMjAem5IH2CQ&sa=X&oi=book_result&ct=result&resnum=9#v=onepage&q&f=false
Page 63, figure 2.13., but it isn’t oceanic water. I think I’ll keep this for a favourites page though, it looks like a good reference. 🙂
“”I can support the first assertion. The greatest deviation of the extra-atmospheric solar spectrum (so far as I know) from a perfect black body spectrum occurs in the UV where the sun is anomalously brighter than the roughly 6000 K temperature. My guess is that could be from the much hotter outer reaches of the sun (sorry Leif, my mind simply won’t return the correct term).””
No need to ask Leif, the source of this is actually the dark sunspot itself. This is what confounds me when claims are made that dark sunspots reduce the TSI level. They’re so ‘hot’ that you can’t see them and I would have thought actually added to the TSI level, not reduced it. “””
Suricat, the word I was struggling to find was “Corona”, so I was talking about the outer parts of the solar atmosphere where I understand temperatures can be in the million K range.
But then maybe I am wrong in assuming that region is actually responsible for the higher that 6k K BB UV amount.
As to the sun spot itself; it had always been my ‘understanding’ that sunspots were colder than the rest of the surface; which is why they look black against the background; and I think that is generally true; but Leif already explained to us, that the rim of the spot, is actually hotter than the background (and the interior of the spot) so that the NET effect of the whole spot, is in fact a HIGHER than background radiance, hence a TSI increase.
Maybe those spot perimeters could be a source of anomalous UV; but I’m thinking that the frequency of spots, and their size relative to the sun, might not be enough to explain the UV surplus anomaly.
Maybe Leif can kick in and tell us what really is the soure of that extra UV.
But I don’t disagree that the whole spot is a net TSI increase (I learn fast).
George E. Smith (12:28:49) :
“”Maybe Leif can kick in and tell us what really is the soure of that extra UV.””
Unlikely, as we’re getting a bit OT here. To pull it back a bit:
It’s really the antithesis of sunspots for this thread, solar minimum. That’s when cosmic rays generate Be10 more easily. I was trying to suggest reasons why the hydrological cycle would relax during solar minima. This, in turn, would also suggest that snowfall following a minimum would be lower and the depth of Be10 to show only a narrow band in ice cores, etc..
I was also ‘toying’ with the concept that sunspots may be the end result of solar tidal forces generated by planetary orbital transitions. If so, we would have an ‘astrological’ (on a solar system scale) timetable for the exact dates of Be10 deposition, as we could ‘calculate’ the length of solar cycles and the points of solar minima. Wouldn’t this be easier, nay, make it possible?
However, I’ve already suggested that Sol’s subject is not my discipline, but if you wish to continue with this I think we should take sunspots ‘elsewhere’. That is, unless it is to determine a method for the calculation of solar minima. What would you suggest?
Best regards, suricat.
********
9 04 2010
Phil Brisley (12:28:29) :
phlogiston (16:29:28):
beng (07:26:16):
Thanks for the replies, my question was poorly phrased.
I resubmit: When did the orbital/axial event that begins an interglacial, with NH summer solstice at perihelion and the axial tilt maxed out at 24.5 degrees with the orbit in maximum eccentricity occur?, and conversley, when will the opposite orbital/axial event (that is, the NH summer solstice at aphelion with the axial tilt at its minimum and the orbit in minimum eccentricity) occur?
*******
I’m going by memory here, so it might be best to look things up.
Look above at the top figure for the major cycle-periods.
The tilt varies from ~23 – ~24.5 deg. This is obliquity. Right now about we’re about mid-way. At 41k yrs cycle, this doesn’t seem to much influence g/i (glacial/interglacials) now, tho before 400k yrs ago it did seem to. In general, greater tilts seem to promote summer warmth — lesser tilt, cooler summers. But at the present it doesn’t seem to correlate much with the g/i events.
The time-of-yr when perihelion/aphelion (from eccentricity) occurs is called precession, w/a cycle of 22k yrs. This seems to determine the length of interglacials — they start when closest approach to sun is in N hemisphere summer, and end when NH is farthest in summer (like now) — typically about a half-cycle (11k yrs). But the interglacial at ~400k yrs ago went thru 1.5 cycles (~33k yrs) before returning to glacial.
Eccentricity is the amount of divergence of the orbit from purely circular producing the variable perihelion/aphelion distances w/a cycle of ~110k yrs. Currently this seems to dictate the overall timing of interglacial events — the “peaks” of relative high eccentricity seem to initiate these. Look at eccentricity in the top figure & the timing of the interglacials to see this correlation.
So right now we’re sitting at a point in time where the interglacials typically ended! Scary, eh? But a couple papers suggest the most similar combination of orbital characteristics compared to now occurred during the ~400k yr ago interglacial, and that the current interglacial could continue for another 22k yrs. Who knows?
Bill Parsons (09:17:48)
beng (10:27:16)
Thanks for the helpful info.
Bill Parsons (09:17:48)
beng (10:27:16)
Concerning what happens next – L. Lisiecki predicted generally a “gradual cooling over the next 90k years”. This seems a good way to hedge one’s bets. The records – e.g. Vostok – show a jagged descent but which usually starts with a quite sharp drop to a kind of “half glacial” level, followed by more fluctuation with a downward trend and eventually the full glacial chill. (But even in the middle of a full-on glacial period you can have sharp up-spikes to almost interglacial climate lasting as short as 30 years.) So I guess the drop might start with a sustained cooling (a downspike on the scale of several 100 k years can still take a century or two), but in general climate will be more variable during a cooling / glacial period than the short interglacial. Our current interglacial seems unusual in having a mini-plateau (the holocene) – others are topped by sharper spikes.
beng (10:27:16)
Thanks!…..great info, I’ve enjoyed this thread more than most.