By Steven Goddard
Last month we discussed how NASA continues to spread worries about the Antarctic warming and melting.
A January 12, 2010 Earth Observatory article warns that Antarctica
“has been losing more than a hundred cubic kilometers (24 cubic miles) of ice each year since 2002” and that “if all of this ice melted, it would raise global sea level by about 60 meter (197 feet).“
[Note that is continental ice, not sea ice, – Anthony]

NASA’s 1982-2007 map showing Antarctica warming

But NSIDC seems to be thinking differently in their March 3, 2010 newsletter. They say Antarctica is cooling and sea ice is increasing (makes sense – ice is associated with cold.)
Sea ice extent in the Antarctic has been unusually high in recent years, both in summer and winter. Overall, the Antarctic is showing small positive trends in total extent. For example, the trend in February extent is now +3.1% per decade. However, the Amundsen and Bellingshausen Seas show a strong negative trend in extent. These overall positive trends may seem counterintuitive in light of what is happening in the Arctic. Our Frequently Asked Questions section briefly explains the general differences between the two polar environments. A recent report (Turner, et. al., 2009) suggests that the ozone hole has resulted in changes in atmospheric circulation leading to cooling and increasing sea ice extents over much of the Antarctic region.
The NSIDC graph below shows the upwards trend in Antarctic Sea Ice. Some recent years have shown anomalies as high as +30%.

http://nsidc.org/data/seaice_index/images/s_plot_hires.png
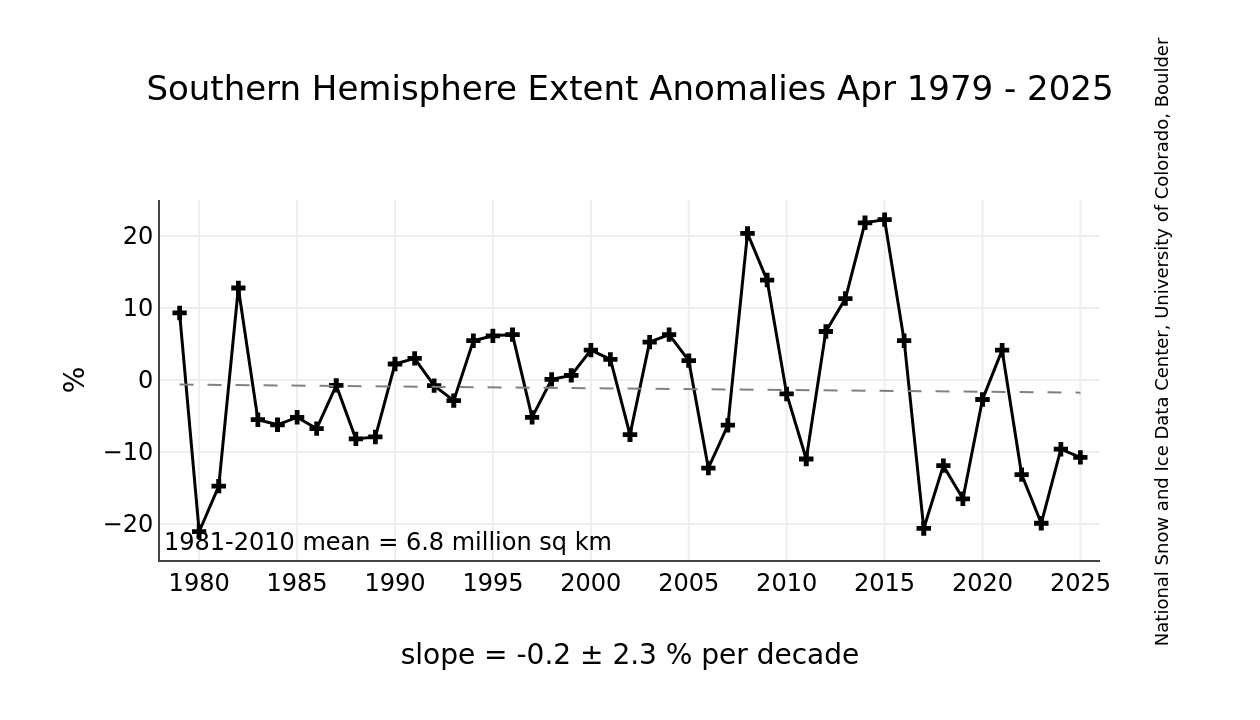
UAH satellite data also shows Antarctica cooling, as seen in their map below. (This map is dated November, 2006 – if anyone knows where to get a more recent version, please let me know.)


UAH 25 Year Temperature Trends
Perhaps NASA should have stuck with their original 2004 map below, showing Antarctica’s interior cooling?

NASA’s 1982-2004 map showing Antarctica cooling

While there’s no dispute that there’s some sea ice loss in the Antarctic peninsula, all signs seem to point in the opposite direction of what some what have you believe about Antarctica as a continent.
Sponsored IT training links:
We offer self paced 312-50 training with up to date 642-611 dumps and 70-450 practice test to provide guaranteed success in first dive.
vukcevic (15:00:23) :
Leif Svalgaard (13:56:23) : “So, any [negligible] effect today would be even less than in 1650.”
You got that wrong way around (effect in 1650 would be, if linear 17% greater than today
Typical of your logic that you think that 17% less today is different
from 17% greater in 1650
Thanks for the link: maths is mind boggling, and as Tesla said tendency of scientists to substitute maths for science.
Nonsense, science today is mathematical, and the math is elementary.
I suggest this is due to counter MF created by electric currents generated by gyre’s circulation in the strong Earth’s MF of the area.
And I tell you that calculations show that the effect is minuscule.
There is a proven correlation
A proven correlation is one that is backed up by matching calculation of the effect, and this is not the case.
Stephen Wilde (15:09:18) :
However I think you are as adrift as anyone else when it comes to recognising the variety of interactions in the Earth’s processing of that solar energy.
Solar work involves being an expert in radiative effects.
Correct me if I’m wrong but I think you see the Earth system as a black body radiating out to space at the appropriate rate for a body at some so called global temperature.
What nonsense is that? Black body or grey body makes no difference. And it is well-known that because of the greenhouse effect, the Earth’s surface temperature is several tens of degrees higher than the black body temperature. What is a fact, is that the radiated energy from the Earth equals that coming in from the Sun.
It’s not just a matter of radiative physics straight in and straight out. There are the matters of convection and conduction and the irregular block transfers of energy upwards and downwards by the phase changes of water and the albedo variability introduced by changes in cloudiness and snow/ice cover.
I spent the first five years at the University in Copenhagen studying Geophysics and Atmospheric physics and worked four years at the the Danish Meteorological Institute, so I do know something about all that. [This is my real field – the solar bit came later]
As you must accept, the thermosphere can warm or cool whilst other layers change in the opposite direction.
The thermosphere is so thin and the total energy up there so minuscule that it is totally irrelevant what happens there [as we have discussed so many times].
I wouldn’t even entirely exclude the ideas of vukcevic
That is because you [and he] do not understand the physics
and those who support length of day and gravitational effects because they could influence the oceanic variability that the observational evidence strongly supports.
the cause and effect go the other way [ice skater lowering and raising her arms].
It really doesn’t seem right for you to be so dismissive of thoughts and ideas that relate to internal Earth system variability on the basis of your undoubted solar expertise.
My solar expertise is a sideshow as i have explained.
I think that is why we have not been able to have a full meeting of minds.
If you cannot understand the facts, then meeting of minds is hard.
Leif @ur momisugly 15:48:59
“What is a fact is the radiated energy from the earth equals that coming in from the sun”. Well, minus the energy sequestered underground in hydrocarbons and carbonates, plus the energy conducted from the interior of the earth. I know, picky, picky.
==========
Steve Goddard (22:06:34) :
This article is about sea ice, but it should be apparent that it would be impossible for a region of sea ice to be growing and nearby continental ice to be melting.
—————-
The latest data reveal that Antarctica is losing ice at an accelerating rate, too. How is it possible for surface melting to decrease, but for the continent to lose mass anyway? The answer boils down to the fact that ice can flow without melting.
http://earthobservatory.nasa.gov/Newsroom/view.php?id=42399
What do they call an Antarctic glacier once it flows into the ocean ?
Sea ice ?
The oceans surrounding Antarctica have been warming, so Schodlok doesn’t doubt that the ice shelves are being undermined by warmer water being brought up from the depths. But he admits that it hasn’t been proven rigorously, because satellites can’t measure underneath the ice.
Wouldn’t melting ice shelves, flowing continental glaciers, increased sea ice, and Antarctica losing ice at an increasing rate (GRACE satellite data), with surface temperatures seen by satellite being basically constant (with a small noise signal superimposed) all be consistent ?
Could 100 cubic kilometers of ice flowing off of Antarctica into the surrounding oceans every year be consistent with less sea ice ?
I wonder if the earth varies its rate of sequestration of that energy in response to some rhythm of the sun. That might magnify but not lead to a runaway.
=============
I know it’s not THIS simple, but could somebody help me wrap me head around this.
Disconnect the atmosphere from the Antarctic ice cap for a minute.
The atmosphere is 5 x 10^21 grams of air, with specific heat of around 1 Joule per gram degree K, and a projected temperature rise over some time of 5 degrees Kelvin, so the total energy in question is about 3 x 10^22 Joule.
The ice cap is 15 x 10^6 square kilometers in area, 2 km in depth, with a specific density of 1. We’re looking at 3 x 10^21 grams of ice. The specific heat of solid ice, below freezing is about 2 Joule /gK, and the ice at the pole is about – 50 degree K below freezing. The heat of fusion of ice is about 333 J / gram. Adding the heat necessary to raise the ice to “merely” zero, and adding the heat of fusion, we need about 1.3 x 10^24 Joules to melt the icecap.
That is, all the heat in all the world, by air temperature, is about 2 percent what it takes to raise sea level by whatever Al Gore is telling us.
This is a pretty big difference.
Why does the atmosphere heat up, at all? Why don’t we see long centuries where the heat all goes toward raising the temperature of that giant icecap from fifty below freezing to a toast warm ten below freezing?
Anu,
Ice flowing outward into the ocean is a sign of an expanding glacier. A retreating glacier moves away from the ocean. Icebergs form when an expanding glacier breaks off a chunk into the ocean.
The GRACE data is probably meaningless wrt to ice mass. The small changes they are seeing are likely due to isostasy or plate tectonics. The only bedrock reference points they have are around the margins – i.e. they have no reference points across most of the continents. It is in fact remarkable that they would make claims of ice mass to such fine precision without an adequate set of control data.
It would help clarity if all these articles by NSIDC (which is suppported/funded by NOAA, NASA, NSF), would include a simple matrix (excel format)summarizing findings. In a 5 sec look you could get the essense, instead of slogging through weasely summary verbiage. Verbiage in scientific communications is not the optimum way to show info.
Clarity in science maybe should be second only to integrity?
John
kim (16:08:32) :
I know, picky, picky.
And you can be more picky, and include friction caused by lunar tides, energy released in nuclear power plants. hot air blowing from Al Gore’s mouth, etc. A hallmark of a scientist is to concentrate on what is relevant.
I wonder if the earth varies its rate of sequestration of that energy in response to some rhythm of the sun.
It does depend on the erosion rate which in turn depends on the luminosity of the Sun. As the Sun heats up over the next several billion years, erosion will increase and sequestration will remove almost all CO2 from the atmosphere leading to extinction of plant life [and thus all higher life]. The first 4 billion years only microbes could live on Earth, and in 0.5 billion years time, again only microbes can live on Earth. Higher life is only possible during that window of 1 billion years in which we are halfway through.
POUNCER (16:21:50) :
Why does the atmosphere heat up, at all? Why don’t we see long centuries where the heat all goes toward raising the temperature of that giant icecap from fifty below freezing to a toast warm ten below freezing
Because that icecap reflects most of sunlight [96% in visible and 68% in infrared] falling on it which isn’t much anyway because of low angle of incidence.
kim (16:08:32) :
I know, picky, picky.
And you can be more picky, and include friction caused by lunar tides, energy released in nuclear power plants, hot air blowing from Al Gore’s mouth, etc. A hallmark of a scientist is to concentrate on what is relevant.
I wonder if the earth varies its rate of sequestration of that energy in response to some rhythm of the sun.
It does depend on the erosion rate which in turn depends on the luminosity of the Sun. As the Sun heats up over the next several billion years, erosion will increase and sequestration will remove almost all CO2 from the atmosphere leading to extinction of plant life [and thus all higher life]. The first 4 billion years only microbes could live on Earth, and in 0.5 billion years time, again only microbes can live on Earth. Higher life is only possible during that window of 1 billion years in which we are halfway through.
POUNCER (16:21:50) :
Why does the atmosphere heat up, at all? Why don’t we see long centuries where the heat all goes toward raising the temperature of that giant icecap from fifty below freezing to a toast warm ten below freezing
Because that icecap reflects most of sunlight [96% in visible and 68% in infrared] falling on it which isn’t much anyway because of low angle of incidence.
R. Gates (10:37:07),
The canard that global ice extent is falling has been repeatedly debunked. Here is another chart from the same source: click. If you can’t see that global ice extent is what matters when discussing global warming – well, everyone else can.
From the IPCC’s AR-4, Sea Ice Extent, Southern Hemisphere: click. As everyone else can see, this chart shows a rising trend in Southern Hemisphere ice extent: click
From NSIDC – referenced in this very article – Southern Hemisphere ice anomalies [+3.1% per decade increase in ice extent over the last thirty years] : click. As we know, charts are often altered, as this sea ice extent blink gif shows: click
To repeat: global ice cover is what matters when discussing global warming. And global ice cover is not declining: click. That’s a NASA anomaly chart, which debunks the claim that the planet is losing ice. Cognitive dissonance won’t allow you to accept that obvious fact. But everyone else can see it.
OT – but heavy snow and blizzards on the Mediterranean coast:
http://news.bbc.co.uk/2/hi/europe/8557570.stm
Leif Svalgaard (13:56:23) : “So, any [negligible] effect today would be even less than in 1650.”
vukcevic (15:00:23) :
You got that wrong way around (effect in 1650 would be, if linear 17% greater than today
Leif Svalgaard (15:48:59) : Typical of your logic that you think that 17% less today is different from 17% greater in 1650
Sorry, gentlemen, but I think you’re both wrong. Leif, there is a difference between the two, but vukcevik still stated it wrong.
Assuming a linear response, and values of 68.5 in 1650 versus 57.1 today, we could say that the effect today is about 17% less than it was in 1650 (actually about 16.64% less), but that is not at all the same thing as saying that the effect in 1650 was 17% greater than today’s effect. To be accurate, you would have to say that the effect in 1650 was 19.96% greater than today.
To get only “17% greater than today” back in 1650, the value would have to have been about 66.81 instead.
It’s as maddening for me to see things like this as it is for people to talk about the price of something being “reduced 150%”. Just once I’d like to get someone to live up to that advertisement, and actually pay me 50% of what the previous sales price was for the favor of taking something off their hands.
” I can’t believe I’m among the first to comment!
Cooling Antarctica? Warming Arctic? So what? Perhaps we should just take the “Global” out of “Climate Change” and “Warming”, then we could all agree that climate does change, and warming can occur, but at different times and rates in different places. Climate is regional.
A good slogan might be- Climate Change- not new, not much, and not scary!”
Well-said!
This is, if I do not misread him, one of the themes of Roger Pielke, Sr. , who, along with Bill Gray, should be considered by President Romney for a Presidential medal, in honor of their fearless and lonely fight for the integrity of climate science.
Who says I’m always living in the past?
We are constantly exhorted not to take ‘weather’ for ‘cimate.’ But weather is what actually happens in a given place and a given time; it is the primary, phenomenal reality, and is what affects human life. Climate is a secondary, statistically abstracted reality.
Globally, January 2010 was the warmest in the 30-year satellite record. Yet the most populated and prosperous regions of the Northern Hemisphere from China through Western Europe, where at least one-third of the human population of the planet live, had the bitterest winter, all things considered, in thirty years. It was weather that disrupted daily human life in these areas, not the artefact (however useful) of a ‘global’ heat wave.
Weather is Hurricane Katrina, or an F-4 tornado flattening a town, or a lovely late April afternoon with the lilacs in bloom. Why should we have only to account for destructive events?
An increase or decrease in the number and /or intensity of landfalling hurricanes or of tornados, or of the frequency of rare days in June would be climate.
It seems to me that one general truth in play in all this AGW brouhaha is that atmospheric scientists should, at this stage of knowledge at least, beware of Grand Narratives. Isaac Newton apparently had an ego as broad as the heavens, but toward the end of his life, he said something to the effect that he felt like a child throwing pebbles into the limitless ocean and watching the ripples.
What a man! Mathematician, physicist, crackpot, alchemist, crackpot Biblical hermeneutician, proto-Whig and political actor in the crisis of 1688, director of the mint–and he felt but a child!
Barry Kearns (17:10:28) :
It’s as maddening for me etc
You are, of course, correct, but when the change is small enough [e.g. less than 20%] it does not make any difference to the argument as Nature is messy enough for this not to matter within the uncertainty of the physics. Now, when it comes to money, that is a different matter 🙂
http://vortex.plymouth.edu/mollsat_ir_an.gif
Try this IR view of the globe I look at frequently, it is continually updated with the last 36 hours in 3 hour steps. But look at the storms skirting Antarctica and how most go right over the peninsula. No wonder it is much warmer.
Look at this every few days for a month or so and you may end with a different view of storms and clouds on a planet scale. The storms circulating Antarctica were basically constant over the last 4 months though about 5 degrees closer to the equator. Except for the horizontal daily stepping of the storms, every day looks basically the same as the day before, at least it has for the last four months.
wayne (17:22:34)
But look at the storms skirting Antarctica and how most go right over the peninsula. No wonder it is much warmer.
I think it is an artifact of the processing or imaging that the polar regions have no clouds.
western antarctica gaining ice as well
A doubling in snow accumulation in the western Antarctic Peninsula since 1850
http://www.agu.org/pubs/crossref/2008/2007GL032529.shtml
“The Gomez record reveals a doubling of accumulation since the 1850s, from a decadal average of 0.49 mweq y−1 in 1855–1864 to 1.10 mweq y−1 in 1997–2006, with acceleration in recent decades.”
No paywalled paper with correlations to atmospheric oscillations. Sweet.
http://www.scielo.cl/scielo.php?pid=S0717-65382004000300054&script=sci_arttext
Steve Goddard (16:28:56) :
Anu,
Ice flowing outward into the ocean is a sign of an expanding glacier. A retreating glacier moves away from the ocean. Icebergs form when an expanding glacier breaks off a chunk into the ocean.
———-
It seems that glaciers speed up and thin out on the way to dumping their ice into the ocean, after the ice shelf damming them breaks.
They’ve seen this with the dramatic Larsen B ice shelf breakup in 2002:
http://nsidc.org/news/press/20040921_acceleration.html
In the wake of the Larsen B Ice Shelf disintegration in 2002, glaciers in the Antarctic Peninsula have both accelerated and thinned en route to the Weddell Sea. The findings indicate that ice shelf breakup may rapidly lead to sea level rise.
http://nasadaacs.eos.nasa.gov/articles/2007/2007_larsen.html
“In both Greenland and Antarctica we’re seeing over and over again that when an ice shelf disintegrates, glaciers behind it accelerate abruptly, and begin to draw down significant volumes of ice and put it into the ocean.” The Larsen B shelf was about the size of Connecticut, but Antarctica’s largest ice shelves, the Ross and Ronne, are each nearly the size of Spain. If the Ross shelf collapsed, for example, the resulting flow of glacial ice could eventually raise global sea level by up to five meters (sixteen feet).
Accelerating glacier ice is an unwelcome ingredient in the recipe for global sea-level rise, making it important for scientists to understand the factors behind ice shelf breakup. As long as the massive Antarctic ice sheets remain locked away behind ice shelves, doled out in an occasional iceberg, sea level may remain stable. But if warming and melting trends persist, more ice shelves may begin to show the same signs of weakness observed in the Larsen B ice shelf before it disintegrated. “This problem of sea-level rise is a real one,” says Scambos. “It’s likely to happen, and the steps could proceed more rapidly than we thought.”
mamapajamas (13:01:17) :
@Wren (23:06:35) :
“NASA says
“The answer boils down to the fact that ice can flow without melting.” ”
Wren, you’re faith in what “NASA says” is astounding. At this point in time, if NASA said the sky was blue, I’d go out side and look.
=================
I have known for a long time ice can flow without melting, but I didn’t learn that from NASA.
I’m not an anti-government idelogue
Leif Svalgaard (17:35:19) :
I see what you mean. Of course that is a very course view and seems to ignore all but the strongest signals. Poles might not even be covered at all. I simply use it as an instant overview every day or two to see what might be heading my way.
In the meantime blizzards have hit the Mediterranean coast on the 9th of March. Blizzards on the 9th of March? The video is pretty impressive
http://news.bbc.co.uk/2/hi/europe/8557570.stm
POUNCER, Gail Combs, DocWat, MJ Penny, Alan the Brit,
You are all on the right track. Before I read the comments I did the math on my own take:
The (Not So) Melting Antarctic
The Current Antarctic “Melting”:
Surface area of the Earth (sq miles)
196,861,796.38
Ocean surface area of the Earth @ur momisugly ~ 70% (sq miles)
137,803,257.47
Antarctic Ice Melt / Year (cu miles)
24.00
Ocean rise / yr from Antarctic Ice Melt (ft)
0.000920
Ocean rise / yr from Antarctic Ice Melt (inches)
0.011035
Ocean rise / yr from Antarctic Ice Melt (mm)
0.275872
Number of years to raise ocean level by 1 inch
90.62
Number of years to raise ocean level by 1 foot
1,087.46
Number of years to raise ocean level by 1 meter
3,624.88
What It Would Take To Achieve Actual Antarctic Melting?
Average Annual Temperature of the Antarctic (degF)
-58
Freezing Point (degF)
32
Degrees of warming required to move Antarctic Average Annual Temp above Freezing (degF)
90
Likelihood of Antarctic Average Temp rising to allow meaningful Antarctic melting before the Holocene ends (pct)
What are the summertime average high temperatures in Iraq? (degF)
110
Assuming distributed global temperature rise, what would be the summertime average high temperatures in Iraq have to be if the Antarctic shifted into actual average melting? (degF)
200
Inevitable resultant editorial comment: Who on earth is dumb enough to believe any of this innumerate warming drivel?
And all the usual disclaimers about the Antarctic being a bowl full of ice and so not going anywhere no matter what until plate tectonics do their damage, we don’t know the role of undersea volcanoes in the area, etc., etc.
Love this re the Antarctic: “These overall positive trends may seem counterintuitive in light of what is happening in the Arctic.”
Why not for the Arctic: “These overall negative trends may seem counterintuitive in light of what is happening in the Antarctic”
I really think Anthony needs to stop publishing stuff by Goddard. There are, once again, a lot of fairly reasonable points being made by AGW alarmists about this latest piece, and his stuff is generally ridiculed not long after it’s posted.
I don’t buy AGW, but when I read critiques of Goddard I usually find they’re right.
Posting failed attempts at disproving AGW, and inviting mockery, doesn’t help our cause. I’m sure Anthony and others have read various sites that pick apart Goddard’s poor work. So why are they printed here among other much more legitimate points? Are we just trying to make noise or are we trying to raise strong, believable arguments? I don’t like seeing the good work Anthony is doing diluted by stuff like this.