By Steven Goddard
Last month we discussed how NASA continues to spread worries about the Antarctic warming and melting.
A January 12, 2010 Earth Observatory article warns that Antarctica
“has been losing more than a hundred cubic kilometers (24 cubic miles) of ice each year since 2002” and that “if all of this ice melted, it would raise global sea level by about 60 meter (197 feet).“
[Note that is continental ice, not sea ice, – Anthony]

NASA’s 1982-2007 map showing Antarctica warming

But NSIDC seems to be thinking differently in their March 3, 2010 newsletter. They say Antarctica is cooling and sea ice is increasing (makes sense – ice is associated with cold.)
Sea ice extent in the Antarctic has been unusually high in recent years, both in summer and winter. Overall, the Antarctic is showing small positive trends in total extent. For example, the trend in February extent is now +3.1% per decade. However, the Amundsen and Bellingshausen Seas show a strong negative trend in extent. These overall positive trends may seem counterintuitive in light of what is happening in the Arctic. Our Frequently Asked Questions section briefly explains the general differences between the two polar environments. A recent report (Turner, et. al., 2009) suggests that the ozone hole has resulted in changes in atmospheric circulation leading to cooling and increasing sea ice extents over much of the Antarctic region.
The NSIDC graph below shows the upwards trend in Antarctic Sea Ice. Some recent years have shown anomalies as high as +30%.

http://nsidc.org/data/seaice_index/images/s_plot_hires.png
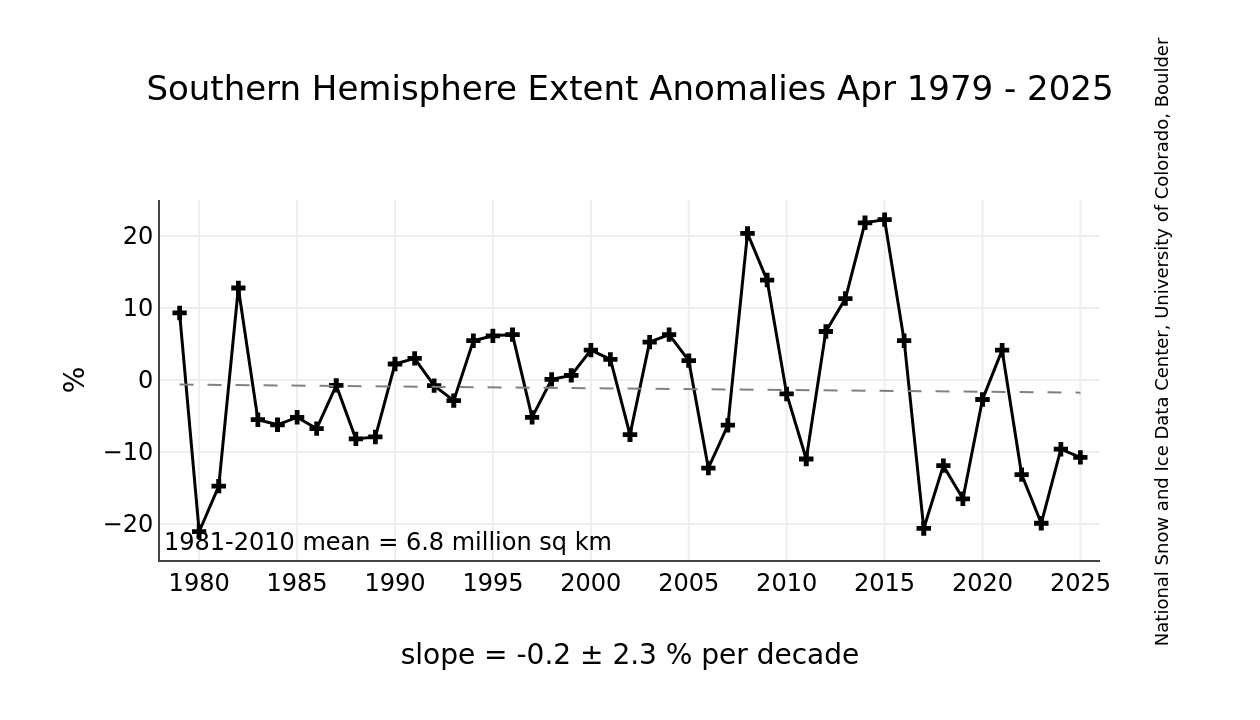
UAH satellite data also shows Antarctica cooling, as seen in their map below. (This map is dated November, 2006 – if anyone knows where to get a more recent version, please let me know.)


UAH 25 Year Temperature Trends
Perhaps NASA should have stuck with their original 2004 map below, showing Antarctica’s interior cooling?

NASA’s 1982-2004 map showing Antarctica cooling

While there’s no dispute that there’s some sea ice loss in the Antarctic peninsula, all signs seem to point in the opposite direction of what some what have you believe about Antarctica as a continent.
Sponsored IT training links:
We offer self paced 312-50 training with up to date 642-611 dumps and 70-450 practice test to provide guaranteed success in first dive.
Smokey,
Don B.’s chart doesn’t “debunk” anything I posted. Arctic sea ice has been in a year-on-year decline for many year, and the anomaly chart I posted, here:
http://arctic.atmos.uiuc.edu/cryosphere/IMAGES/seaice.anomaly.arctic.png
Is the absolute best way to see this decline. We’ve not see a positive anomaly in the arctic sea ice since 2004, and no amount of verbal cleverness or manipulation of short term data will change that either. And despite the attempts at both sides of the issue to spin data for their own interests, I only care about the truth of the situation. Even more to the point, I have openly said that if the arctic truly starts to show long term freqent positive anomalies, then I would seriously begin to doubt my own current belief that AGW is likely a correct hypothesis. However, when either side pushes and manipulates that data, it reminds me of the used car salesman approach, and I never buy used cars from them, simply because they are so seedy.
We have a winner my faith in the AGW hypothesis will be diminished.
Hey, I bet the cold is coming from the SOUTH OF FRANCE.
http://news.bbc.co.uk/2/hi/europe/8557570.stm?ls
Does it (A) “actually show the earth is COOLING down,” or does it (B) show a single factor which “contributes” to a cooling of the Earth among many other confounding factors contributing to the warming and cooling of the Earth?
It does demonstrate that the Earth is radiating extraordinary levels of infrared energy from the regions of the troposphere where water condensation takes place in the cloud systems, and those extraordinary levels of infrared energy are emitted into space from the vicinity of the cloud tops and the inversion layer in the mid-upper troposphere. The quantity and the location of these infrared emissions in the mid-upper troposphere are especially noteworthy when they occur in correlation with extensive precipitation of frozen rain and snow.
If you look at the energy required in a phase change to freeze and thaw water , you’ll see what a great difference there is between water vapor and liquid water versus frozen water. Consequently, whenever you see extensive precipitation of frozen water such as frozen rain and snow, you must expect to see a much greater release of energy than you usually see with only liquid water such as rain. It is this substantial disparity of energy absorption and emission between phase changes of water which is responsible at least in part for the Earth’s natural thermostat and limitations in temperature ranges.
R. Gates points to the satellite observations of these thermal energy emissions from the mid-upper troposphere and makes the hugely over-simplistic and erroneous conclusion and impression these satellite observations constitute evidence of the whole Earth radiating at warmer levels.
First, the 14,000 foot level is the place in the Earth’s atmosphere from which much of the Earth’s thermal energy is dumped into space by the convection of the water cycle, thereby contributing to cooling of the planet. Condensation of frozen rain and snow at about 14,000 ft. greatly enhances this transport of thermal energy to space.
Second, if R. Gates’ simplistic and erroneous assumption/s about the satellite observations were the only factor involved in determining the thermal state of the Earth, then the warmth in the troposphere would be an indication the Earth is cooling and not warming. In the real world, however, his assumption/s are utterly wrong, and the satellite observations of the 14,000 ft warmth is only an indication that precipitation events are “contributing” to cooling of the Earth at extraordinary levels. It is, however, a bridge much too far to assert this one factor predominates all of the other confounding factors to result in an overall warming or cooling of the Earth. It is what it is, just another contributing factor in an unclear overall equation.
Suffice it to conclude, R. Gates fails to understand and comprehend the information he is reading and citing, deceiving himself and others.
Leif Svalgaard (09:49:19) :
“You can make the calculation and show me wrong. The correlation means nothing.”
There is more to it than just correlation. Circulating saline water (electric conductor) in magnetic field will generate emf, electric current, new opposing magnetic field etc; result slowdown in circulation and reduction in the GMF.
On the other hand one could claim it is an irrelevant coincidence that there is dip in the Z field coinciding with centre of Beaufort Gyre, the largest and strongest gyre in the Arctic Ocean.
http://www.vukcevic.talktalk.net/LFC15.htm
Sorry but there is no Ozone hole. The ozone layer is thinner at the poles, that’s all. And if you read about how stratospheric ozone is formed, it is logical that the ozone layer is thinner at the poles, there is less ozone forming radiation at the poles.
The wind doth blow
By which way
NOAA doth know
All above, all below
vukcevic (11:30:51) :
Circulating saline water (electric conductor) in magnetic field will generate emf, electric current, new opposing magnetic field etc; result slowdown in circulation and reduction in the GMF.
Do us all a favor and use simple high-school physics to actually calculate the current and the heating and the Lorentz force, and show how insignificant they are. I have done it here before, but this time you do it, to convince yourself, so you can stop this nonsense.
Over time, the earth radiates out the same amount of energy as it receives, plus heat derived from radioactive decay. This is due to the first law of thermodynamics.
The Scientific Committe on Antarctic Research (SCAR) in its report “Antarctic Climate Change and the Environment” Dec 2009 http://www.scar.org says that “the sea ice extent shows a positive increase of 1% per decade”. So why would NASA say otherwise? Remember this report came out in Dec 2009!!
Also, snowfalls have remained immune to climate change being static since 1957. Temperature is also unchanged except for the Western Antarctic, which has been warming since 1800!
Nothing scary here, no pun intended!
Here’s my most fine-tuned version yet:
The wind blows
In which way
NOAA knows
All above, all below
Leif Svalgaard (09:49:19) :
vukcevic (09:03:35) :
But of course one cannot totally exclude possibility that you also could be wrong.
You can make the calculation and show me wrong. The correlation means nothing.
Not wishing to divert a private discussion, but what about unknown unknowns?
I work for kings
Give me wings
I’m a CRUdude
I need blings
D. Patterson (10:55:31) :
Gail Combs (09:03:39) :
D. Patterson (01:37:51) :
[….]
In other words when Dr. Roy Spencer showed high satellite temperature records in January 2010 it is actually show the earth is COOLING down by radiating more thermal energy thanks to the record snow and rainfall. Is that correct?….
“It does demonstrate that the Earth is radiating extraordinary levels of infrared energy from the regions of the troposphere where water condensation takes place in the cloud systems, and those extraordinary levels of infrared energy are emitted into space from the vicinity of the cloud tops and the inversion layer in the mid-upper troposphere…..”
Thank you for the clarification. I am well aware that this is just one of many factors in a very complicated system. As Bob Tisdale and many others have pointed out the earth is 70% water and we can not ignore its effect on climate.
Steve Goddard (08:46:56) :
Wren,
Hansen says it is “going away soon.”
http://www.physics.utoronto.ca/news_repository/will-oceans-surge-59-centimetres-this-century-or-25-metres
==========
I read the cited article, and didn’t find Hansen quoted as saying it (antarctic) is “going away soon.”
“Prof. Hansen and his colleagues argue that rapidly melting ice caps in Antarctica and Greenland could cause oceans to swell several metres by 2100 – or maybe even as much as 25 metres, which is how much higher the oceans sat about three million years ago.”
Reminds me of the 1960s.
D. Patterson said:
“(R. Gates)…makes the hugely over-simplistic and erroneous conclusion and impression these satellite observations constitute evidence of the whole Earth radiating at warmer levels.”
Nope, never said the “whole earth” once, and would never say the whole earth is radiating at warmer levels, as that would be a nonsensical and erroneous statement. The troposphereic temperature data is exeptional useful and important, and my whole point in even mentioning it is because it is diplaying exactly what we’d expect in January, February, and now into March 2010, if, as the Met Office has stated, and I also believe, there is a good chance that 2010 will be the warmest on instrument record. A warm troposphere is exactly what AGW models predict, as that is where the “action is” so to speak in terms of GH forcing…i.e. that’s where the GH gases do their business. LIkewise, in the same satellite data we see the Stratosphere is cooling, and that is exactly what AGW models predict. If the troposphereic temps were falling, or the stratospheric temps rising, it would not be a good sign for the AGW hypothesis.
“09 03 2010 Alan the Brit (01:54:20) : Question: I have heard Ian Plimer et al claiming that the ice on Greenland and that in Antarctica is in a basin.”
Maybe so, maybe no. All that ice is heavy, and depresses the crust in the area. Removing the ice would result in crustal rebound. The amount of rebound would be a whole ‘nother discussion.
R Gates,
The average temperature of the atmosphere at 14,000 feet is warm because of El Nino.
http://www.woodfortrees.org/plot/uah/from:1978/plot/rss/from:1978
Two years ago it was low because of La Nina. Seems simple enough?
Leif Svalgaard
There are a lot of bright people posting on this site. I am not one of them. I try to read all the posts and discern something new and factual from them. There are many on both sides of the debate who offer interesting views and there are others who are just agenda driven. What I don’t get is that just about 100% of your posts end up with either a condescending or derisive comment. Your posts indicate a very high level of specialized knowledge, usually I have no clue what you are talking about but I think it’s time for you to lighten up.
EdP
Wren (12:02:50) : That expression “going away soon” perhaps refers to the possibility of Hansen going somewhere else in his coal trains…
Anyway, Bon voyage!
SandyInDerby (11:44:09) :
what about unknown unknowns?
To qualify the things would have to stay unknown, no?
But here is some known knowns about that:
http://www.geomag.us/info/Smaus/Doc/ocean_encycl.pdf
The secular variation is 1000 times slower than the [small] daily and hourly variations calculated in the paper and its effect dB/dt is thus a thousand times smaller still. Vuk’s case is particularly sad, as he should know better, but sometimes people get so enamored by their ideas that common sense [and engineering education] goes out the window.
vukcevic (11:30:51) : As logic teaches, he who denies a denier it’s a believer!!☺
correction:,,,is a believer
@Wren (23:06:35) :
“NASA says
“The answer boils down to the fact that ice can flow without melting.” ”
========================================
Wren, you’re faith in what “NASA says” is astounding. At this point in time, if NASA said the sky was blue, I’d go out side and look.