The Warning in the Stars
By David Archibald
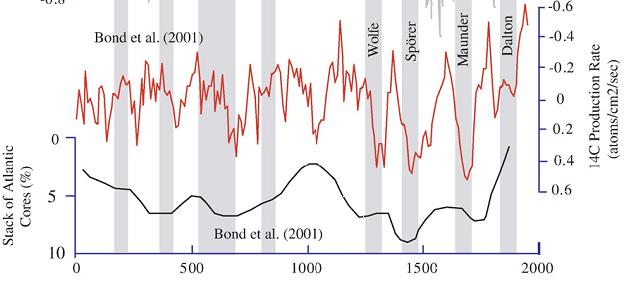
If climate is not a random walk, then we can predict climate if we understand what drives it. The energy that stops the Earth from looking like Pluto comes from the Sun, and the level and type of that energy does change. So the Sun is a good place to start if we want to be able to predict climate. To put that into context, let’s look at what the Sun has done recently. This is a figure from “Century to millenial-scale temperature variations for the last two thousand years indicated from glacial geologic records of Southern Alaska” G.C.Wiles, D.J.Barclay, P.E.Calkin and T.V.Lowell 2007:

The red line is the C14 production rate, inverted. C14 production is inversely related to solar activity, so we see more C14 production during solar minima. The black line is the percentage of ice-rafted debris in seabed cores of the North Atlantic, also plotted inversely. The higher the black line, the warmer the North Atlantic was. The grey vertical stripes are solar minima.
As the authors say, “Previous analyses of the glacial record showed a 200- year rhythm to glacial activity in Alaska and its possible link to the de Vries 208-year solar (Wiles et al., 2004). Similarly, high-resolution analyses of lake sediments in southwestern Alaska suggests that century-scale shifts in Holocene climate were modulated by solar activity (Hu et al., 2003). It seems that the only period in the last two thousand years that missed a de Vries cycle cooling was the Medieval Warm Period.”
The same periodicity over the last 1,000 years is also evident in this graphic of the advance/retreat of the Great Aletsch Glacier in Switzerland:

The solar control over climate is also shown in this graphic of Be10 in the Dye 3 ice core from central Greenland:

The modern retreat of the world’s glaciers, which started in 1860, correlates with a decrease in Be10, indicating a more active Sun that is pushing galactic cosmic rays out from the inner planets of the solar system.
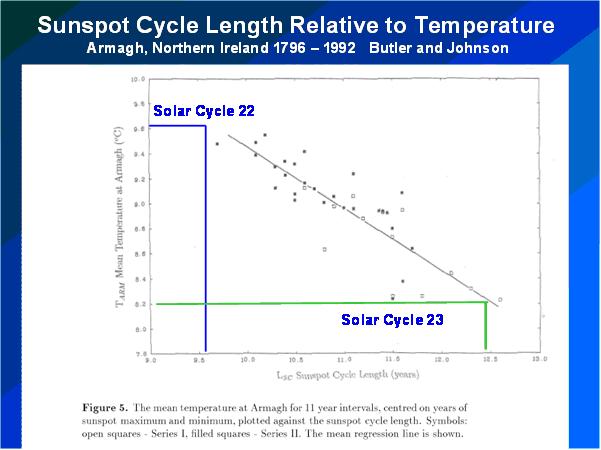
The above graphs show a correlation between solar activity and climate in the broad, but we can achieve much finer detail, as shown in this graphic from a 1996 paper by Butler and Johnson (below enlarged here)::

Butler and Johnson applied Friis-Christensen and Lassen theory to one temperature record – the three hundred years of data from Armagh in Northern Ireland. There isn’t much scatter around their line of best fit, so it can be used as a fairly accurate predictive tool. The Solar Cycle 22/23 transition happened in the year of that paper’s publication, so I have added the lengths of Solar Cycles 22 and 23 to the figure to update it. The result is a prediction that the average annual temperature at Armagh over Solar Cycle 24 will be 1.4C cooler than over Solar Cycle 23. This is twice the assumed temperature rise of the 20th Century of 0.7 C, but in the opposite direction.
To sum up, let’s paraphrase Dante: The darkest recesses of Hell are reserved for those who deny the solar control of climate.
This essay is also available in PDF form: TheWarningintheStars
Discover more from Watts Up With That?
Subscribe to get the latest posts sent to your email.
Vukcevic (14:40:13) :
Still no comment on…
Here was my comment:
Leif Svalgaard (14:18:29) :
Vukcevic (13:59:35) :
Now, to be serious, I know you have looked at this graph
http://www.vukcevic.talktalk.net/LFC9.htm
but studiously avoided any comment. You got all the data…Just coincidence?
This is not being serious. It is not even coincidence [and I do not studiously avoid anything – but somethings are just too silly to warrant comment], just selection.
Leif Svalgaard (12:45:56)
Well you accept that the sun’s output varies but you don’t have a definitive physical reason and cannot predict it’s level of activity or the length of the solar cycles to any useful degree. You seem happy to do your work without a physical reason so you should not be demanding such of me.
Likewise we see that the ocean surface temperatures vary yet ENSO on it’s own nor the PDO explain the longer term cycling from MWP to LIA and the Modern Warm Period and the obvious earlier cycling during the current interglacial for the past 10,000 years.
So from simple observations of sun and ocean we see that there is cycling on multiple timescales.
Now all I do is observe what happens and assert the obvious namely that there is a climate response to the interaction between those separate and independent solar and oceanic cycles. That climate response differs according to which is dominant and the absolute level of each component.
I don’t need to sort out the physical reasons and indeed at present I cannot just as you cannot give a definitive explanation of solar variability.
However the fact is that the climate at any given moment is a consequence of the sun/ocean interaction whatever the cause of the cycling in each or the timing of the cycling in each and every climate change ever recorded is adequately explicable in terms of that interaction with no need for CO2 ‘forcing’.
Furthermore climate is nothing to do with actual temperature. Climate is simply the way the equilibrium process in the troposphere is distributed geographically by the positioning of the air circulation systems and the speed of the hydrological cycle.
The patterns of air circulation in the troposphere will always remain broadly the same whatever the actual temperature. One just sees a shift in the positioning of the different air circulation systems and the speed of the hydrological cycle whether the dominating effect is sun, oceans, cosmic rays, CO2 or little green men.
And at all times the equilibrium towards which the system will always move is set by the warming effect of the sun (however achieved – not just raw power output), the length of time it takes solar energy in the oceans to be released back to the air and the rate at which solar energy is released from the atmosphere to space.
Of those factors by far the most influential in terms of the creation of internal system variability must be the length of time it takes solar energy in the oceans to be released back to the air.
Nothing else comes close.
Vukcevic (14:40:13) :
Leif Svalgaard (14:22:23) :
Still no comment on
http://www.vukcevic.talktalk.net/LFC9.htm
?
Come on you can do better than that, or maybe a further consideration is required.
If not a coincidence I have no idea.
~
Vuks, like your new wrecking ball. Went looking for this “ULF energy transfer in the solar wind – magnetosphere
– ionosphere – solid Earth system”
R. Kessel, F. Freund, G. Duma
before being sent away, and nada, couldn’t even make full title, maybe what Leif said.
~
Leif Svalgaard (14:52:34) :
Vukcevic (14:40:13) :
Still no comment on…
Here was my comment:
Leif Svalgaard (14:18:29) :
Vukcevic (13:59:35) :
Now, to be serious, I know you have looked at this graph
http://www.vukcevic.talktalk.net/LFC9.htm
but studiously avoided any comment. You got all the data…Just coincidence?
This is not being serious. It is not even coincidence [and I do not studiously avoid anything – but somethings are just too silly to warrant comment], just selection.
~
I know we have been here before Leif, but silly? Are we being sent to the Group W bench?
Arlo Guthrie, “Alices Restaurant”
Alice’s Restaurant Group W Bench
Stephen Wilde (15:39:00) :
Well you accept that the sun’s output varies but you don’t have a definitive physical reason and cannot predict it’s level of activity or the length of the solar cycles to any useful degree.
But we do know why it varies and we have rather successfully predicted recent solar cycles [ conclusion from http://solarphysics.livingreviews.org/Articles/lrsp-2010-1/ “Predictions for the amplitude of a cycle based on the Sun’s polar field strength or on geomagnetic activity near cycle minimum are significantly better than using the climatological mean”]
So from simple observations of sun and ocean we see that there is cycling on multiple timescales.
except that there is little evidence that they anything to do with each other. The fact that they both vary does not mean that the are connected or related in any way.
That climate response differs according to which is dominant and the absolute level of each component.
You cannot use the climate to make that determination. You have to start with the components and from them determine what is dominant.
I don’t need to sort out the physical reasons and indeed at present I cannot just as you cannot give a definitive explanation of solar variability.
There is big difference between nothing at all and giving a reasonably successful explanation. “Definitive” is a big word.
However the fact is that the climate at any given moment is a consequence of the sun/ocean interaction
Is irrelevant as we are talking about variation of the Sun.
Carla (16:57:21) :
I know we have been here before Leif, but silly? Are we being sent to the Group W bench?
Yes, silly.
Leif Svalgaard (17:36:20) :
Carla (16:57:21) :
I know we have been here before Leif, but silly? Are we being sent to the Group W bench?
Yes, silly.
~
Vuks, how did we get sent to the Group W bench for this. “Our special crime, littering and creating a nuisance.” ?
Or what’s up with this?
~
Vukcevic (14:40:13) :
Still no comment on…
Here was my comment:
Leif Svalgaard (14:18:29) :
Vukcevic (13:59:35) :
Now, to be serious, I know you have looked at this graph
http://www.vukcevic.talktalk.net/LFC9.htm
but studiously avoided any comment. You got all the data…Just coincidence?
Carla (16:57:21) :
Alice’s Restaurant?
That was so sixties.
I know this is hackneyed, but if you remembered that aspect of the sixties then you weren’t really there.
John
Carla (18:43:53) :
There is a popular fallacious argument often made toward people who try to live highly rational lives. By rational I mean those who try to not accept anything on belief. Who try to apply thought to all things real. They are the reality huggers.
The argument toward the rational person goes like this, you rational guys by your own principles must look at every single possibility or every theory or every single hypothesis by anybody . . . blah blah blah . . . because if you don’t then how can you say you are rational.
One of the good answers [there are several] by a rational person is NUTS [thanks General Anthony McAuliffe]. It is appropriate for a rational person to say, I of my own volition choose what I focus my mind on. Only I choose that. My time is really valuable to me. Present your case to me that what you are saying has enough value to warrantee my focus, otherwise I will not focus on your stuff. If your sales job doesn’t meet the cut, you are cut out of my focus. : )
John
Leif Svalgaard (17:36:20)
You keep missing the point.
1) I am not suggesting that the solar and oceanic cycles are necessarily connected in any way. Hence my point that they seem to cycle independently. They probably are connected at some level but it does not appear clearly in the observed climate.
2) I am not using the climate to make any determination. I am saying that observing the interaction of both solar and oceanic cycles gives us the climate. Other variables are involved but at a lower order of influence.
3) My comments are relevant here because solar behaviour is and must always be involved in climate changes albeit heavily modulated by other internal system variables such as what seems to be an overwhelming oceanic variability.
I appreciate your position and that of David and I see some merit in both. You have the edge because the observed variability in solar power is so small as a proportion of total solar output. David’s position has merit because solar variability does appear to affect the rate of energy flow to space as we see from the SABER observations.
As to how the solar effect works your point is that the topmost layers of the atmosphere are so thin that they ‘cannot’ in your view have any effect at all or any effect is so small as to be negligible.
However you seem to be evading the point about the possible effect of changing surface areas at the top of the atmosphere and at each layer interface within the atmosphere caused by variations in solar turbulence. It is intrinsically unlikely there should be such a strong effect in the thermosphere but a zero effect lower down.
You point out that the variations in the sun are miniscule in terms of power output. Then how does the thermosphere temperature vary so much ? Apparently it can go from 500C to 1500C and back again. A miniscule variation in solar power seems unlikely to be responsible for all that.
I’m inclined to think that the thermosphere temperature could just as well vary as a result of changes in the rate of energy flow from below as from solar changes above.
You say that the thermosphere cannot affect the lower layers because it is so thin. That would be fine if we were considering a downward energy flow.
However we are considering here an upward energy flow and so the lower layers would be in control of the thermosphere temperatures and being so much more dense they would have a powerful effect on the small number of molecules in the thermosphere above.
Leif,
I forgot to mention that my climate explanation is proving to be ‘reasonably successful’ as time goes by and it fits past climate behaviour pretty well too so I don’t accept a significant difference in quality or accuracy between your solar ‘explanations’ or my climate ‘explanations’.
Stephen Wilde
Perhaps a naive question – which oceanic cycles are you referring to in terms of phase relationship with solar cycles – ENSO, PDO, AMO ? There are several ocean cycles and they have different time timelines. How do you define a single oceanic cycle? Indeed, Tsonis has shown that the moving in and out of phase of the various oceanic cycles (PDO, AMO) relative to eachother itself switches climate between warming and cooling phases in context of chaotic harmonic dynamics.
In general the ocean cycles are short – 8 years or so for ENSO, 20-30 years for PDO, AMO etc. The sunspot cycle is only 11 years. Its hard to believe a phase relation between such short cycles which both vary somewhat can be maintained for tens of thousands of years. Are you referring to longer term ocean and sun cycles, such as solar minima? (Maunder, Sporer etc.)
BTW in the wikipedia solar cycles link you provided, it is notable that the interglacials over the last million years all occur at eccentricity maxima (although the magnitude of eccentricity and interglacial maxima don’t correlate).
John Whitman (23:03:27) :
Carla (18:43:53) :
Dr. Svalgaard will consider only proper scientific analysis of the problem, however I suspect he is a bit intrigued by the ‘apparent relationship’.
http://www.vukcevic.talktalk.net/LFC9.htm
If the geographic North Pole’s magnetic field intensity is correlated to the integrated sunspot count for the period, then ‘R square’ is respectable 0.59 implying negative (reverse proportionality) correlation of 77%, which isn’t bad at all.
More details available soon on http://www.vukcevic.talktalk.net/GandF.htm
phlogiston (02:26:40)
I’ve always taken the view that one needs somehow to net out the effect of all the ocean cycles combined at any given moment.
On that basis Tsonis may well be correct.
The issue of eccentricity is one that I still need to look into in more detail. I see that as a component in whatever sets up the solar effects in the first place. I never said that it was only the level of solar surface activity that was involved.
There are at least 3 timescales involved and possibly more.
For the sun:
i) variations within each solar cycle. Individual bursts of flares and sunspots.
ii) variations over a series of cycles. Multiple cycles more active or less active than ‘normal’.
iii) variations on the scale of Sporer, Maunder, Modern Maximum etc.
Then one has to start bringing in orbital factors for longer term solar variability.
For the oceans:
i) Interannual ENSO events
ii) PDO phase shifts (assuming they are independent of ENSO)
iii) Probable 1000 year cycle from peak to peak since the sun doesn’t vary enough to do it and we see the ITCZ shift latitudinally which is an ocean cycle fingerprint in my view.
Possible longer term variability not yet adequately recognised due to lack of historical detail but not relevant for current climate concerns.
The critical issue though is that whatever happens and however those cycles interact over time the system response to retain equilibrium is always a shift in the positions and sizes of the air circulation systems and thus the speed of the hydrological cycle. The climate system will always react to changes in the rate of energy transfer from oceans to air and changes in the rate of energy transfer from stratosphere to space so as to retain equilibrium for the system as a whole.
Climate is simply the geographical distribution of the equilibrium process.
One can even deal with the ‘faint sun paradox’ by suggesting that when the sun is fainter the hydrological cycle is slower so that the surface temperature is little different.
Underlying it all is a relatively stable density and pressure differential at the ocean surface that sets the system equilibrium temperature by dictating a relatively stable background rate of energy transfer from oceans to atmosphere.
””Vukcevic (02:51:30) : however I suspect he is a bit intrigued by the ‘apparent relationship’. ”””
V,
I do not think I would want to play poker against Dr Svalgaard.
John
John Whitman (04:29:56) :
””Vukcevic (02:51:30) : however I suspect he is a bit intrigued by the ‘apparent relationship’. ”””
And I’m not intrigued. Vuk is diluting the discussion by nonsense [for his own amusement].
Phlogiston 2:26:40
It’s a bit of quibbling but the cycle of the PDO is over 60 years, each phase is around 30.
I don’t think it’s necessary for the purported short cycles to forever stay locked; it’s easy to imagine a slippage, a cog missed. The cog is missed, but the clock ticks on.
I’ve long been intrigued by the idea that there are around 6 solar cycles to each cycle of the PDO, and I even have a mechanism in which an alternating phenomenon in the solar cycle produces the cycle of the PDO by placing two solar cycles of one type and one of the other in each phase of the PDO, but Leif pooh-poohs it as a second order effect. It even involves cosmic rays.
===================
Leif Svalgaard (04:44:46) :
John Whitman (04:29:56) :
re: http://www.vukcevic.talktalk.net/LFC9.htm
Declaring something nonsense is not a step forward in comprehending mystery of unknown. Here are the numbers: column 2 is integrated sunspot number , column 3 is Vertical Component of GMF at 90 degrees North (microTesla), for period 1610-2000. Excel’s calculated correlation function CORREL = – 0.76873.
In no terms this number can be considered a ‘nonsense’.
1610 47.1 63
1620 27.1 63.9
1630 19.1 64.5
1640 21.2 65
1650 2.9 65.2
1660 0 65.2
1670 0 64.9
1680 0 64.4
1690 0 63.7
1700 0 62.9
1710 2.9 62.1
1720 15.9 61.4
1730 26.5 60.7
1740 33.5 60.1
1750 44.1 59.6
1760 45 59.2
1770 58.8 58.9
1780 67.6 58.5
1790 58.8 58.2
1800 32.4 57.7
1810 20.6 57.3
1820 23.5 56.9
1830 42.6 56.7
1840 59.7 56.5
1850 57.4 56.4
1860 52.4 56.5
1870 52.6 56.6
1880 39.4 56.7
1890 37.4 56.8
1900 34.1 57
1910 35 56.7
1920 42.1 56.2
1930 45.3 55.9
1940 61.2 55.8
1950 77.1 55.8
1960 81.5 56.1
1970 68.5 56.5
1980 75 56.7
1990 80 56.3
2000 67.6 56.6
Vuk,
I suspect your baggage with Dr Svalgaard [and I use his honorary title purposefully] on WUWT preceded my appearance here.
I will not play catch-up.
I remember my offspring telling me midway through junior undergraduate year that the precious gift of college was enlightenment. At that moment I could not have loved my offspring more.
This is not a criticism of you, I seek enlighenment.
John
John Whitman (22:40:08) :
Carla (16:57:21) :
Alice’s Restaurant?
That was so sixties.
I know this is hackneyed, but if you remembered that aspect of the sixties then you weren’t really there.
John
~
Grew up in a household with 3 older brothers. (range9-5 yrs older) Was only 10 for the album release of Alices Restaurant, but was indeed looking and alwawys listening, so was there. Technically it was a song about the draft, but covered other aspects of society. ( like the segement on “blind Justice”)
When these discussions get too heavy for me, (have you read some of these technical docs?) music becomes a diversion or escape time, to free up my brain from thinking about some of the topics discussed here.
~
John Whitman (23:03:27) :
..One of the good answers [there are several] by a rational person is NUTS [thanks General Anthony McAuliffe]. It is appropriate for a rational person to say, I of my own volition choose what I focus my mind on. Only I choose that. My time is really valuable to me. Present your case to me that what you are saying has enough value to warrantee my focus, otherwise I will not focus on your stuff. If your sales job doesn’t meet the cut, you are cut out of my focus. : )
John
~
yeah ditto, we all do this, right? Geesh good thing my lively hood is not dependent upon my sales ability. Focus on what you will, John.
John Whitman (05:33:56) :
And I also seek to use a spellchecker more often and also to proof read the text after the dumb spellcheck.
Good night dear WUWTers.
John
Vukcevic (05:33:02) :
Declaring something nonsense is not a step forward in comprehending mystery of unknown.
The nonsense comes in when ascribing significance to a correlation between those two particular variables, compounded by not understanding statistics: the integrated sunspot numbers are not independent data points, so the R^2 is nonsense.
The magnetic field at the North Pole was 50% higher 2000 years ago than today. Applying your spurious ‘correlation’ gives an integrated sunspot number of some -50 back then, more nonsense.
The nonsense lies in conjuring ‘mysteries’.
And Vuk, this is my final word on this. I don’t know why I even bother. Read Shermer’s book: http://www.amazon.com/People-Believe-Weird-Things-Pseudoscience/dp/0805070893
John Whitman (05:33:56) :
Agreed, both baggage and enlightenment. It is challenge of the unknown. Having said that, I have nothing but greatest respect for the knowledge, experience and reputation of Dr. Svalgaard. It is his ‘put-downs’ that have actually worked miracles, and kept me rather busy during last couple of years. This one for time being ‘ad acta’.
Solar-Lunar association with volcanic activity:
http://www.sfu.ca/~plv/SAOT-SLAMaaChandler.png
Paul;
That graph of SAOT fascinating. If you want to writeup anything about it, I’ll turn it into a guest post. – Anthony
Vukcevic (05:33:02) :
Leif Svalgaard (04:44:46) :
John Whitman (04:29:56) :
re: http://www.vukcevic.talktalk.net/LFC9.htm
Declaring something nonsense is not a step forward in comprehending mystery of unknown. Here are the numbers: column 2 is integrated sunspot number , column 3 is Vertical Component of GMF at 90 degrees North (microTesla), for period 1610-2000. Excel’s calculated correlation function CORREL = – 0.76873.
In no terms this number can be considered a ‘nonsense’.
1610 47.1 63
1620 27.1 63.9
1630 19.1 64.5
1640 21.2 65
1650 2.9 65.2
1660 0 65.2
1670 0 64.9
1680 0 64.4
1690 0 63.7
1700 0 62.9
1710 2.9 62.1
1720 15.9 61.4
1730 26.5 60.7
1740 33.5 60.1
1750 44.1 59.6
1760 45 59.2
1770 58.8 58.9
1780 67.6 58.5
1790 58.8 58.2
1800 32.4 57.7
1810 20.6 57.3
1820 23.5 56.9
1830 42.6 56.7
1840 59.7 56.5
1850 57.4 56.4
1860 52.4 56.5
1870 52.6 56.6
1880 39.4 56.7
1890 37.4 56.8
1900 34.1 57
1910 35 56.7
1920 42.1 56.2
1930 45.3 55.9
1940 61.2 55.8
1950 77.1 55.8
1960 81.5 56.1
1970 68.5 56.5
1980 75 56.7
1990 80 56.3
2000 67.6 56.6
~
Maybe you’re not such a “bad boy” after all and we don’t belong on the “Group W” bench with the rest of the “bad boys.”
For All you fathers that told your daughters not to go out with the “bad boys.” Did you provide them with the tools to be able to discern what a bad boy is? With 3 older male siblings, you not only learn what a “bad boy” is,.. but what a bad girl is too. You learn at an early age what constitutes a “bad girl,” good girl, and really goood girl. lol Rough job trying to land in the middle of that. Was Clinton a “bad boy?” Didn’t inhale or have sex with Monica.
Keep on pushing on Vuks.
Stephen Wilde (23:19:29) :
You point out that the variations in the sun are miniscule in terms of power output. Then how does the thermosphere temperature vary so much ? Apparently it can go from 500C to 1500C and back again. A miniscule variation in solar power seems unlikely to be responsible for all that.
The thermospheric density is a billionth to a trillionth of the tropospheric density, so it doesn’t take much to change its temperature.
Re: Anthony Watts (07:09:35)
Anthony, feel free to turn that comment [Paul Vaughan (06:52:31)] into a post – or quote me – or whatever. I’ve little doubt it might generate some discussion simply as-is. If you go that route, I might drop some notes in the thread as it evolves.