A couple of days ago I sent this email to Jeff Id of the Air vent, as he quite familiar with Antarctic surface temperature analysis, having outed the many problems with the Steig et al “Antarctica is Warming” paper, demonstrating poor statistical techniques used by Steig, with help from Michael Mann.
On Fri, Dec 11, 2009 at 3:11 PM, Anthony Watts wrote:
Subject: can you replicate this?
http://savecapitalism.wordpress.com/2009/12/11/ghcn-antarctica-careful-selection-of-data/
Best regards,Anthony Watts
Jeff replied yesterday with:
I can replicate it. The story behind this one is in the detail, which I’ve wasted a whole Saturday on.
Indeed the Devil is in the details, the details that few people, apparently including the scientists, bother to look at.
Jeff posted an excellent essay on the subject:
GHCN Antarctic, 8X Actual Trend – Uses Single Warmest Station
Excerpt:
The red circle is surrounding Rothera Point station.

So as we can see, of all the stations available in the antarctic, GHCN has chosen to use a single station on the Antarctic Peninsula to represent an entire continent of the earth for the past 17 years (red circle). But it’s not just any station, it’s a special one. Rothera Point has the single highest trend of any of the adjusted station data.
Notice that the station is on the Antarctic peninsula, I’ve always said that using stations here to represent trends on the main body of the Antarctic continent is plain wrong, becuase the peninsula is in a different climate zone. See my discussion here and Jeff Id’s proof of it here.
I’ve also said time and again that most manned stations in Antarctica would be “urban” compared to the surrounding area. There’s no small towns, farms, pastureland, woods, etc to compare to. Just millions of square miles of snow an ice. The research stations are the metropolises of Antarctica, each a warm pocket of humanity due to land use change and energy expended to keep warm.
For example, this picture on a postage stamp from Australia’s Mawson Station, celebrating the Australian Antarctic Territory in 1997, may help you visualize the issue. Note the Stevenson Screen near the “living pod” on the right.

Here is the larger photo of the first day of issue card, the Stevenson Screen is also just visible above the snowbank in the lower right. Rather close to human habitation I’d say. Looks like its near a small AHI (Antarctic Heat Island). More here

Click for larger image
I suspected similar problems might exist at Rothera, so I started looking around to understand what the measurement envirionment is like down there. First stop, Google Earth:

Looks cold, obviously taken in winter. But I also noticed something peculiar, that “tongue” that sticks out at the top of the photo. I showed my wife the photo without saying a word about it saying only “What does this look like to you?” Her one word answer: “airport”.
Yep and obviously not a naturally occurring one either. You can see that there has been infill between the point and Adelaide Island. I wondered what it looked like years ago? I found this photo in Google Earth’s Panoramio, circa 1976:

Looks rather sparse, few buildings, with no indication of a runway. Compare that to another Panoramio photo from a similar vantage point taken in 2007:

Obviously the photo above was taken in summer. Looks like there has been some growth and land use change since 1976, inlcuding adding the runway with locally available materials. Given the dark albedo, and the mostly volcanic history of the Antarctic peninsula, it seems likely that the “local materials” would be volcanic rock.
Here’s closer view of that rock, from “Claire of the Antarctic”

Here’s another photo from Panoramio, a large panorama, which shows the entire Rothera station and the full length of the runway from sometime in 2008 or early 2009, based on the upload date listed. I’ve corrected the extreme fisheye effect in the original image and cropped a closer view for better presentation here.

Here’s a link to the full sized lens corrected panoramic image. Warning quite large at 5463 × 709 and 0.6MB
So from the aerial and ground photos we can determine that:
- Rothera has seen land use change due to the infill for the runway and service areas.
- The albedo around the station has changed, due to the infill with that darker local materials.
- Rothera has seen growth in buildings, and presumably population since 1976.
- Rothera’s aviation fuel tanks seen above and here plus the new hanger indicate an increase in aviation traffic has likely been seen since 1976.
- There’s apparently pressure from the tourist trade also, enough that BAS has made the: Rothera Station_visitor_guidelines. How many ships and planes that now visit have anything to do with primary research? How much extra infrastructure was created to handle tourist traffic?
As an indication of an increasing tourist trade, there sure seems to be plenty of “tourist” type photos of Rothera Station on the web like this one:

According to a BBC reporter who visited Rothera Station, they even have a coffee house. Maybe a Starbucks even?

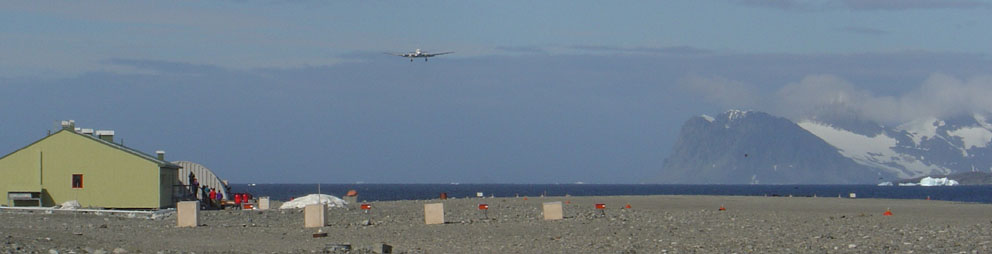
Here’s a DC-3 coming in for landing in January 2004. Research or tourists or both?

From the Wikipedia page where the improvements over time (and dates) to Rothera station have been listed) we find when the new runway was built:
With the commissioning of the gravel runway and hangar in 1991-92 air operations became more reliable and access to Rothera was greatly improved through a direct airlink from the Falkland Islands.
Just like airports wordwide, where many GHCN stations have been located, we see growth at the airport. Growth translates into UHI or in this case, AHI, since the next closest patch of humanity with a weather station is Base San Martin 75 kilometers away.
Here’s another take on the growth:
History: Built in 1975 on Adelaide Island, Rothera occupies a small rocky peninsula. A 3000′ (900m) crushed rock airstrip and hangar were added in 1990-91, making Rothera a peninsula region logistics center for British Antarctic Survey Operations.
Information: Rothera can accommodate 124 people and boasts one of the few aquariums in the Antarctic. The Bonner laboratory complex, completed in 1997, includes a recompression chamber, a wet lab and a terrestrial biology lab. A large new sleeping quarters building , which can house 88 people, is being constructed and should be completed by 2002.
So it is with little surprise, given the land use changes, the increased infrastructure, the new gravel runway, and an increased tourist trade that we see this sort of temperature plot from GISS:

Prior to 1985, it looks like recording temperature there wasn’t so important, as there is significant missing data. But with aviation growth comes a need for accurate weather information, and thus we don’t see any missing data since then.
Where do they actually measure the temperature at Rothera? That I don’t know yet, but given that the BAS puts hourly automated temperature reports on their website,and has a webcam it seems there is probably an automated weather station rather than a Stevenson Screen.

I’m guessing they have a readout for temperature in the comfort of the control tower:

For all I know the thermometer could be on the roof or side of the control tower. Not unheard of.
Regarding the GISS temperature plot. There’s a clear upwards trend. The question is: how much of it is caused by localized human influences and land use change?
Clearly, Rothera Station is no longer a “pristine” place to do science, it’s just another destination, a pocket of humanity with an airport, a coffee shop and the only heat for 75 kilometers.
Is Rothera a good place to measure a long term temperature trend to use for adjusting other Antarctic GHCN stations? Perhaps not.

It is a well known effect that coastal areas tend to be warmer than inland areas, due to the moderating effect of oceans, which have a great deal of thermal inertia. From the map included at the beginning of this post, it appeared that all of the temperature recording stations, save Byrd station at the pole, were on the coast. And the Rothera station, being on a peninsula, would almost certainly always be the warmest given that it is in close proximity to the water on two sides, and appears to be the northernmost station as well.
And this station was used by the GHCN to monitor the whole of the Antarctic continent? What a crock!
It’s possible I’m underestimating the potential heat transfer…but I assure you…as someone whose friend has just recently returned from a winter research excursion in Antarctica, those pods are not thin. It would be highly impractical and dangerous to house research scientists in Antarctic settlements that did not incorporate buildings designed to keep in the heat and keep out the cold.
Even if the heat transfer from those pods is the same as the heat transfer from (say) a residential neighborhood of comparable size, no urban heat island has ever been shown to exist in residential neighborhoods. Only in areas with population density greater than 1000 heads per square mile. Granted, the background thermo field in Antarctica is inherently more reflective than the fields of North America, so landuse changes will be very important. But anthropogenic UHI? I kind of doubt it. The biggest problem is the dark pumice used to pave the airport strip..the Stevenson screen and temperature equipment is probably entirely too close to that and in the summer, that’s probably causing noticeable warming.
BTW…there are similar sweeping problems with the temperature anomalies calculated in the NORTHERN polar regions too. The fewer people living in an area, the more suspect the temperature data. The fact that a large part of the global warming trend since the 60s has come from the north pole screams the potential for data manipulation and/or bad statistical techniques biasing the results by perhaps as much as half a degree C.
1. Are all antarctic stations sited near the natural limit of the land mass?
2. Is there evidence that coastal climate shows differences to the interior?
3. If so, how can coastal sites alone be representative of an enormous continent?
>>Those human settle pods you point out are designed
>>to keep in as much heat as possible…I would wager
>>that no significant heat is leaking from them.
If those pods were that good as insulators, then in the winter pics they would be covered in frost or adhering crystals of ice-snow.
In reality, the dark colour and leaking heat must be keeping them a few degrees above ambient – and that WILL affect the nearby Stevenson screen.
I worked down at Rothera in the 1990’s. It didn’t strike me at the time but it does now. Rothera Point has been largely cleared of ice and snow, for personnel safety reasons. The underlying rock is very dark. It also has a huge matt black gravel runway right alongside the main base.
Can’t remember exactly where the weather station was, but I’m pretty sure it wasn’t on snow/ice.
Of course this change in local albedo would have no effect on local temperature readings would it?
>>Incinerator
>>I cannot find any data with regards to how such a heat
>>plume would be contained and not effect air temperature
>>readings in the surroundings.
And if you get a big, fat high pressure system over the station, as you do in cold climes – with its accompanying and blocking temperature inversion – a lot of that heat will simply get trapped in the inversion.
This may be capable of warming the locality to a measurable degree
But, where are the solar arrays and wind farm? Could they be using evil fossil fuels?
We know now that we are dealing with dishonest people. It goes right back to the start when they realized that the best [rural] temperature stations showed little or no warming. The warming had to be fabricated by using badly sighted sensors and ‘adjustments’.
OT, the Lex column in today’s Financial Times shows some of the money interests involved. It lists the amount of subsidy or carbon tax needed by the alternative energy industry before they can compete with coal for electricity production. The units are euros per tonne of CO2 and are way above the current carbon trading price in Europe which is 14 euros a tonne:
co-fired biomass = 73
onshore wind power = 131
offshore wind power = 248
photovoltaic solar power = 572
“Roger Carr (17:59:50) :
Jeff Id replied: “I can replicate it. The story behind this one is in the detail, which I’ve wasted a whole Saturday on.”
Wrong.
Not one second of this and all the work done by such people to try and bring back reality (also sanity) for the sake of the entire world is “wasted”.
Both the present and the future owes a huge debt to you all. There is no waste in what you do.”
I second that.
cheers David
The guys at Rothera are in no way to blame here. Obviously, if you’re camped on the edge of Antarctica, and your chief link to the outside world is by air, your priority is to monitor the weather – including temperature – at the airstrip. On this basis, putting your thermometer on the control tower makes perfecr sense. Thyey’re monitoring weather, not climate after all.
The fault lies entirely with GHCN using these readings to measure long term climate trends. They are clearly unfit to measure this for the penisula, let alone for continental Antarctica.
On the matter of insulation, the pods will not be designed to keep in as much heat as possible, only as much as is economical. Lost heat costs money, but so does insulation, and the law of diminishing returns means that each additional layer of insulation saves less heat while still costing the same. At some point it’s just not worth adding any more. Also even a perfectly insulated pod will still release heat every time that someone goes in or out.
George Turner (16:48:33) :
“Isn’t this like estimating the temperature of North America from a single weather station in Miami?”
It is important to embarrass the man-made global warmers. Could someone take the North Ameican continent and overlay Antarctica so that the peninsula covers Florida? Send the diagrams to the media; then let the population decide if the Antarctic temperatures quoted are a scientific method to represent the temperature for all the continent.
Keith Minto (22:27:55) :
{George Turner (16:48:33) :
Isn’t this like estimating the temperature of North America from a single weather station in Miami?}
“REPLY: Bingo!”
[and Tenuc (14:52:18)]
“Sort of, but not as accurate……
Land area of the United States 3,719 million square miles
Land area of Antarctica 5,405 million square miles”
Thanks Keith – new it was big, but not THAT big 😮
GHCN = Global Hockystick Creation Network (and they expect anyone to believe this is science?)
The tricky truncactors are at work again…
First remove inconvenient data and if that’s not enough, eradicate stations.
ooops, ‘I meant truncators’
As Anthony stated in the thread, aviation safety is the primary reason temperature records are being taken at all. The temperature readings are obviously taken by the ATC people, and the thermometer is probably attached at the summit of the tower -and it is probably automated. Can’t blame the controllers; they have more important things to attend to.
This should be a serious lesson concerning station sitings. The climate people have been riding piggy back on the FAA/operational meterologists back for decades. What is good for aviation safety is usually not good enough for climate science. Yet, aviations weather reporting stations are usually far superior to NOAA’s Co-Op stations. And we’ve only been looking at North America. It is probably fair to say that the entire reporting network is garbage as far as long term continuity is concerned.
For those of you who have only thought as far as the effiency of the living pods, consider two things where does the heat and power come from. I would guess at lest some form of powered generator which, due to the comparative inefficiency of the generation process, must produce a lot of waste heat.
And what about all the waste produced (human and material) – they are not going to insulate that either.
Add the motor vehucles, aircraft and ships and you have multiple heat sources all over the area.
hotrod (19:16:37) :
What makes you assume that is the case? [that the South Pole would have no UHI effects]
The temperature readings were from the airport – which is a skiway. Bad siting of the thermometers could have resulted in the 80s-90s spike.
Butch (02:48:15) :
But, where are the solar arrays and wind farm? Could they be using evil fossil fuels?
Yup. The fuel farm is plainly visible in the left foreground of both “Rothera Station circa 2007” and “Rothera Station Circa 2008-2009”.
Helloooooo, generator heat plume…
Juraj V. (15:49:57) :
Fortunately, we have satellite readings above Antarctic:
http://www.climate4you.com/images/MSU%20RSS%20ArcticAndAntarctic%
Except of course that there are no reliable measurements below 70ºS.
See: http://www.remss.com/msu/msu_data_description.html#zonal_anomalies
SABR Matt (16:09:20) :
As I said…the only factor here is the albedo of the runway in my book…I do not believe 100 humans smattered around in very air-tight containment pods amounts to a significant urban heat island. The albedo affect may be real…and I placed the significance of it around 0.3 C in the summer (meaning 0.15 or so for the whole year)…which is not negligible. I just don’t think it’s going to result in big changes to the overall shape of that graph.
Also almost perpetual winds of ~30mph.
Not only does Rothera Station have the land use changes affecting it, but don’t forget those (relatively) warm ocean breezes. How does that relate to the deep interior of West Antarctica? It’s like judging the climate of Montana by what’s happening in Key West. The temperature right now in Key West, Florida is 80°F, 3° above the normal high for this date. Obviously, the U.S. then is warming. Wonder if that is any comfort to the residents of Montana?
Well if you put your arm down a burrow, and a mad as hell badger grabs your hand in its teeth and won’t let go; don’t go assuming that every hole in the ground contains a badger.
There’s a name for this sort of jump to unwarranted conclusions; it’s known as the Nyquist Sampling Theorem.
That’s why tree rings don’t serve to tell temperature from either; well core borings of tree rings certainly don’t.
Clearly Rothera is attracting a lot of grant money; which is going into anthropogenic (local) climate change.
Nothing more to see here folks; move along now !
according to wiki, who is hopefully not political on this matter….. The US is about 10,000,000 square kilometers. This is, I assume, including alaska and hawaii. Antarctica, according to wiki, is about 14,000,000 square kilometers. So, I guess the miami to the rothera point comparisons are resonable.
I had no idea that antarctica was so huge!
Most everyone in this thread seems to just assume that Rothera supplies the only temperature measurements for the Antarctic Peninsula. Have any of you tested that assumption?
I did a little Googling and pulled up some relevant data:
1. http://amrc.ssec.wisc.edu/aws.html
Antarctic Automatic Weather Stations Project
a. A list, dated 13 Nov 2009, of all Antarctic weather stations maintained
by all nations. It looks like there are about 280 of them.
http://amrc.ssec.wisc.edu/WisconsinAWSList-13Nov2009.pdf
b. And here is a map of Antarctica, showing the locations of those sites.
The automated sites managed by Universty of Wisconsin are identified,
and all sites are color-coded according to nation responsible.
http://amrc.ssec.wisc.edu/2009_AWS_Sites_ALL_6_10_2009.pdf
c. This site merits close attention: http://space.augsburg.edu/ago/
It would seem from this that Antartica is well covered by weather stations, automated and otherwise. Perhaps you folks need to revise your conclusions.