
We’ve been lectured time and again about the importance of having climate science work come from peer reviewed papers, saying that the work of dedicated amateurs has no place in climate science unless the work rises to publication/peer review level.
Yet that doesn’t seem to apply for United Nations science publications. Of course just one look at the front cover at left tells you its more about selling than science.
The cover image pulls at heartstrings, making the world appear as if it is running out of time before turning entirely into an inhospitable desert. That is an extreme view in my opinion.
Steve McIntyre’s blog discovery of UNEP’s folly bears repeating, because it shows the sort of sloppy science that is going into “official” publications.
This is much like the NCDC CCSP report just over a year ago where they used a photoshopped image of a “flooded” house.

In this case, the United Nations simply grabbed an image from Wikipedia that supported the view they wanted to sell. The problem with the graph in the upper right of page 5 of the UNEP report is that it itself has not been peer reviewed nor has it originated from a peer reviewed publication, having its inception at Wikipedia.
And then there’s the problem of “Hanno” who is an anonymous contributor. This is simply his/her artwork and interpretation. We don’t have any idea who “Hanno” is, nor apparently does UNEP.
Yet UNEP cites the graph as if it was a published and peer reviewed work as “Hanno 2009”. Yet UNEP doesn’t even get the year right as the graph was created in 2005:

But as Steve McIntyre shows us, this graph from “Hanno” is just another variation of Mann’s discredited Hockey Stick based on questionable mathematics, outright errors such as data inversions, and dubious or excluded proxies that may not reflect temperature change at all.
From Climate Audit:
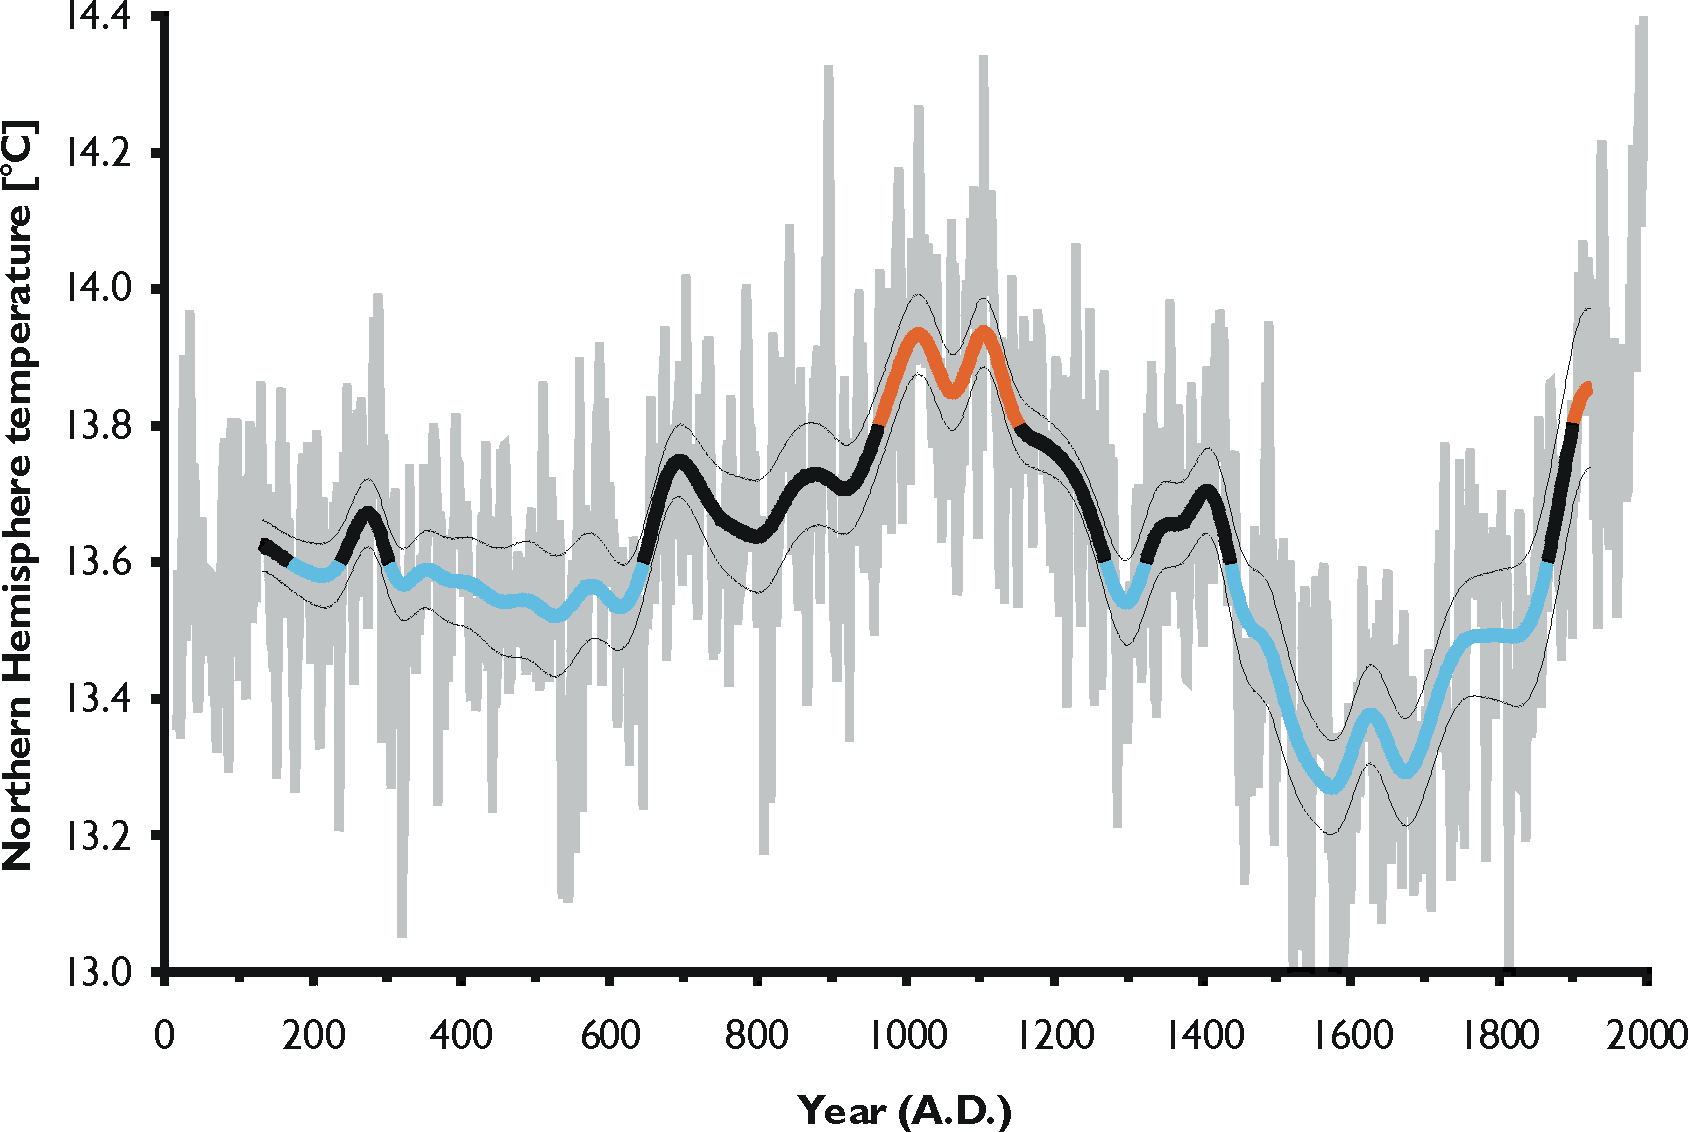
The UNEP CLIMATE CHANGE SCIENCE COMPENDIUM 2009 on page 5 uses the following graph from Wikipedia (not the IPCC Fourth Assessment Report):

CO2 concentration and mean global temperature during the past millennium. CO2 levels (blue line, lefthand axis) are given in parts per million, temperatures (red line, right-hand axis) in degrees Celsius. Source: Hanno 2009 Page 5
Hanno is the pseudonym for a Wikipedia contributor. The graphic itself compares CO2 levels from Mauna Loa and Law Dome ice core to a splice of the HAdCRU temperature index and the Jones and Mann 2004 reconstruction (dominated by Graybill bristlecone chronology).
The latter splice is, of course, the splice that Mann has informed us is never done by responsible climate scientists, further informing us that the allegation that such splices are done is disinformation by fossil fuel companies.
No researchers in this field have ever, to our knowledge, “grafted the thermometer record onto” any reconstrution. It is somewhat disappointing to find this specious claim (which we usually find originating from industry-funded climate disinformation websites) appearing in this forum.
========
I’ve done some additional review and here is what I’ve found about “Hanno”
First here is the Wikipedia source for the image:
http://commons.wikimedia.org/wiki/File:CO2-Temp.png
The following 4 pages on Wikimedia Commons link to this file. UNEP likely got it from the first page during a Google search.
UPDATE: From a Climate Audit commenter “Feedback”: Hanno is also the author of a non-hockey stick graph that can be found in the Norwegian Wikipedia article about the Migration Period (Norwegian: Folkevandringstiden) that shows a more Lamb-like relationship between the MWP and the current warm period:
Source is said to be:
Source: graph drawn by Hanno using data published by A. Moberg, D.M. Sonechkin, K. Holmgren, N.M. Datsenko, W. Karlén, and S.-E. Lauritzen (2005, Highly variable Northern Hemisphere temperatures reconstructed from low- and high-resolution proxy data. Nature (London), 433, 613–617). Temperatures for the last three decades of the 20th Century were taken from P.D. Jones, D.E. Parker, T.J. Osborn & K.R. Briffa (2005, Global and hemispheric temperature anomalies – land and marine instrumental records. In Trends: A Compendium of Data on Global Change. Carbon Dioxide Information Analysis Center, Oak Ridge National Laboratory, U.S.
http://no.wikipedia.org/wiki/Fil:NH_temperature_2ka.png
So apparently “Hanno” contradicts himself with his own set of artwork.
UPDATE2: The Wiki “Hanno” user page is interesting. Thanks to commenter “Dr. Spock”.
Icarus:
“The last glaciation is thought to have resulted from a forcing of around 7 W/m2 (causing about a 5°C change in global temperature), but that includes long-term feedbacks from ice sheets, vegetation changes etc. – the actual change in solar irradiance was maybe half that, or a 2% change in solar forcing.”
These figures don’t seem right to me. Indeed, they seem complete nonsense. My understanding is that the last glaciation was accompanied by a drop of insolation of about 60 Watt/Meter squared.
Can you please give a reference for your figure of 7 watt/meter squared?
I just love the way they say “Hanno 2009” as if the graph comes from a legitimate publication. Too bad Hanno’s user handle wasn’t something like “racoon37”
Seeing how we seem to have on-board at the moment a ‘live’ proponent of AGW, I wonder, what would our [presumably young] scribe proscribe or prescribe in the way of applying “The Precautionary Principle” SHOULD global cooling be indicated in the instrumental record to be underway, in say, another 10 years –
a) Campaign for an INCrease in the use of CO2 based fuels (thereby REVERSING the cooling)
b) Continue a push for a DECrease in the use of CO2 based fuels (thereby HASTENING the cooling trend, leading to potential crop failure et al)
c) Do nothing.
.
.
.
Icarus:
“It seems to me that at the moment at least, the ‘grasping, selfish, greedy elite’ are trying very hard to carry on with ‘business as usual’ and not spend anything at all on mitigation.”
Who are these ‘grasping, selfish, greedy elite?’
Do you mean Goldman Sachs who are actively lobbying Congress on a cap & trade mechanism to they can pocket billions running the trading markets?
Do you mean General Electric who is lobbying for Waxman Markey so that consumers would be forced into buying expensive GE products?
Do you mean General Motors who are taking tax dollars to manufacture so called “green autos”?
Do you mean the likes of Duke energy, Dow chemicals, Caterpillar, Deere, who are actively lobbying congress to pass Waxman Markey for no obvious gain?
Do you mean Al Gore’s company that trades emission trading certificates in London?
I’m not trying to score debating points here, I just want to know which companies you have in mind and why?
thechuckr (05:05:52) : If Icarus is so sure about CO2 causing positive feedback through increased atmospheric water vapor, perhaps he can expalin why we continue to have an equable climate even though past CO2 levels were as much as 100 times greater than today. What happened to the positive feedback back then?
I’ve never heard of it being anywhere near “100 times greater than today”. Cite, please? Certainly atmospheric CO2 has been several times higher than today at various times in the distant past (millions of years ago) and those periods correspond to a warm, ice-free Earth, very different from today’s climate – e.g:
http://www.sciencedirect.com/science?_ob=ArticleURL&_udi=B6V66-4K2SKCB-1&_user=10&_rdoc=1&_fmt=&_orig=search&_sort=d&_docanchor=&view=c&_acct=C000050221&_version=1&_urlVersion=0&_userid=10&md5=d55e961687e6b6641a794af56bd07707
So if the Earth is warm when CO2 is high, and cooler when CO2 is low, what exactly are you disputing? You have to remember that any increase in the greenhouse effect is going to result in a new equilibrium – i.e. the Earth warms up until it is once again radiating away as much heat as it is receiving. That is a long process (hundreds to thousands of years) and it is modified by feedbacks. If there is a net positive feedback then the equilibrium global temperature will be higher than it would otherwise be, from the effect of the greenhouse gas alone. Just because there is a net positive feedback, that doesn’t mean there will be never-ending warming – it just means that the final equilibrium reached will be higher.
Icarus:
“increasing atmospheric CO2 causes warming which in turn causes an increase in atmospheric water vapour (warmer oceans cause more evaporation and a warmer atmosphere holds more water), hence there is a positive feedback.”
What you describe is an unstable system. The cause of the intial warming in such a system, wheather it is co2 or solar, is immaterial, once started it will continue until some other factor intervenes. Where does it end ? It ends when the atmosphere saturates (clouds) and the water precipitates out (rain). What Miskolczi indicates is that we already have a runaway water vapor ‘greenhouse’. The addition of co2 just alters the distribution of greenhouse gases slightly. The system is completely dominated by water vapor. You might look up the changes over time of the water vapor at various altitudes. It has been decreasing as Miskolczi predicts.
Icarus: “There may very well be negative feedback mechanisms but that doesn’t mean there is a net negative feedback. For example, a warmer atmosphere and warmer ocean inevitably means an increase in atmospheric water vapour…”.
Without empirical proof you can‘t say H2O “inevitably” has to be a (strong dominating) positive feedback as the climate models suggest. It’s something more complicated. E.g. most GCMs (as well as proxy data) suggest that there will be increased rain in a warmer world. More rain may be a negative feedback on humidity so we got a very small positive H2O feedback. Clouds change in response to humidity and heat are other factors we don‘t know much about. Measurement in the troposphere shows water vapor decrease when temperatures increases. (Miskolczi’s theory seems to be very interesting.) Some satellite data however says H2O increases. Anyway we can’t for sure say H2O increases, and a strong positive feedback isn’t indicated in the responses from volcanoes and changes in clouds [2] (btw, the Douglass paper you linked suggests negative feedback from volcanoes).
Icarus: “Let’s suppose that there is in fact a net negative feedback from forcings. In that case, the effect of the ~11-year solar cycle should be less than that predicted by straightforward radiative equilibrium calculations. This paper … The authors suggest that the effect of the solar cycle is actually twice as large as would be expected, which they attribute to net positive feedback”.
Douglass et al looks at changes in irradiance. The solar cycle is an exception to other examples, such as volcanoes [1] and clouds [2], with contradicting feedback result. So is a supposed positive feedback something else? Changes in cloud cover strongly co-vary with CGR in the 11 year solar cycle [3]. Also Svensmark’s latest study shows in a full-scale atmospheric experiment that Forbush decreases strongly affect clouds [4], so we got a mechanism, where cloud is the driver, that explains the solar cycle exception.
A paper (besides Douglass et al) recently is Meehl et al 2009 [5], suggesting positive feedback from evaporation in cloud free East Pacific, as well as increasing ozone concentration (a greenhouse gas) in the upper troposphere. I don’t claim this isn’t real positive feedback components, but the counter argument is still valid: Response from other impacts suggests a total negative feedback. (Meehl et al don’t measure low level cloud coverage, or care about [2] and [3].)
Icarus: “Also, if you’re arguing that the Earth’s climate is very stable due to negative feedback mechanisms then it’s difficult to see how comparatively small changes in solar irradiance (Milankovitch cycles) have made such large changes in palaeoclimate – i.e. ice ages and interglacials”.
I agree that positive feedback should control large fluctuations in temperature during ice ages. In comparison with stable interglaciers ice ages are more volatile, and several degrees cooler temperatures suggests positive feedback. The ice reflecting sunlight should be a strong positive feedback. (Since Earth the last millions of years hasn’t plunge into a snowball Earth I guess that boundaries where negative feedback becomes as important as this positive feedback stop this.)
Also there’s no data that suggesting total positive feedback from CO2 some millions of years ago, with increasing temperatures of several degrees (in the by then normally slightly warmer ice free world).
[1] E.g. Barrett Bellamy at http://barrettbellamyclimate.com/page25.htm
[2] Palle et al 2004, “The Earthshine Project:…” http://solar.njit.edu/preprints/palle1266.pdf
[3] Palle/Butler/O’Brian 2004: http://www.arm.ac.uk/preprints/433.pdf
[4] Science Centric: “Cosmic meddling with the clouds by seven-day magic”
http://www.sciencecentric.com/news/article.php?q=09080111-cosmic-meddling-with-the-clouds-by-seven-day-magic
[5] http://wattsupwiththat.com/2009/08/27/ncar-spots-the-transistor-effect-small-solar-activity-fluctuations-amplify-to-larger-climate-influences/
tty (05:18:42) : For your information climate has changed a quite a bit during those 10,000 (actually 11,700) years since the last ice age ended.
By what measure has the global climate ‘changed quite a bit’ in the last 10,000 years? All the evidence shows just the opposite –
http://earthobservatory.nasa.gov/Features/Paleoclimatology_IceCores/
Icarus (03:57:19) :
There is no mechanism by which (for example) increasing atmospheric CO2 by 40%, as we have done, causes just the right amount of water vapour to drop out of the atmosphere to result in no change in the greenhouse effect. Indeed, the opposite is true – increasing atmospheric CO2 causes warming which in turn causes an increase in atmospheric water vapour (warmer oceans cause more evaporation and a warmer atmosphere holds more water), hence there is a positive feedback.
So, the argument is clearly nonsense.
—-
Er, uhm, no. Well, actually, yes.
Yes, we can prove your conclusion “So, the argument is clearly nonsense” by examining the evidence.
900 years ago, the earth was as warm (or warmer) than it is now. And it cooled off, dropping well below today’s temperatures. Clearly there was NO positive water vapor feedback mechanism.
70 years ago, the earth was as warm (or warmer) than it is now. And it cooled off, dropping well below today’s temperatures. Clearly there was NO positive water vapor feedback mechanism.
10 years ago, the earth was as warm (or warmer) than it is now. And it cooled off, dropping down to today’s temperatures. Clearly there was NO positive water vapor feedback mechanism.
—
Now let us examine the relationship between changing atmospheric CO2 levels and global temperatures over the past 120 years:
From 1890-1940 CO2 was constant, and temperatures rose.
From 1940-1973 CO2 was increasing, and temperatures fell.
From 1973-1998 CO2 was increasing, and temperatures rose.
From 1998-2009 CO2 was increasing, and temperatures fell.
So, the argument is clearly nonsense.
******
Icarus (19:06:17) :
It seems to me that at the moment at least, the ‘grasping, selfish, greedy elite’ are trying very hard to carry on with ‘business as usual’ and not spend anything at all on mitigation…
******
Do you have any idea of the money, effort and time that has been spent in the last 30 yrs in developed nations, and continues at increasing rates, for environmental “mitigation”? The cost-of-living has increased considerably in those nations due to “mitigation”. That’s been “business as usual” for decades.
What dimension do you live in?
In Icarus (03:57:19)
You said “There is no mechanism by which (for example) increasing atmospheric CO2 by 40%, as we have done, causes just the right amount of water vapour to drop out of the atmosphere to result in no change in the greenhouse effect”.
But that negates your prior claim of 3.7 w/m2 of forcing for CO2 doubling. For that claim to be true, there can be no increase in water vapor since the water vapor forcing will reduce the CO2 forcing to about half of your number.
For “Hanno 2009” they used his account name. For “Rohde 2009” they used his real name instead of the more consistent “Dragons flight 2009”.
Icarus (06:35:19)
The reference you cite is a strange one in relation to current CO2 ppm (take the ~385ppm level on the graph about which this thread is meandering) since the abstract states:
“For periods with sufficient CO2 coverage, all cool events are associated with CO2 levels below 1000 ppm. A CO2 threshold of below 500 ppm is suggested for the initiation of widespread, continental glaciations, although this threshold was likely higher during the Paleozoic due to a lower solar luminosity at that time.”
For modelled historic CO2 levels see Phanerozoic Carbon Dioxide graph as an example:
http://upload.wikimedia.org/wikipedia/commons/7/76/Phanerozoic_Carbon_Dioxide.png
The timescale is from right to left (present day) . And yes I did just reference a diagram on Wikipedia. For more academic detail with RCO2 not ppm see:
http://www.geocraft.com/WVFossils/Reference_Docs/Geocarb_III-Berner.pdf
(“Results are expressed as RCO2 which is defined as the ratio of mass of CO2 in the atmosphere at time t divided by the mass at present, and the results are compared to a standard run, where best estimates of the various input parameters are used. To convert RCO2 to CO2 concentration, because of
appreciable errors inherent in this kind of modeling, a rough value of 300 ppm can be used to represent “the present.””)
The Geocarb III model peaks about 520Mya with levels 26x current. Plenty of caveats for the unwary but still it’s interesting.
hmmm… maybe Icarus should change his anonym to “pinata”
Icarus (03:57:19) :
The nonsense is your reply that was found on some rebuttal web site.
Take up the challenge of doing the math instead of repeating troll rebuttals.
In trying to make a point about this issue elsewhere, I went to a random page in the document and picked a random paragraph. The first full paragraph on page 15 is
“Documentation of this trend has been building for the last century and studies of glaciers and ice caps are becoming more sophisticated with new satellite-based observation technologies and attempts to distinguish glacier responses to multiple variables (WGMS 2008a, WGMS 2008b, Braithwaite et al. 2009).”
The intent was to show that the bibliographic citations in the main body of the document are connected to bibliographic references in the nine page reference section. The only problem: Braithwaite et al. 2009 isn’t listed in the references.
I did not perform any other cross checks. The first and only cross check that I did perform showed a discrepancy. So, how many other citations in the main body are not listed in the references section? And how many of those nine pages of references are never cited in the document?
thechuckr (05:05:52) : If Icarus is so sure about CO2 causing positive feedback through increased atmospheric water vapor…
thechuckr,
I’d like to know which troll-based rebuttal Icarus will give to Roy Spencer’s work in this 2 part YouTube series on H2O and negative feedback.
Icarus is flying too high toward the heat of real data with his wax troll wings which are melting leaving with only a hard fall down in his future.
Why the IPCC models are wrong
Icarus (03:57:19) :
Troll,
The ad hoc assumption is made by the IPCC.
Miskolczi’s math still has not been found wrong.
If you have found it wrong then lay out your case. Leave it open to the entire math and science world as Miskolczi has done.
Also, send your work to Miskolczi. See what his reply is.
Submit your work to the public. Let’s see what we find.
David (13:54:34) :
In trying to make a point about this issue elsewhere, I went to a random page in the document and picked a random paragraph. ……. I did not perform any other cross checks. The first and only cross check that I did perform showed a discrepancy. So, how many other citations in the main body are not listed in the references section? And how many of those nine pages of references are never cited in the document?
—-
Please repeat this amazing observation as a comment at climateaudit.com; I think they will find it “interesting” ….
Vincent (05:19:16) : Icarus
This water vapour feedback argument is quite strange on three counts. The IPCC say that if the temperature increases by about 1.2C (the acknowledged temperature sensitivity to doubling CO2 without feedbacks) then the warming will lead to increased water vapour that will drive temperatures up by 3.5C. However, the first problem with this is that the global average temperature varies by 4C during a year. Could you explain why this does not invoke the water vapour feedback as described?
I haven’t read that the global average temperature varies by 4°C in the course of a year – can you find a reference for that? Regardless of the value though, it seems to me that any such temperature range would necessarily already include the water vapour feedback, since it responds on a very short timescale (a few days).
The second point about warmer air holding higher absolute amounts of water vapour is true as far as the train of thought goes, but it does not follow this to its conclusion. It ignores the fact that this water vapour eventually comes out as precipitation as warm fronts rise over cold air masses. This is basic meteorology. If this was not the case then there would indeed be a positive feedback that forces water to evapourate in ever higher absolute amounts, causing ever higher temperatures until the whole of the earth’s oceans will end up suspended above our heads. Such a thing has never been observed.
It’s precisely because of its short residence time in the atmosphere (a few days) that water vapour is a feedback, not a forcing, and therefore cannot have this ‘runaway’ effect that you suggest. On its own, any increase in water vapour in the atmosphere would have a negligible effect on global temperature because it would (as you say) precipitate out in at most a few days. A long-term forcing such as an increase in solar irradiance or long-lived greenhouse gases is necessary to support a long term change in water vapour in the atmosphere, with its resultant increase in greenhouse effect (positive feedback) added to the primary forcing.
Thirdly, if CO2 has such a violent affect on climate, then can you explain why CO2 levels averaged around 2000ppm during the Mesozoic without the catastrophic effects you imply should happen? This is not 1 but 3 doublings. By your numbers this should have led to a temperature increase of 10C, utterly catastrophic!
From what I’ve read, the Mesozoic was indeed up to ~10°C warmer, so this fits quite well – especially as the solar flux was at least 1% smaller than it is now (although I think your average CO2 of 2000ppmv is an exaggeration – I’ve seen quoted a *peak* of 1,130 ppmv). If the sun was weaker, the CO2 concentration was subtantially larger, and the global temperature was substantially higher, doesn’t that support the concern that anthropogenic increases in CO2 will cause climate change well outside the normal range of the last 10,000 years or so?
http://www.nature.com/ngeo/journal/v1/n1/full/ngeo.2007.29.html
mr.artday (21:25:09) : Well, Icarus, with the planet cooling while CO2 rises you are at least in less danger of the sun melting your feather wax and causing your gross weight to exceed your coefficient of lift.
The planet is actually warming at about 0.2°C per decade and has been doing so for several decades. What do you attribute this to, if not primarily the anthropogenic increase in greenhouse gases?
We would *expect* this substantial rise in greenhouse gases to cause a corresponding rise in global temperature (that’s why they’re called ‘greenhouse gases’, after all), so you have to be arguing that not only is this warming completely counteracted by some mysterious phenomenon, but there is also *another* mysterious phenomenon which just by sheer coincidence is causing this 0.2°C/decade rise in global average temperature at the very same time as we would expect a rise in temperature caused by the greenhouse gases.
Seems a bit of a stretch to me, but I’d be interested to hear the details of your argument.
auto249243 (06:46:15) : Icarus:
“increasing atmospheric CO2 causes warming which in turn causes an increase in atmospheric water vapour (warmer oceans cause more evaporation and a warmer atmosphere holds more water), hence there is a positive feedback.”
What you describe is an unstable system. The cause of the intial warming in such a system, wheather it is co2 or solar, is immaterial, once started it will continue until some other factor intervenes. Where does it end ? It ends when the atmosphere saturates (clouds) and the water precipitates out (rain). What Miskolczi indicates is that we already have a runaway water vapor ‘greenhouse’. The addition of co2 just alters the distribution of greenhouse gases slightly. The system is completely dominated by water vapor.
My understanding is that water vapour is a feedback, not a forcing, due to its very short residence in the atmosphere. While it’s there, certainly it is the single largest absorber of long wave radiation in the atmosphere, but it’s only there because other much longer-lived greenhouse gases create the right conditions for it to be there, warming the oceans and atmosphere so that evaporation can occur. The system is not ‘completely dominated by water vapour’ – far from it.
You’re right when you say “The cause of the intial warming in such a system, whether it is co2 or solar, is immaterial” – that’s the whole point. Turning up the CO2 isn’t much different from turning up the sun, and we all agree that turning up the sun would make the planet warm up.
You might look up the changes over time of the water vapor at various altitudes. It has been decreasing as Miskolczi predicts
One obvious result of AGW is that, in the short term, temperature in the lower atmosphere rises while temperature in the upper atmosphere falls (because less long wave radiation is reaching the upper atmosphere – instead it’s down here warming up the planet). Colder air in the upper atmosphere of course holds less water vapour, so this result actually confirms AGW.
Luke Warmer (10:11:12) : Icarus (06:35:19)
The reference you cite is a strange one in relation to current CO2 ppm (take the ~385ppm level on the graph about which this thread is meandering) since the abstract states:
“For periods with sufficient CO2 coverage, all cool events are associated with CO2 levels below 1000 ppm. A CO2 threshold of below 500 ppm is suggested for the initiation of widespread, continental glaciations, although this threshold was likely higher during the Paleozoic due to a lower solar luminosity at that time.”
Doesn’t this tie in rather well with Hansen’s view that anything above ~450ppm means an ice-free planet?
http://pubs.giss.nasa.gov/docs/2008/2008_Hansen_etal.pdf
The planet is actually warming at about 0.2°C per decade and has been doing so for several decades. What do you attribute this to, if not primarily the anthropogenic increase in greenhouse gases?
Multidecadal oceanic and atmospheric cycles.
The current round of warming began in the late 1970s. From that time until 2001, a half dozen or more of the primary oceanic-atmospheric cycles went from cool to warm phase, one by one, on schedule. Then temperatures leveled out for several years. In 2007, the PDO entered a negative phase and temperatures began to drop.
Yes, CO2 may have an underlying thumbprint, but the larger fluctuation is similar to the 1920s and ’30s (CO2 “took off” after WWII), which tracks the PDO and AMO.
If temperatures increase this century as much as last, or even at twice the rate, we are in no immediate danger.
The IPCC mainstream projection has us heating at 4 to 5 times the rate of the 20th century, and so far there hasn’t been any net warming from 2001. This is based on positive feedback loop projections which have been called into serious question. If CO2 forcing alone occurs, we will likely heat slightly, but not at the rate the IPCC projects.
So you’re concerned, then, about the irrelevance of the so-called “hockey stick” and why it’s still prominently used. Concerned about the withholding of data and methods by those prominent in climate science. You’re concerned about the lack of independent replication of paleoclimate reconstructions. You’re concerned about the lack of validation of tree rings as thermometers, or lake varve sediments as thermometers, or any other proxy as thermometers. Right?