
We’ve been lectured time and again about the importance of having climate science work come from peer reviewed papers, saying that the work of dedicated amateurs has no place in climate science unless the work rises to publication/peer review level.
Yet that doesn’t seem to apply for United Nations science publications. Of course just one look at the front cover at left tells you its more about selling than science.
The cover image pulls at heartstrings, making the world appear as if it is running out of time before turning entirely into an inhospitable desert. That is an extreme view in my opinion.
Steve McIntyre’s blog discovery of UNEP’s folly bears repeating, because it shows the sort of sloppy science that is going into “official” publications.
This is much like the NCDC CCSP report just over a year ago where they used a photoshopped image of a “flooded” house.

In this case, the United Nations simply grabbed an image from Wikipedia that supported the view they wanted to sell. The problem with the graph in the upper right of page 5 of the UNEP report is that it itself has not been peer reviewed nor has it originated from a peer reviewed publication, having its inception at Wikipedia.
And then there’s the problem of “Hanno” who is an anonymous contributor. This is simply his/her artwork and interpretation. We don’t have any idea who “Hanno” is, nor apparently does UNEP.
Yet UNEP cites the graph as if it was a published and peer reviewed work as “Hanno 2009”. Yet UNEP doesn’t even get the year right as the graph was created in 2005:

But as Steve McIntyre shows us, this graph from “Hanno” is just another variation of Mann’s discredited Hockey Stick based on questionable mathematics, outright errors such as data inversions, and dubious or excluded proxies that may not reflect temperature change at all.
From Climate Audit:
The UNEP CLIMATE CHANGE SCIENCE COMPENDIUM 2009 on page 5 uses the following graph from Wikipedia (not the IPCC Fourth Assessment Report):

CO2 concentration and mean global temperature during the past millennium. CO2 levels (blue line, lefthand axis) are given in parts per million, temperatures (red line, right-hand axis) in degrees Celsius. Source: Hanno 2009 Page 5
Hanno is the pseudonym for a Wikipedia contributor. The graphic itself compares CO2 levels from Mauna Loa and Law Dome ice core to a splice of the HAdCRU temperature index and the Jones and Mann 2004 reconstruction (dominated by Graybill bristlecone chronology).
The latter splice is, of course, the splice that Mann has informed us is never done by responsible climate scientists, further informing us that the allegation that such splices are done is disinformation by fossil fuel companies.
No researchers in this field have ever, to our knowledge, “grafted the thermometer record onto” any reconstrution. It is somewhat disappointing to find this specious claim (which we usually find originating from industry-funded climate disinformation websites) appearing in this forum.
========
I’ve done some additional review and here is what I’ve found about “Hanno”
First here is the Wikipedia source for the image:
http://commons.wikimedia.org/wiki/File:CO2-Temp.png
The following 4 pages on Wikimedia Commons link to this file. UNEP likely got it from the first page during a Google search.
UPDATE: From a Climate Audit commenter “Feedback”: Hanno is also the author of a non-hockey stick graph that can be found in the Norwegian Wikipedia article about the Migration Period (Norwegian: Folkevandringstiden) that shows a more Lamb-like relationship between the MWP and the current warm period:
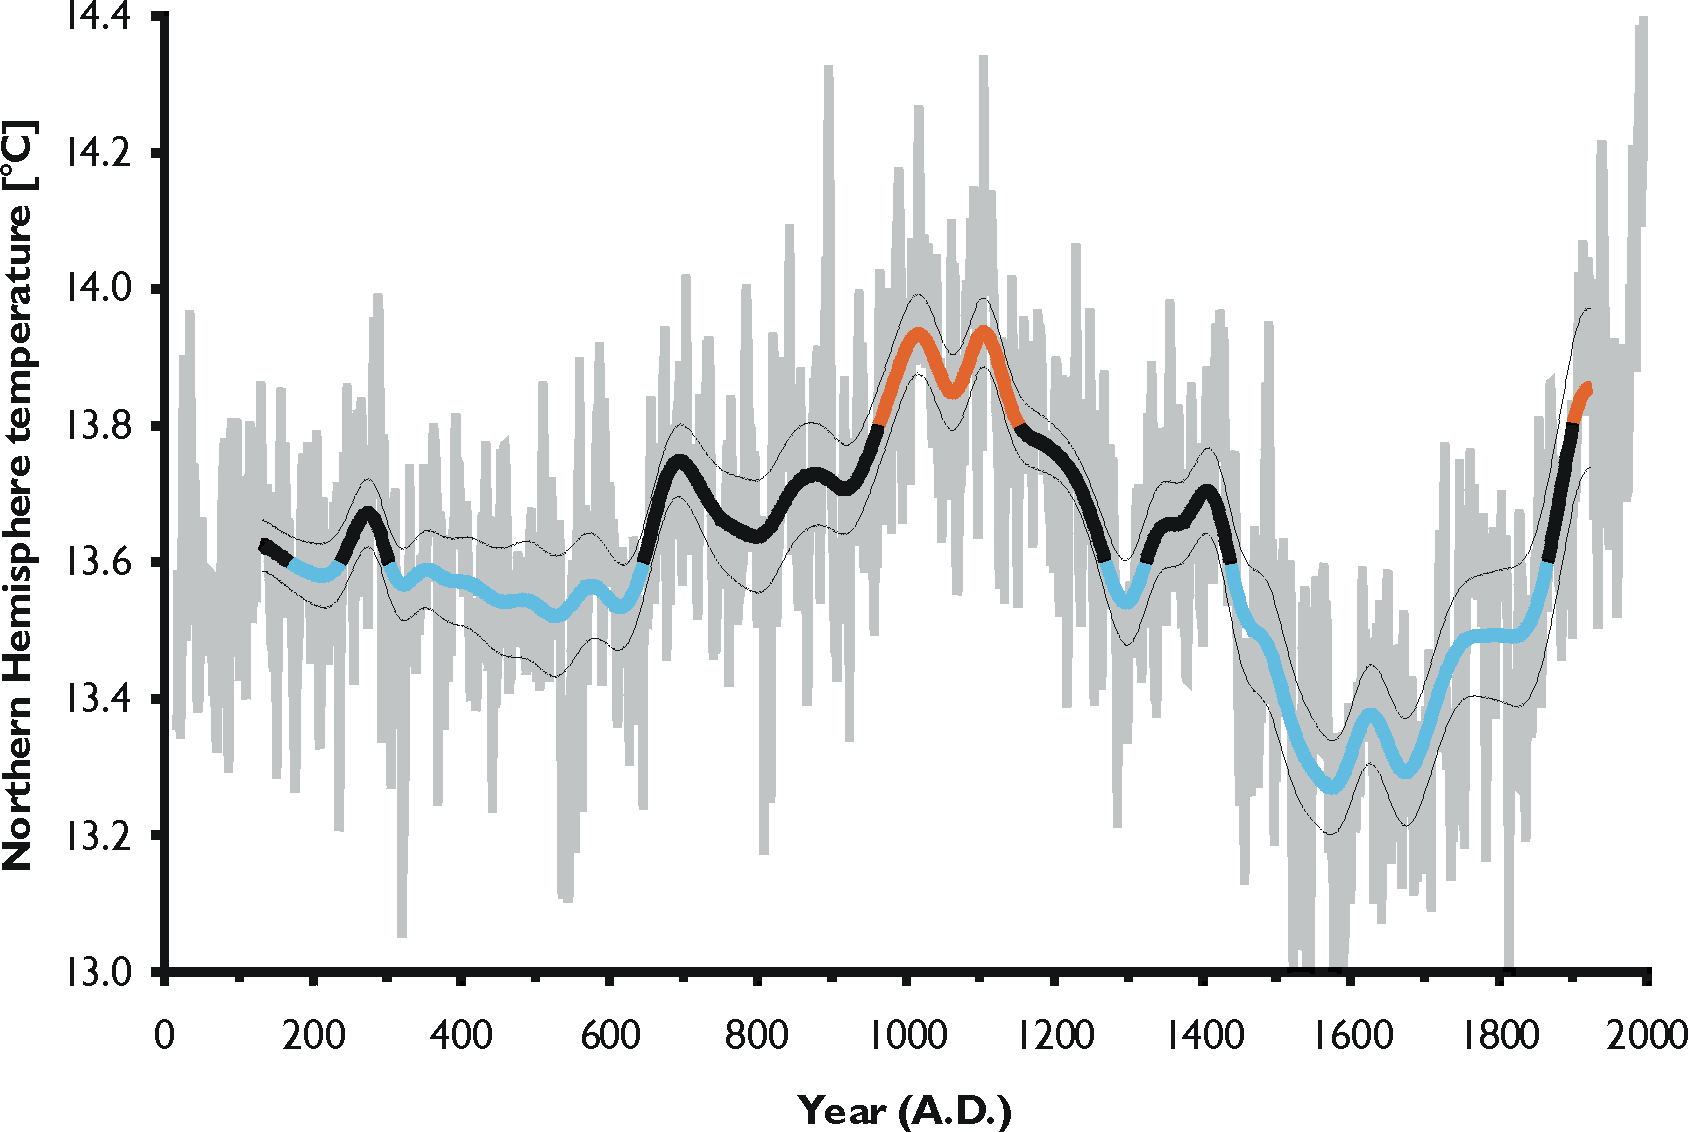
Source is said to be:
Source: graph drawn by Hanno using data published by A. Moberg, D.M. Sonechkin, K. Holmgren, N.M. Datsenko, W. Karlén, and S.-E. Lauritzen (2005, Highly variable Northern Hemisphere temperatures reconstructed from low- and high-resolution proxy data. Nature (London), 433, 613–617). Temperatures for the last three decades of the 20th Century were taken from P.D. Jones, D.E. Parker, T.J. Osborn & K.R. Briffa (2005, Global and hemispheric temperature anomalies – land and marine instrumental records. In Trends: A Compendium of Data on Global Change. Carbon Dioxide Information Analysis Center, Oak Ridge National Laboratory, U.S.
http://no.wikipedia.org/wiki/Fil:NH_temperature_2ka.png
So apparently “Hanno” contradicts himself with his own set of artwork.
UPDATE2: The Wiki “Hanno” user page is interesting. Thanks to commenter “Dr. Spock”.
evanmjones (16:58:42) : [The planet is actually warming at about 0.2°C per decade and has been doing so for several decades. What do you attribute this to, if not primarily the anthropogenic increase in greenhouse gases?]
Multidecadal oceanic and atmospheric cycles.
Then how do you account for this? –
http://www.ipcc.ch/graphics/syr/fig2-5.jpg
Icarus
You still have not provided proof for your claim about Miskolczi.
How many times will I be asking for it? For how many years?
“Icarus (16:44:26) :
My understanding is that water vapour is a feedback, not a forcing, due to its very short residence in the atmosphere. While it’s there, certainly it is the single largest absorber of long wave radiation in the atmosphere, but it’s only there because other much longer-lived greenhouse gases create the right conditions for it to be there, warming the oceans and atmosphere so that evaporation can occur. The system is not ‘completely dominated by water vapour’ – far from it.”
There is a complex energy transport from the surface to space through the atmosphere. Considering the there is an order of magnitude more water vapor in the air than co2 and a broader spectrum of absorbtion, I think it is fair to say that water vapor is dominant through both radiation and latent heat/ convection . The ‘forcing/feedback’ is misapplied modeling. See some of Roy Spencer’s writing.
“Icarus:
…it’s only there because other much longer-lived greenhouse gases create the right conditions for it to be there, warming the oceans and atmosphere so that evaporation can occur.”
In other words, without other GHG we would not have water vapor/ evaporation ? Say what ! ? I think you might want completely reconsider that statement.
“Icarus:
You’re right when you say “The cause of the intial warming in such a system, whether it is co2 or solar, is immaterial” – that’s the whole point. Turning up the CO2 isn’t much different from turning up the sun, and we all agree that turning up the sun would make the planet warm up.”
Also albedo changes, land use, snow/ice, cloud cover, ect. The relative numbers are what is in contention.
‘You might look up the changes over time of the water vapor at various altitudes. It has been decreasing as Miskolczi predicts’
“Icarus:
One obvious result of AGW is that, in the short term, temperature in the lower atmosphere rises while temperature in the upper atmosphere falls (because less long wave radiation is reaching the upper atmosphere – instead it’s down here warming up the planet). Colder air in the upper atmosphere of course holds less water vapour, so this result actually confirms AGW.”
I did not say any thing about temperature. You are assuming the relative humidity stays constant.
On the subject of radiation; http://lasersparkpluginc.com/uploads/CO2_Absorption_Data.pdf
Smokey (15:37:27) : …can we agree that CO2 does not cause runaway global warming?
Two different issues here:
1: Whether CO2 causes warming at all;
2: Whether the right conditions exist for ‘runaway’ warming.
If there are ‘tipping points’ then an initial relatively small amount of warming can be magnified by positive feedback mechanisms (albedo, methane deposits etc.) and the cause of the initial warming is irrelevant. Therefore you only need to decide whether CO2 can cause warming. Since it is a greenhouse gas, the evidence suggests that it can.
…That chart shows that elevated CO2 levels have been many thousands of ppmv, for over a hundred million years at a time. During that time the planet both warmed and cooled.
To imply that you can take two data points 100 million years apart and draw a straight line between them, and just assume that represents reality, is clearly absurd. The IPCC’s Figure 6.3 has many more intervening data points and shows a strong correlation between atmospheric CO2 and global temperature. Regardless of that, of course we know that there are numerous factors affecting global climate other than CO2. This is not news, and it certainly doesn’t represent any kind of argument against AGW.
And to find evidence of a ‘cooler sun’ you will have to go back billions of years, not millions.
Cite, please? This disagrees:
http://www.pubmedcentral.nih.gov/articlerender.fcgi?artid=1868609&rendertype=figure&id=fig2
“My understanding is that atmospheric CO2 is closely correlated with global temperature for many millions of years into the past… It remains a fact that higher temperatures are correlated with higher CO2, and lower temperatures are correlated with lower CO2.”
Your understanding is wrong. The only correlation between temperature and CO2 is when rising CO2 follows rising temperature. There is no cause and effect between rising CO2 and subsequent rising temperature.
So there *is* a correlation, which was what I said, and what this data shows:
http://www.ipcc.ch/graphics/ar4-wg1/jpg/fig-6-3.jpg
If you’re going to argue that there is ‘no cause and effect’ then you are of course arguing that CO2 is not a greenhouse gas. Care to support that claim?
Finally, the R² correlation between recent increases in CO2 and the temperature is so low that it is indistinguishable from noise
Oh dear. Are you *seriously* claiming to disprove a correlation between atmospheric CO2 and global temperature based on 10 years of data – a shorter period even than one solar cycle? You seem like a reasonably intelligent person, and this is just lame.
Icarus,
There is no cause and effect relationship between rises in CO2 and subsequent increased temperature: click.
You say that ten years is not sufficient to show a trend. Would 47 years suffice? The putative link between the “greenhouse” gas CO2 and warming has been falsified: click. The atmosphere is not a greenhouse. Unless you can show me a working greenhouse that is open to the sky, with no glass. But then, it wouldn’t be a greenhouse, would it? It would be, like, an open field.
Your UN/IPCC chart shows a cause and effect between a rising global temperature and rising carbon dioxide levels; that’s exactly what I stated above. But there is no cause and effect between rising CO2 and subsequent rising temperatures. That’s why CO2=AGW fails.
Finally, your assertion that I took only two points and drew a line between them is false. The question really is: was your statement delibearately false? Or did you just make a false assumption? I provided this chart: click. Does that look like two points with a line drawn between them? [click in the image to expand. Study it for a while. Learn.]
I notice that you also don’t answer the questions put to you by others. I suspect the reason is because you have no adequate response. The IPCC also has no adequate response to its failed prediction: click. Like you, they are wrong, and will not admit it. Just like James Hansen is wrong: click.
You’re in over your head here, Icarus. You should spend some time reading the WUWT archives, to try and get up to speed. The points you raise here have been raised and debunked previously. The UN is wrong. Skeptics’ questions have never been adequately answered by those pushing the repeatedly falsified CO2=AGW conjecture.
It’s our cross to bear that we must teach every new alarmist who shows up here that if CO2 has any empirically measurable effect at all, it is so small that it is indistinguishable from noise, and therefore can be disregarded for all practical purposes. So relax, CO2 isn’t gonna getcha.
Icarus
You continue to not provide proof for your claim about Miskolczi.
Since you have not provided proof should I assume you do not have backing for your claim?
Should I assume that what you said about it is something you found on a blog somewhere? Or in Wikipedia?
Is your claim something you say just to reject the science?
Is your claim about the work of Ferenc Miskolczi something you never did look in to for yourself?
Should I assume you are a troll with no real appreciation and respect for the data that is the real science of climate change?
Was Ferenc Miskolczi’s theory peer-reviewed?
Smokey (18:16:51) : Icarus,
There is no cause and effect relationship between rises in CO2 and subsequent increased temperature:
Then how do you account for this? –
http://www.ipcc.ch/graphics/syr/fig2-5.jpg
You say that ten years is not sufficient to show a trend. Would 47 years suffice? The putative link between the “greenhouse” gas CO2 and warming has been falsified: click.
That’s a fascinating graph. Can you explain to me what it shows, and its significance to our discussion? I’m not asking you to write a book – just a sentence or two. Cheers.
Your UN/IPCC chart shows a cause and effect between a rising global temperature and rising carbon dioxide levels; that’s exactly what I stated above. But there is no cause and effect between rising CO2 and subsequent rising temperatures. That’s why CO2=AGW fails.
At least we agree that there is a strong correlation – i.e. that higher temperatures are correlated with higher CO2, and lower temperatures are correlated with lower CO2. That’s a start.
Finally, your assertion that I took only two points and drew a line between them is false. The question really is: was your statement delibearately false? Or did you just make a false assumption? I provided this chart: click. Does that look like two points with a line drawn between them? [click in the image to expand. Study it for a while. Learn.]
I think you misunderstood – I wasn’t saying you did anything at all (unless you wrote the paper you linked to). Remember that you said: “That chart shows that elevated CO2 levels have been many thousands of ppmv, for over a hundred million years at a time”. Well, there is only one part of that graph that shows ‘elevated CO2 levels’ of anything resembling thousands of ppmv for a hundred million years – the period between about 200mya and 100mya. Agreed? You can’t possibly believe that taking two data points a hundred million years apart and drawing a straight line between them represents reality, and in fact when you look at a graph with many more data points (as I showed) it’s clear that there were substantial changes in CO2 and temperature between those points, and that those changes show a very clear correlation.
I do understand your point that CO2 rises always follow temperature rises rather than preceding them – we can get more into that later.
I notice that you also don’t answer the questions put to you by others.
I’ve no interest in responding to people who are (unlike yourself) rude and ignorant.
With regard to citing the graph as Hanno 2009, they are probably correct as the standard is to cite the date that the web page was last updated, i.e. 21 July 2009 and the date that the page was accessed. One can easily check this by referring to the list of references and seeing what dates they cite, except that Hanno 2009 does not appear in the references.
Smokey wrote, “The atmosphere is not a greenhouse. Unless you can show me a working greenhouse that is open to the sky, with no glass. But then, it wouldn’t be a greenhouse, would it? It would be, like, an open field.”
No one disputes the atmosphere is a greenhouse itself (it has to be, or we’ll have temperatures of -250F at night), the dispute is if mankind is the cause of any global warming. This can’t be proven to date based on such a small sampling of data (which is the main concern, as the data is quite limited and too narrow).
What I don’t see in these “debates” (they often are shouting matches instead) is how and why 1998 was the hottest year. Folks may not have been reviewing the Sun data enough, but if they did they’d find that that year was the peak year of solar X-Class flares (10 in that year alone). If folks also reviewed even the lay astronomy magazines like Astronomy, they would also have seen how these X-Class flares plow, distort, and “snap” the upper atmosphere way into space (and the funny editorial comment of, “There went the global warming idea”). This activity no doubt has some affect on our atmosphere (and I suspect the true cause the mysterious “ozone hole” that not so ironically not so large today).
The “sin” in all of this climate debate is the a too small sample size; too many jobs and reputations depending on the outcome; and trying to answer a question that we, in our lifetime, may never have an answer as we’re coming out of a 400 year “mini ice age”. It’s a classic “spinning of wheels” and slowing the funding of legitmate research (like finding a new home before the Sun does worse, like swallowing our planet as it goes nova!).
Icarus
You are just another case of stonewalling of data?
No, you’re not.
You are stonewalling your lack of data.
I think your findings absolutely rubbish.
Obviously, you don’t know nothing about the structure of international governance!!!
We can track all the findings from previous documents presented by the real authors in the STTMs meetings that happens every year in different locations. The problem is that there are people who copy these REAL reports without any regards to authorship and past straight in the Wikipedia.
Get informed!
UNEP has a data base – a real serious one – about all the resources used in their reports.
If they want, they could destroy your arguments within seconds…
I wonder what is the interest backing your shameful story: why are you interested in running the reputation of UNEP?
Or are you just trying to grab attention to yourself – an ego case that goes straight against the common/global interest of the wellbeing of LIFE ON EARTH?
Yes, by-the-way, these STTM reports are not just peer reviewed but also reviewed by Party members’ scientific staff. They also must be approved by the UN environmental scientific agency: http://www.unep.org/science/centres/index.asp
then, once the report is approved, it becomes a guide line to policy making
Obviously, if a country (Party) member is against a international policy – which later becomes international law – this country will do anything to destroy the arguments and recommendations of the report.
But, if this country is minority, this means, it is not convincing to other countries, its action will not mean anything: the report will still be valid.
For instance, although the USA administration has done anything to destroy the liability of the Brundtland commission report, which was the basis of the UNEP, UNFCC, SCBD, etc., the Conventions has been signed in 1992 during the Earth Summit, and are still valid, BECAUSE the international scientific community outside the USA still approves and backs the Brundtland.
Someone must be really “arrogant” to think that s(he) knows more than the majority of scientists of the world!
A look at the UNEP report (5 Oct 2009) shows a different graph in place of Hanno on page 5. It is Hansen, et al. Perhaps the scientific community does listen.
amil, were it not for the case of ‘it has happened before’ (errors in science), we might not be discussing these issues; chalk it up to the limits/fallibility of mankind, his corruptable nature, and more recently, monied interests who now see the ‘green’ (old slang term for MONEY as in green backs) of new markets including carbon-credit trading.
.
.
.
@ur momisugly -Jim,
do you like statistics, -Jim? – I do. When I say “majority”, I am saying “more than half of the scientists in the whole World”. Thus, the statistical chances of error is low.
Moreover, who has “monied interests” in destroying arguments and evidences supporting GREEN policies? It is obviously not the poor countries of the world, as they are the ones who are suffering the most with Earth’s ecosystems degradation.
Interesting: The vast majority of scientists of the world have “monied interests” in supporting poor – penniless – populations/countries. Are poor countries “paying” these scientists (and they are a lot, thus it must be a lot of money!)? But they don’t have money… : _Jim, with all respect, your reasoning concerning “monied interests who now see the ‘green’ of new markets including carbon-credit trading” is fallible and illogical.
Nevertheless, there are enormous “monied interests who now see the ‘green'” as an obstacle to endless accumulation of capital, such as the oil industry. And this industry has the capability of paying anything to block the work of the Majority of Scientists of the Planet, and of the UNEP, because they – the most CO2 producers/industries of the entire world – are RICH.
The fact that a same graph was found in the report of United Nations Environment Programme and the Wikipedia may just be a form of synchronicity, that being the experience of events which are causally unrelated, and yet their occurring together carries meaning to the person observing the events.
Some people tend to search for or interpret synchronicity in a way that confirms one’s preconceptions and avoids information and interpretations that contradict prior beliefs. This is defined by the cognitive science as the “confirmation bias”.
In the context of “confirmation bias”, coincidences sometimes lead to explanations that a person or persons intentionally acted and the syncronicity is the evidence these actions. That is the beginning of “conspiracy theories”, this means fringe theories which are used to explain a historical or current event as the result of a secret plot by usually powerful Machiavellian conspirators, such as a “secret team” or “shadow government”, rather than broad social forces and large structures of human collectivities.
We may be watching an example of conspiracy theory happening right now in structure of the conservative belief that the “climate change issue” is a part of a organized plan of the international governance (UN, World Bank, IMF, etc.), and/or developing countries to run the world… or, still, in the opinion that “monied interests who now see the ‘green’ (old slang term for MONEY as in green backs) of new markets including carbon-credit trading.”
Finally, the White Queen says to Alice: “It’s a poor sort of memory that only works backwards” (Through the Looking-Glass by Lewis Carroll)