UPDATE: 9/8/09
The University of Colorado made a serious mistake in the press release that I cited. This press release was issued well before the paper was available, and of course the paper itself was not made available to journalists. It was hidden behind the AAS paywall.
I wrote to the press officer at UC on Friday, he responded Saturday night, on a holiday weekend, to his credit, here is my exchange:
Re: question about press release
From: Gifford H. MillerSent: Saturday, September 05, 2009 8:02 PMTo: Anthony Watts – mobileSubject: Re: question about press releaseIndeed, this is a typo, Anthony. Not sure how it escaped my attention.The sentence should read: “The research team assembled high-resolution records of climate for the past 2,000 years and found that the cooling trend reversed in 20th Century.“I have passed the correction to our PR folks and it should be fixed soonThanks for catching thisGifford Miller
Hello,
I looked at the Kaufman paper press release on EurekAlert as well as here:http://www.colorado.edu/news/r/bff9b4f453f2f9e1aa1e5d1b699d8525.html
In the second paragraph there is this sentence:“The research team assembled high-resolution records of climate for the past 2,000 years and found that the cooling trend reversed in the mid-1990s.”Is this correct? Is this a typo and instead should it say “mid-1900’s ” ?
Thanks for your consideration. Anthony Watts
UC has updated their press release here on 9/7 and was able to persuade EurekAlert to fix it on their website also.
The last sentence of paragraph 2 now reads:
“The research team assembled high-resolution records of climate for the past 2,000 years and found that the cooling trend reversed in the 20th century.”
It was originally stated as:
The research team assembled high-resolution records of climate for the past 2,000 years and found that the cooling trend reversed in the mid-1990s.
I’ve received some criticism for using the press release and acting on it to look for such a change in the 1990’s per the press release. While that criticism would be valid if the press release and the paper were both made available to me at the same time, the fact is they were not.
This method of pushing a scientific paper via press release, ahead of the paper’s actual journal release, and then hiding it behind a paywall is unprofessional and stinks. If the science organization wants to be seen as credible, then they need to make both the press release AND the paper available to journalists at the same time.
This idiotic “press release but no sci paper” policy needs to be changed. I’ll have more on this soon. As it stands, I’ve going to avoid UC press releases until they change the policy and I encourage others to do the same.
– Anthony
==========================
There’s a lot of buzz about regarding the Kaufman et al paper published today in Science which claims a recent reversal on a long term Arctic cooling trend and “found that the cooling trend reversed in the mid-1990s.” In the NOAA internal newsletter I cited yesterday, NOAA claims that the “According to the most recent Arctic Report Card, the Arctic Ocean continues to warm”. OK fair enough, we’ll have a look.
NOAA based this on Hadley’s CRU dataset, which of course Hadley refuses to show any raw data for or methodology despite repeated FOI requests, making verification impossible. (read more here)
 |
| Figure A1. Arctic-wide annual averaged surface air temperature anomalies (60°–90°N) based on land stations north of 60°N relative to the 1961–90 mean. From the CRUTEM 3v dataset, (available online at www.cru.uea.ac.uk/cru/data/temperature/. Note this curve does not include ship observations. |
Note the trend from 1980 to present. Note also that there are few weather stations above 60N and even fewer on the Arctic Ice itself. The data is relatively sparse and interpolation/gridding/averaging is employed to come up with the coverage all the way to 90N. We’ll get back to this.
Let’s first get an understanding of the Kaufman paper. Here’s the abstract. We can’t get a look at the full paper or publish it here yet since it is behind the AAS paywall. If somebody has an external link to it, please advise.
Recent Warming Reverses Long-Term Arctic Cooling
Darrell S. Kaufman,1,* David P. Schneider,2 Nicholas P. McKay,3 Caspar M. Ammann,2 Raymond S. Bradley,4 Keith R. Briffa,5 Gifford H. Miller,6 Bette L. Otto-Bliesner,2 Jonathan T. Overpeck,3 Bo M. Vinther,7 Arctic Lakes 2k Project Members
The temperature history of the first millennium C.E. is sparsely documented, especially in the Arctic. We present a synthesis of decadally resolved proxy temperature records from poleward of 60°N covering the past 2000 years, which indicates that a pervasive cooling in progress 2000 years ago continued through the Middle Ages and into the Little Ice Age. A 2000-year transient climate simulation with the Community Climate System Model shows the same temperature sensitivity to changes in insolation as does our proxy reconstruction, supporting the inference that this long-term trend was caused by the steady orbitally driven reduction in summer insolation. The cooling trend was reversed during the 20th century, with four of the five warmest decades of our 2000-year-long reconstruction occurring between 1950 and 2000.
Here’s the press release from EurekAlert:
Long-term cooling trend in Arctic abruptly reverses, signaling potential for sea rise
 |
||||
A new study led by Northern Arizona University and involving the University of Colorado at Boulder indicates Arctic temperatures have reversed from a long-term cooling trend and are now the warmest they have been in at least 2,000 years, bad news for the world’s coastal cities facing rising seas in the coming decades.
High northern latitudes have experienced a long-term, slow cooling trend for several millennia, the result of a wobble in Earth’s rotation that has been increasing the distance between the sun and Earth and decreasing Arctic summer sunshine. The research team assembled high-resolution records of climate for the past 2,000 years and found that the cooling trend reversed in the mid-1990s.
The decade from 1999 to 2008 was the warmest in the last 200 decades and corresponds with a continuing buildup of human-generated greenhouse gases in Earth’s atmosphere, said lead author Darrell Kaufman of Northern Arizona University. “Scientists have known for a while that the current period of warming was preceded by a long-term cooling trend, said Kaufman. “But our reconstruction quantifies the cooling with greater certainty than ever before.”
Since the Earth is still moving away from the sun — it’s about 0.6 million miles further during the Northern Hemisphere summer solstice than it was in 1 B.C. — it appears greenhouse gases began “overriding” the natural cooling of Earth in the middle of the last century, said Professor Gifford Miller of CU-Boulder’s Institute for Arctic and Alpine Research, a study co-author. “We expect the Arctic will continue to warm in the coming decades, increasing land-based ice loss and triggering global increases in sea-level rise,” he said.
The study was published in the Sept. 4 issue of Science. Other institutions participating in the study included the National Center for Atmospheric Research in Boulder, the University of Arizona, the University of Massachusetts, the University of East Anglia in Norwich, England, and the University of Copenhagen in Denmark. The study was funded by the National Science Foundation.
The research team reconstructed past temperatures on a decade-by-decade basis during the past 2,000 years using information gleaned from ancient lake sediments, ice cores, tree rings and other samples. As part of the study, the decade-by-decade climate data reconstruction was compared with sophisticated climate model simulations run by NCAR researchers.
The NCAR climate simulations agreed closely with the ground-based Arctic data used in the study, said NCAR scientist David Schneider, a co-author on the study. “This result is particularly important because the Arctic, perhaps more than any other region on Earth, is facing dramatic impacts from climate change,” Schneider said. “This study provides us with a long-term record that reveals how greenhouse gases from human activities are overwhelming the Arctic’s natural climate system.”
The new Science study dovetails with a report published earlier this year by the U.S. Climate Change Science Program on changes in the Arctic and at high latitudes. The CCSP study’s five lead authors — including Miller and CU-Boulder INSTAAR Director Jim White — concluded climate warming in the Arctic and at high latitudes likely will continue at a rapid pace given human-caused changes in Earth’s atmosphere.
Arctic temperatures have reached their highest level in the past decade, averaging 2.5 degrees Fahrenheit higher than would have been expected if the 2,000-year cooling trend had continued through the latter part of the 20th century and into the 21st century, said Kaufman. Kaufman received his doctorate from CU-Boulder in 1991 while studying under Miller at INSTAAR.
Previous research has shown that Arctic temperatures increased three times faster during the 20th century than temperatures in the rest of the Northern Hemisphere — a phenomenon known as “Arctic amplification,” said Miller, also a professor of geological sciences at CU-Boulder. The amplification is caused by decreased Arctic sea ice and an increased absorption of the sun’s heat by exposed ocean as well as “darker” land areas caused by decreases of Arctic snow and ice, he said.
“With less sea ice in winter, the ocean returns the heat stored in summer to the atmosphere, resulting in warmer winters throughout the Arctic,” said Miller.
“Because we know that the processes responsible for past Arctic amplification are still operating, we can anticipate that it will continue into the next century,” said Miller. “The magnitude of change was surprising, and reinforces the conclusion that humans are significantly altering Earth’s climate.”
“As we are confronted with evidence of global warming, it is extremely helpful to be able to use paleoclimate data to provide context for today’s climate relative to the range and trajectory of recent climate regimes,” said Neil Swanberg, director of NSF’s Arctic System Science Program.
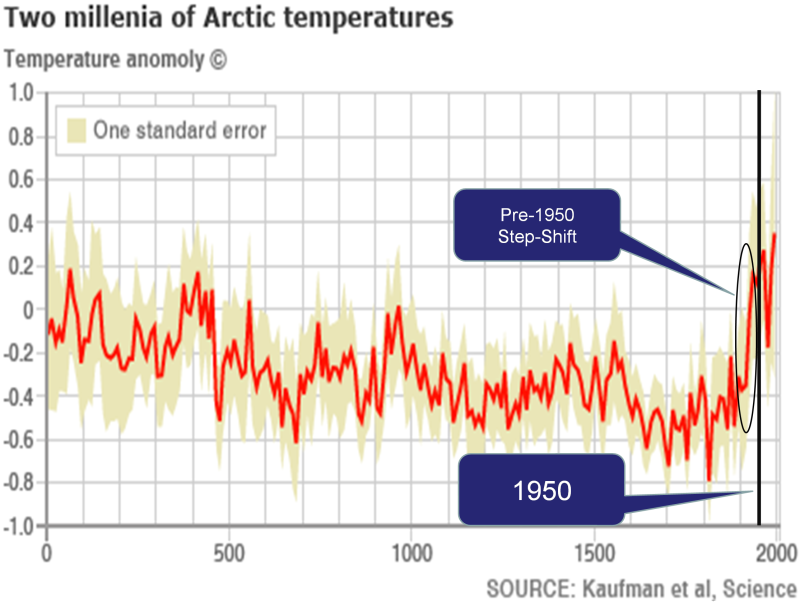
The BBC did a better job of reporting the story and included a graph from the paper. This paper supposedly ties all of the 20th century Arctic warming to greenhouse gas emissions… There’s one tiny problem with the paper’s claim…All of the anomalous warming occurred in one “step shift” before 1950; while most of the increase in atmospheric CO2 has occurred since 1950…
Kaufman et. al. w/ my annotations
And here is that graph Dave annotated:

OK that’s one problem. Here’s another. Both Kaufman et al and NOAA claim recent Arctic warming. In the case of the Kaufman paper, they specifically claim they “found that the cooling trend reversed in the mid-1990s.”
Since we can’t really look at the Hadley CRU data since it is held under lock and key despite the repeated FOI requests so that analysis and verification can be performed, we can’t really analyze it pertaining to NOAA’s claim of warming. Since NOAA and HadleyCRU use many of the same stations above 60N (they’d have to since there are so few) it seems reasonable to assume they share similar data in the Kaufman et al paper.
Fortunately there is another Arctic temperature data source available we can look at to compare against. And that is from the Danish Meteorological Institute (DMI). Like NOAA, they offer a dataset that shows temperature in the high latitudes.Here is what they say about that dataset and how it is obtained.
The daily mean temperature of the Arctic area north of the 80th northern parallel is estimated from the average of the 00z and 12z analysis for all model grid points inside that area. The ERA40 reanalysis data set from ECMWF, has been applied to calculate daily mean temperatures for the period from 1958 to 2002, from 2002 to 2006 data from the global NWP model T511 is used and from 2006 to present the T799 model data are used.
The ERA40 reanalysis data, has been applied to calculation of daily climate values that are plotted along with the daily analysis values in all plots. The data used to determine climate values is the full ERA40 data set, from 1958 to 2002.
Here is the most recent DMI graph of Arctic temperature:

Note that the blue line represents the “melting point” of ice in Kelvin or 0°C/32°F The green line represents the average climate from 1958 to 2002, i.e. the “baseline”
I don’t have time to get into a detailed analysis of the raw DMI data this morning as I have other duties, but I do have time to do a visual check that is just as telling.
Kaufman et al claims they “found that the cooling trend reversed in the mid-1990s.” That should easy to spot in the DMI graphs if it exists. So I animated the entire set of DMI graphs from 1958 to 2009. See if you can spot the temperature spikes or the “…cooling trend reversed in the mid-1990s.” signature.
click for full sized animation
Watch the top of the bell curve above the blue line. See any big changes? I don’t. Note that in the animation above, due to a slight change in DMI’s graphical presentation for 2008 and 2009, I had to graphically fit 2008 and 2009 to match the rest of the animation framework so that there would not be a distracting jump at the end. The data is unchanged in doing this.
One of the most common claims of alarmists is that the Arctic is “melting” and that implies a temperature cause in their statements. But as we see, during the critical melt window, the DMI data seems to hold right along the climatic normal.
One thing about DMI, if you go to their main web page, http://ocean.dmi.dk/english/index.php you don’t find any alarming pronouncements about Arctic melting or temperature reversal like you do at NOAA.
Others like NASA say the wind pattern changes is more of an issue, blowing the sea ice southward. Perhaps NOAA and Kaufman should look more closely at before making grand claims.
Further reading:
NASA Sees Arctic Ocean Circulation Do an About-Face
Arctic Sea ice loss – “it’s the wind” says NASA
Arctic Sea Ice Time Lapse from 1978 to 2009 using NSIDC data
Watching the 2007 historic low sea ice flow out of the Arctic Sea
McIntyre versus Jones: climate data row escalates
Joel Shore said
“As for Schmidt and Mann, they have been debating the science where it matters…in the peer-reviewed journals.”
It’s more like pal-reviewed tabloids nowadays for the Team.
Neven (11:02:50) : “…I understood that when the sea is refreezing after summer melt (counterintuitively) a lot of warmth is released in the atmosphere. The big refreezes of the last few years could explain part of the temperature increase trend in the Arctic.”
Yes, good point. And it also accounts for much of the Steigian statistical kloodgomatic warming of the Antarctic. Record ice buildup requires more heat be removed and dumped into the atmosphere. And ice is a lot denser than air; ice trumps gas.
Bringing things back to Perspective: Having said all that – I do not dispute that the Arctic Ice has been getting thinner in recent years.
My contention is simply this – what has happened during the past 3 decades appears to be nothing unusual or alarming.
Surely one would expect the same and more to have happened when the Arctic was warmer for decades and hundreds and even thousands of years, in our recent past.
Tim (10:24:44) :
the BBC have been full swing on the arctic warming thing.
They say ice, sedemant and tree ring data was used to prove it!
Just a question: are there any trees old enough in the arctic circle to support this claim???
Sure I can imagine so in temperate climates, but I thought the rctic was only pines?
Am I wrong, or more BBC lies?
Plate IV in H.H. Lamb’s Book “Climatic History and the Future” shows a big tree stump dated to about 5000 ybp in the midst of northern Canada tundra. Obviously, the Arctic was a lot warmer at the time. I have suggested to my colleagues that the Arctic Ocean might have been ice-free during the summer at this time. So, here is nice tree ring data in the Arctic, but it exists from a truly warm epoch well before 2,000 years ago. Perhaps there are stumps dating from the MWP preserved in the Arctic somewhere, but, then, wouldn’t they show a warm period in the midst of the cooling trend?
1) “Well, in scientific terms, it’s the angle of the dangle and the motion of the ocean.”
To translate: Because the Northern Hemisphere has a lot of land, and only a little ocean, the surface temperature should warm up and cool down fast. The southern hemisphere has lots of ocean, so should have less temperature variation between summer and winter. (note, I say should, because I haven’t actually looked at the data)
So: in NH summer, eg July, the NH should be comparatively nice and toasty, while the SH should be only a little chilly: the net is therefore warmer than the annual mean. In January, the NH should be really chilly, and the SH should be only a little warm: the net is therefore cooler than the annual mean.
Personally, I would use a climate model to see how that effect compares in magnitude to the difference in distance from the sun effect, but it seems like a reasonable explanation.
2) I think that the press article, while it could have been phrased better, was making the point about insolation on the _Arctic_, in which case all one cares about is the distance from the sun in the summer.
3) I believe that -1.8 degrees C, not zero, is the critical point for freezing seawater (and presumably melting ice that is in contact with seawater, though that might not apply to surface meltpools)
4) Given the high heat capacity of water, the temperature during the winter months might matter even when it is below the -1.8 degree threshold: eg, melting will happen earlier if the winter averages -25 degrees, compared to a winter where it averages -35. Again, despite the dislike of this website for computer models, they would be the best way to determine how the magnitude of the seawater temperature effect compares to the magnitude of latent heat of fusion, especially given that the ice sheet insulates a decent portion of the Arctic Ocean.
Joel Shore (19:15:17) :
[Schmidt, by the way, has participated in at least one debate, but it is quite debatable what such things accomplish.]
You’ll be referring to the I-squared dabate with Michael Crichton and Professors Lindzen and Stott? Well – that debate did accomplish one thing for Gavin Schmidt: it showed that he couldn’t debate and quite frankly appeared to be well out of his depth.
A claim made in Kaufman’s 2004 effort, and I think made here as well, is that an ice-free arctic ocean contributes greatly to warming because it is “dark”. And this same fact seems to be the basis of the “arctic is just about at a tipping point” belief as well.
Well ocean actually is dark when one is looking straight down, but at low angles the ocean surface looks like the sky because it is reflecting the sky. Now in the arctic the sun is never very high anyway and so there is reduced irradiance from the low angle, and probably a reasonably high reflection coefficient. Moreover, the arctic has quite a lot of ice-free area in “normal” times.
Does anyone know of a study done to show how much more energy would be absorbed in an ice-free arctic ocean as opposed to a 1979-2000 average arctic ocean? I can imagine that the effect is actually quite small, but I may be wrong.
Right. In this case the NH-oriented land distribution at full face to the sun overcomes the greater solar distance at aphelion.
In order to determine what that 7% solar difference makes would be to compare NH summer when it occurs at perihelion to when it occurs at aphelion. But we can only do that by proxy, of course, as a full equinox cycle is ~23,000 years.
Marcus (21:56:52) : and evanmjones (22:18:58) : This is something that puzzled me and I have actually worked out here:
http://wattsupwiththat.com/2009/08/21/soho-back-up-and-running-didnt-miss-anything-sun-still-blank/ Richard (20:54:22)
evanmjones is spot on.
But this still leaves the question where he gets the 600,000 mile figure from, when it should be 188 miles. And it still leaves the logical fault I have pointed out above: Richard (16:42:31)
Looks like we’ve got another hockey stick here– with the raw data withheld.
I believe that -1.8 degrees C, not zero, is the critical point for freezing seawater (and presumably melting ice that is in contact with seawater
No (re melting), ice frozen from sea water leaves the salt behind and is salt free frozen water. It melts above zero degrees C.
Interestingly, the extensive sea ice in the Southern Oceans makes the water saltier than the rest of the world’s oceans. To a degree that is fatal to most fish. As a result there are few fish in the waters around Antarctica.
http://www.gma.org/surfing/antarctica/salt.html
This from David Scneider’s web page, pointing out his work on Steig et al 2009.
http://www.cgd.ucar.edu/~dschneid/David_P._Schneider/Research.html
There are always many interesting things to work on. Among them, I continue to collaborate with Dr. Eric Steig, my former Ph.D. advisor, at the University of Washington. Recent work includes the reconstruction of Antarctic temperatures (Steig et al., 2009; Schneider and Steig, 2008). This revealed a clear warming trend in West Antarctica during the past ~50 years.
This is some background from Bette L. Otto-Bliesner’s website:
http://www.cgd.ucar.edu/ccr/ottobli/
Arctic Warmth and the Greenland Ice Sheet
I am currently also working closely with the paleodata and ice sheet modeling communities to examine the warm Arctic summers during the Last Interglaciation and impact on the polar ice sheets of Greenland and Antarctica and global sea level. These calculations show summers 3 to 5½C warmer than today in the Arctic, especially over and near Greenland, in very good agreement with the IGBP CAPE (CircumArctic PaleoEnvironments) proxy data synthesis. Ice cores in Greenland indicate that the Greenland ice sheet was significantly smaller during this interglaciation. Calculations with the University of Calgary ice sheet model show that the substantial melting of the Greenland ice sheet and the complete melting of the nearby eastern Canadian icefields likely contributed 2 to 4 meters of sea level rise during this past time period.
The results are quite relevant to assessments of projections of future climate change. The Arctic summer warmth during the Last Interglaciation is comparable to what might be expected by year 2100 if greenhouse gases increase to an equivalent radiative forcing of a tripling of atmospheric carbon dioxide (although the impact on the Greenland ice sheet will likely take several centuries more). This is a collaborative project with Jonathan Overpeck at the University of Arizona, Shawn Marshall at the University of Calgary, Gifford Miller at the University of Colorado, and the IGBP CAPE project.
Typo – David Schneider
Note to those commenting about N-S asymmetry:
The NH is also warming for the reasons Yu.V. Barkin points out.
Academic arrogance drives a neverending barrage of untenable assumptions that blinds unquestioning followers, sometimes for centuries. Barkin peels wool off innocent eyes, exposing yet more of the “convenient math” that has deceived the masses.
Trust in consensus-makers is being ground to a pulp.
It seems to me that there is some important material emerging here that wants to be saved / made accessible somewhere
(1) Taphonomic (18:06:40 on 4 Sept) on “follow the money” to get Phil Jones’ data because his money sources stipulate that the source is conditional on data being open and available;
(2) Richard (18:38:32) “…The GISP2 data is not sparse. It is pretty precise, measuring temperatures very precisely at about 10 year intervals. I go by that for the Arctic data, not anything else… if you examine the graph of the anomalies, you can easily see that the cooling has been hardly “PERVASIVE”! (Is there a way for me to upload my graphs here? or maybe you could make some using GISP2 records)…”
Also, evanmjones, have a look at George White’s work “CO2 Forcing: Fact or Fiction”if you don’t know it already, it deserves a place in the real science for intelligent reading of the ice core records and good grasp of the complex effect of Milankovitch cycles on the development of ice ages.
To translate: Because the Northern Hemisphere has a lot of land, and only a little ocean, the surface temperature should warm up and cool down fast. The southern hemisphere has lots of ocean, so should have less temperature variation between summer and winter. (note, I say should, because I haven’t actually looked at the data)
So: in NH summer, eg July, the NH should be comparatively nice and toasty, while the SH should be only a little chilly: the net is therefore warmer than the annual mean. In January, the NH should be really chilly, and the SH should be only a little warm: the net is therefore cooler than the annual mean.
All this is true, and the effect is much larger than you would anticipate. In July the world’s average atmospheric temperature is more than 7C higher than in January.
According to the IPCC logic this means the NH is already having a climate catastrophy (compared to the SH). Which goes to show how ludicrous the climate alarmism is.
http://itg1.meteor.wisc.edu/wxwise/AckermanKnox/chap14/climate_spatial_scales.html
The post 1958 animation plot is most interesting:
1. It shows that throughout the period, brief spikes exist where an anomaly of up to 20 degrees exists compared to the long-term mean. This should be firmly pointed out next time some journo goes off on their hobby horse that Arctic temperatures are massively above average…..that was true in January 2009 and temperatures are entirely normal now……
2. A huge anomaly exists in late 2006/07 which presumably can be correlated in part to the massive ice loss that summer? What did this have to do with carbon dioxide? Given the consistent pumping of that gas into the atmosphere, sudden surges and returns to normal in arctic temperatures seem somewhat at odds with that as a causative agent, would you agree?
3. What would be most valuable would be a plot of the frequency of major anomaly events over this period (+5 to +10; +10 to +15; +15 to plus 20 and > plus 20 degrees from the mean; ditto negative ones) to see if there is a short- or medium term difference e.g. post 1975 when the PDO shifted or e.g. after when the AMO shifted or e.g. after any other known oscillatory patterns relevant to arctic last shifted phase…
“By my calculation in 2,000 years the distance would have increased by a mere 300 kms or 188 miles and not 600,000 miles, an error of 320,000 %.”
Calculating something entirely unrelated and then alleging a vast error is laughable. Ever heard of Milankovitch cycles? What is your understanding of them?
Hello Warmistas! For the 100st time: And what about medival climate optimum? The vikings settling in GREENland?
Apparently, Arctic is often definied as 60-90 N. But almost no region as far south as 60 N has an Arctic climate! If the definition is chosen as 65-90 N, 70-90 N, or only parts of the Northern Hemisphere with an Arctic climate, there is no measureble difference between the warm period in the 30’s and the present warm period.
Re: P Wilson (12:38:32) :
I might also suggest that the BBC is a news and entertainment organisation, and not a scientific organisation
—
I’d suggest it’s more an entertainment and infotainment organisation, and it’s admitted a bias towards promoting a warmist agenda. This goes against the principles laid out for it in it’s Charter, and for which it gets around $5.2bn a year from the government. Currently it’s illegal to be informed, educated or entertained via TV in the UK without subscribing to the BBC first.
A few years ago, the BBC asked for even more money, it was denied, so it promptly slashed the budgets for it’s news department, along with it’s natural history units and most of it’s factual and learning budgets. It didn’t stop it producing lavish warmist infotainment like ‘Climate Wars’ though.
Much of what passes for ‘news’ now from the BBC is simply churnalism provided by wire services. Nick Davies explains on this in ‘Flat Earth News’ & also explains the time pressure the BBC’s news dept is under to get copy to multiple BBC units, which means facts go unchecked.
For PR companies like Fenton and EMS, this is a godsend because it makes setting the agenda easy and cheap. For the public, it’s not such good news, but then we have the blogosphere to provide balance.
>>>I might also suggest that the BBC is a “news and
>>>entertainment” organisation, and not a scientific organisation
I think you mean “propaganda and entertainment”.
Besides, it used to carry good technical and scientific programs. Try this for a bit of nostalgia:
.
“DaveE (13:17:35) :
JaneHM (10:56:42) :
Kaufman et al appears to be in conflict with the historical records of Scandinavian exploration of the Arctic North Atlantic around 1000 – 1400 AD and earlier
Plate tectonics my dear, Greenland was 1000 miles further South then 😉
DaveE”
DaveE has made a signifcant discovery. Greenland has been travelling South at the rate of a mile a year and no one has noticed!
Richard (16:42:31): “The Earth-Sun distance is increasing by 15 cms per year. By my calculation in 2,000 years the distance would have increased by a mere 300 kms or 188 miles and not 600,000 miles, an error of 320,000 %”
Your calculation is wrong on two levels. Firstly, 15cm * 2000 years = 300 metres not 300 km.
Secondly, the article you cited is not referring perehelion/apehelion changes but to tiny tidal drag effects which are in addition to these.
Regarding the BBC I no longer watch their news programmes which are biased toward the loony left viewpoint on almost any topic under discussion.
I now watch Sky news for a more matter of fact appraisal and one evening this week was pleased to hear their major newsman Steve Dixon aver that he did not accept the Global Warming arguments.
He is still in his slot on Sky which proves that that programme provider at least allows independent thinking and possibly that Sky is rowing back from the unthinking acceptance of the AGW theory demonstrated by the rest of the MSM.