UPDATE: 9/8/09
The University of Colorado made a serious mistake in the press release that I cited. This press release was issued well before the paper was available, and of course the paper itself was not made available to journalists. It was hidden behind the AAS paywall.
I wrote to the press officer at UC on Friday, he responded Saturday night, on a holiday weekend, to his credit, here is my exchange:
Re: question about press release
From: Gifford H. MillerSent: Saturday, September 05, 2009 8:02 PMTo: Anthony Watts – mobileSubject: Re: question about press releaseIndeed, this is a typo, Anthony. Not sure how it escaped my attention.The sentence should read: “The research team assembled high-resolution records of climate for the past 2,000 years and found that the cooling trend reversed in 20th Century.“I have passed the correction to our PR folks and it should be fixed soonThanks for catching thisGifford Miller
Hello,
I looked at the Kaufman paper press release on EurekAlert as well as here:http://www.colorado.edu/news/r/bff9b4f453f2f9e1aa1e5d1b699d8525.html
In the second paragraph there is this sentence:“The research team assembled high-resolution records of climate for the past 2,000 years and found that the cooling trend reversed in the mid-1990s.”Is this correct? Is this a typo and instead should it say “mid-1900’s ” ?
Thanks for your consideration. Anthony Watts
UC has updated their press release here on 9/7 and was able to persuade EurekAlert to fix it on their website also.
The last sentence of paragraph 2 now reads:
“The research team assembled high-resolution records of climate for the past 2,000 years and found that the cooling trend reversed in the 20th century.”
It was originally stated as:
The research team assembled high-resolution records of climate for the past 2,000 years and found that the cooling trend reversed in the mid-1990s.
I’ve received some criticism for using the press release and acting on it to look for such a change in the 1990’s per the press release. While that criticism would be valid if the press release and the paper were both made available to me at the same time, the fact is they were not.
This method of pushing a scientific paper via press release, ahead of the paper’s actual journal release, and then hiding it behind a paywall is unprofessional and stinks. If the science organization wants to be seen as credible, then they need to make both the press release AND the paper available to journalists at the same time.
This idiotic “press release but no sci paper” policy needs to be changed. I’ll have more on this soon. As it stands, I’ve going to avoid UC press releases until they change the policy and I encourage others to do the same.
– Anthony
==========================
There’s a lot of buzz about regarding the Kaufman et al paper published today in Science which claims a recent reversal on a long term Arctic cooling trend and “found that the cooling trend reversed in the mid-1990s.” In the NOAA internal newsletter I cited yesterday, NOAA claims that the “According to the most recent Arctic Report Card, the Arctic Ocean continues to warm”. OK fair enough, we’ll have a look.
NOAA based this on Hadley’s CRU dataset, which of course Hadley refuses to show any raw data for or methodology despite repeated FOI requests, making verification impossible. (read more here)
 |
| Figure A1. Arctic-wide annual averaged surface air temperature anomalies (60°–90°N) based on land stations north of 60°N relative to the 1961–90 mean. From the CRUTEM 3v dataset, (available online at www.cru.uea.ac.uk/cru/data/temperature/. Note this curve does not include ship observations. |
Note the trend from 1980 to present. Note also that there are few weather stations above 60N and even fewer on the Arctic Ice itself. The data is relatively sparse and interpolation/gridding/averaging is employed to come up with the coverage all the way to 90N. We’ll get back to this.
Let’s first get an understanding of the Kaufman paper. Here’s the abstract. We can’t get a look at the full paper or publish it here yet since it is behind the AAS paywall. If somebody has an external link to it, please advise.
Recent Warming Reverses Long-Term Arctic Cooling
Darrell S. Kaufman,1,* David P. Schneider,2 Nicholas P. McKay,3 Caspar M. Ammann,2 Raymond S. Bradley,4 Keith R. Briffa,5 Gifford H. Miller,6 Bette L. Otto-Bliesner,2 Jonathan T. Overpeck,3 Bo M. Vinther,7 Arctic Lakes 2k Project Members
The temperature history of the first millennium C.E. is sparsely documented, especially in the Arctic. We present a synthesis of decadally resolved proxy temperature records from poleward of 60°N covering the past 2000 years, which indicates that a pervasive cooling in progress 2000 years ago continued through the Middle Ages and into the Little Ice Age. A 2000-year transient climate simulation with the Community Climate System Model shows the same temperature sensitivity to changes in insolation as does our proxy reconstruction, supporting the inference that this long-term trend was caused by the steady orbitally driven reduction in summer insolation. The cooling trend was reversed during the 20th century, with four of the five warmest decades of our 2000-year-long reconstruction occurring between 1950 and 2000.
Here’s the press release from EurekAlert:
Long-term cooling trend in Arctic abruptly reverses, signaling potential for sea rise
 |
||||
A new study led by Northern Arizona University and involving the University of Colorado at Boulder indicates Arctic temperatures have reversed from a long-term cooling trend and are now the warmest they have been in at least 2,000 years, bad news for the world’s coastal cities facing rising seas in the coming decades.
High northern latitudes have experienced a long-term, slow cooling trend for several millennia, the result of a wobble in Earth’s rotation that has been increasing the distance between the sun and Earth and decreasing Arctic summer sunshine. The research team assembled high-resolution records of climate for the past 2,000 years and found that the cooling trend reversed in the mid-1990s.
The decade from 1999 to 2008 was the warmest in the last 200 decades and corresponds with a continuing buildup of human-generated greenhouse gases in Earth’s atmosphere, said lead author Darrell Kaufman of Northern Arizona University. “Scientists have known for a while that the current period of warming was preceded by a long-term cooling trend, said Kaufman. “But our reconstruction quantifies the cooling with greater certainty than ever before.”
Since the Earth is still moving away from the sun — it’s about 0.6 million miles further during the Northern Hemisphere summer solstice than it was in 1 B.C. — it appears greenhouse gases began “overriding” the natural cooling of Earth in the middle of the last century, said Professor Gifford Miller of CU-Boulder’s Institute for Arctic and Alpine Research, a study co-author. “We expect the Arctic will continue to warm in the coming decades, increasing land-based ice loss and triggering global increases in sea-level rise,” he said.
The study was published in the Sept. 4 issue of Science. Other institutions participating in the study included the National Center for Atmospheric Research in Boulder, the University of Arizona, the University of Massachusetts, the University of East Anglia in Norwich, England, and the University of Copenhagen in Denmark. The study was funded by the National Science Foundation.
The research team reconstructed past temperatures on a decade-by-decade basis during the past 2,000 years using information gleaned from ancient lake sediments, ice cores, tree rings and other samples. As part of the study, the decade-by-decade climate data reconstruction was compared with sophisticated climate model simulations run by NCAR researchers.
The NCAR climate simulations agreed closely with the ground-based Arctic data used in the study, said NCAR scientist David Schneider, a co-author on the study. “This result is particularly important because the Arctic, perhaps more than any other region on Earth, is facing dramatic impacts from climate change,” Schneider said. “This study provides us with a long-term record that reveals how greenhouse gases from human activities are overwhelming the Arctic’s natural climate system.”
The new Science study dovetails with a report published earlier this year by the U.S. Climate Change Science Program on changes in the Arctic and at high latitudes. The CCSP study’s five lead authors — including Miller and CU-Boulder INSTAAR Director Jim White — concluded climate warming in the Arctic and at high latitudes likely will continue at a rapid pace given human-caused changes in Earth’s atmosphere.
Arctic temperatures have reached their highest level in the past decade, averaging 2.5 degrees Fahrenheit higher than would have been expected if the 2,000-year cooling trend had continued through the latter part of the 20th century and into the 21st century, said Kaufman. Kaufman received his doctorate from CU-Boulder in 1991 while studying under Miller at INSTAAR.
Previous research has shown that Arctic temperatures increased three times faster during the 20th century than temperatures in the rest of the Northern Hemisphere — a phenomenon known as “Arctic amplification,” said Miller, also a professor of geological sciences at CU-Boulder. The amplification is caused by decreased Arctic sea ice and an increased absorption of the sun’s heat by exposed ocean as well as “darker” land areas caused by decreases of Arctic snow and ice, he said.
“With less sea ice in winter, the ocean returns the heat stored in summer to the atmosphere, resulting in warmer winters throughout the Arctic,” said Miller.
“Because we know that the processes responsible for past Arctic amplification are still operating, we can anticipate that it will continue into the next century,” said Miller. “The magnitude of change was surprising, and reinforces the conclusion that humans are significantly altering Earth’s climate.”
“As we are confronted with evidence of global warming, it is extremely helpful to be able to use paleoclimate data to provide context for today’s climate relative to the range and trajectory of recent climate regimes,” said Neil Swanberg, director of NSF’s Arctic System Science Program.
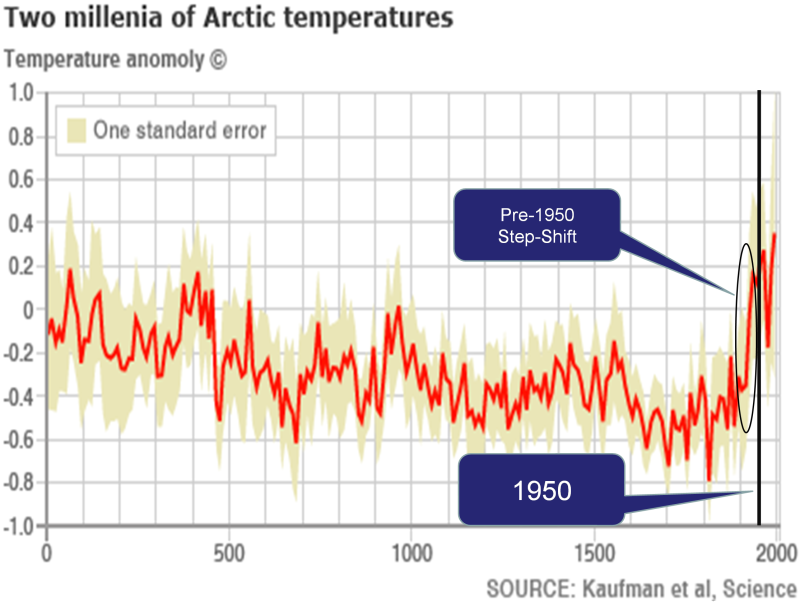
The BBC did a better job of reporting the story and included a graph from the paper. This paper supposedly ties all of the 20th century Arctic warming to greenhouse gas emissions… There’s one tiny problem with the paper’s claim…All of the anomalous warming occurred in one “step shift” before 1950; while most of the increase in atmospheric CO2 has occurred since 1950…
Kaufman et. al. w/ my annotations
And here is that graph Dave annotated:

OK that’s one problem. Here’s another. Both Kaufman et al and NOAA claim recent Arctic warming. In the case of the Kaufman paper, they specifically claim they “found that the cooling trend reversed in the mid-1990s.”
Since we can’t really look at the Hadley CRU data since it is held under lock and key despite the repeated FOI requests so that analysis and verification can be performed, we can’t really analyze it pertaining to NOAA’s claim of warming. Since NOAA and HadleyCRU use many of the same stations above 60N (they’d have to since there are so few) it seems reasonable to assume they share similar data in the Kaufman et al paper.
Fortunately there is another Arctic temperature data source available we can look at to compare against. And that is from the Danish Meteorological Institute (DMI). Like NOAA, they offer a dataset that shows temperature in the high latitudes.Here is what they say about that dataset and how it is obtained.
The daily mean temperature of the Arctic area north of the 80th northern parallel is estimated from the average of the 00z and 12z analysis for all model grid points inside that area. The ERA40 reanalysis data set from ECMWF, has been applied to calculate daily mean temperatures for the period from 1958 to 2002, from 2002 to 2006 data from the global NWP model T511 is used and from 2006 to present the T799 model data are used.
The ERA40 reanalysis data, has been applied to calculation of daily climate values that are plotted along with the daily analysis values in all plots. The data used to determine climate values is the full ERA40 data set, from 1958 to 2002.
Here is the most recent DMI graph of Arctic temperature:

Note that the blue line represents the “melting point” of ice in Kelvin or 0°C/32°F The green line represents the average climate from 1958 to 2002, i.e. the “baseline”
I don’t have time to get into a detailed analysis of the raw DMI data this morning as I have other duties, but I do have time to do a visual check that is just as telling.
Kaufman et al claims they “found that the cooling trend reversed in the mid-1990s.” That should easy to spot in the DMI graphs if it exists. So I animated the entire set of DMI graphs from 1958 to 2009. See if you can spot the temperature spikes or the “…cooling trend reversed in the mid-1990s.” signature.
click for full sized animation
Watch the top of the bell curve above the blue line. See any big changes? I don’t. Note that in the animation above, due to a slight change in DMI’s graphical presentation for 2008 and 2009, I had to graphically fit 2008 and 2009 to match the rest of the animation framework so that there would not be a distracting jump at the end. The data is unchanged in doing this.
One of the most common claims of alarmists is that the Arctic is “melting” and that implies a temperature cause in their statements. But as we see, during the critical melt window, the DMI data seems to hold right along the climatic normal.
One thing about DMI, if you go to their main web page, http://ocean.dmi.dk/english/index.php you don’t find any alarming pronouncements about Arctic melting or temperature reversal like you do at NOAA.
Others like NASA say the wind pattern changes is more of an issue, blowing the sea ice southward. Perhaps NOAA and Kaufman should look more closely at before making grand claims.
Further reading:
NASA Sees Arctic Ocean Circulation Do an About-Face
Arctic Sea ice loss – “it’s the wind” says NASA
Arctic Sea Ice Time Lapse from 1978 to 2009 using NSIDC data
Watching the 2007 historic low sea ice flow out of the Arctic Sea
McIntyre versus Jones: climate data row escalates
Lee Kington (13:19:06) : ..Since the Earth is still moving away from the sun — it’s about 0.6 million miles further during the Northern Hemisphere summer solstice than it was in 1 B.C. — it appears greenhouse gases began “overriding” the natural cooling of Earth in the middle of the last century, said Professor Gifford Miller of CU-Boulder’s Institute for Arctic and Alpine Research, a study co-author…
I don’t think that an extra 600,000 miles from the Sun is going to make a big difference in total irradiance…
That logic is fatally flawed. Its amazing how many of these top notch scientists regularly make such elementary errors of logic and hence come to the wrong conclusions.
1. Error of fact? – The Earth-Sun distance is increasing by 15 cms per year. http://www.newscientist.com/article/dn17228-why-is-the-earth-moving-away-from-the-sun.html
By my calculation in 2,000 years the distance would have increased by a mere 300 kms or 188 miles and not 600,000 miles, an error of 320,000 %.
Does he mean that the NH summer solstice is increasing in distance from the sun? He doesnt say so. What he says is “Since the Earth is still moving away from the sun..” and it is not, to any appreciable extent over 2,000 years.
In any case this also has to be checked as I very much doubt it. Perhaps an astronomer (who once replied to me, I forget his name) could do this for us.
2. Error of logic – Even assuming that to be true – how would it appear that greenhouse gases would begin to “override” the natural cooling of Earth in the middle of the last century? What huge difference took place in the last 50 years in the Earth-Sun distance? And the time span he has chosen includes the Roman warm period and the Medieval warm period. How could you explain CO2 overriding the “natural cooling” of the Earth in those periods?
Lee Kington: where are you getting your temperature numbers from? A 0.1% change in solar irradiance corresponds to a forcing of about 0.24W/m⊃2. Climate sensitivity is commonly reckoned to be about 0.75 K/W/m⊃2. So that would be a 0.18K change, not the 0.05K you claim. That is averaging things globally rather than considering them regionally; the effect of this change on northern hemisphere summers is much greater than the global average.
“With that amount of cooling caused by decrease in solar radiation how it the world did the earth escape the LIA …. long before man started pumping massive amounts of CO2 into the atmosphere.”
You don’t need massive amounts of CO2 to affect the radiative balance of the atmosphere. CO2 started rising in about 1750.
Anthony – feel free to use the valid e-mail address I’ve supplied with all my posts. I’ll be happy to send you the paper. Not that you even need it – the abstract directly contradicts what you’ve claimed about it. Why do you persist in misrepresenting it?
REPLY: tsk tsk there RW I caution you. DO NOT transpose what is clearly listed in the press release to be what I’ve written. That is the statement of the press release.
To say I’ve claimed that is wrong and you know it. Just because the abstract doesn’t say that statement means nothing. Retraction required on your part.
– Anthony
“A groundbreaking study that traces Arctic temperatures further back than ever before”
Ha ha, here is a Kaufman paper from 2004, where they go back a lot farther,
http://esp.cr.usgs.gov/research/alaska/PDF/KaufmanAger2004QSR.pdf
but I guess pointing that out would not make the front page.
This is a tremendous relief. After 2000 years of cooling, Earth must have been perilously close to a tipping point that would have led inexorably to the next Ice Age. We have avoided reaching that tipping point for now through serendipitous usage of coal, oil, and natural gas. What will mankind do when those run out?
Well I just sent an e-mail to Jerry Brown’s global warming site; what the hell does the attorney General of California have a department of global warming for. So I told him it wasn’t something his office should be involved in, and basically told him to stay within his own sphere of competence.
Well “moonbeam” Brown always has been a total ding-a-ling; a true product of the sixties crowd epitomized by Joan Baez; whose “folk singing” was predated by decades by the likes of Irish folksinger Mary Ohara; even to singing the very same somgs or close lookalikes.
We get the same tool of big oil tar brush; but nary a mention of the thousands of otherwise unemployed “scientists” swilling at the public trough to try and keep their grant money coming. I know personally, Meteorologists, who are paid good money by people or companies; who really want to know what the near and mid future weather really is going to be; they have financial decisions riding on the outcoem; and they aren’t paying for politically correct opinion; they expect thsoe meteorologists to have much better than even money batting average; and what is more; they can do it.
I know of a guy (in New Zealand of all places) who correctly predicted the development of local weather and wind patterns during the days when the most recent Americas Cup sailing races were held in Valencia Spain; and he did it with the standard information that is available to anyone; and his predictions were uncannily accurate. Now he wouldn’t predict the “weather” a decade from now; he’s not stupid enough to claim he can do that; but he understands what is driving such systems; and the funny thing is he doesn’t even get paid for it; he works for a bank.
In comparison, the hay that has already been once through the horse, that Attorney General Brown has shovel ready, on his website; is a total waste of my tax dollars.
George
stumpy is correct. If you want to look at the effect of air temperatures on ice melt, you clearly look at changes in the amount of time and the degree to which the temperature has been above 0C.
However, as I pointed out above, NOAA actually says,
Autumn temperatures are at a record 5º C above normal, due to the major loss of sea ice in recent years which allows more solar heating of the ocean
They are saying loss of sea ice is the cause of warmer ocean temperatures and consequently the cause of the warmer Arctic air temperatures. Which incidentally is correctly how cause and effect works in the Earth’s climate.
But hey. This is post-modern climate science. Its not about clearly stating the scientific truth. It’s about not saying anything scientifically untrue, while trying to influence public and political opinions.
Anthony, apologies for dominating this thread early on. But a late evening post is an early morning one for me Downunder.
Funny: Trouble is that the anomalies are BELOW zero °C, so…everything it´s OK, nothing to worry…go to sleep polar bears!
The actual problem for the world it is not a temperature change but a political change which can take us back to the middle ages.
Anthony,
While you may dismiss Tamino blithely in this case, he takes the data and demonstrates that it does, indeed, show considerable warming, especially in the latter part of the century, and particularly in the winter: http://tamino.files.wordpress.com/2009/08/tganom2.jpg
Do you suggest that, if you took the DMI data, removed the annual cycle, and did an OLS regression on it, you would not find significant > 3 degrees C warming over the last 40 years?
REPLY: “Tamino” can say anything he wants, that doesn’t make it relevant. The big hot button issue has been “the arctic is melting” I’m only pointing out that if there is no significant excursions beyond the top of the DMI/ERA40 average climate bell curve, then there is no extension of the period when temperatures are warm enough to melt sea ice in place.
A 30 year upwards trend of winter temperature that remains subzero does nothing to enhance ice melt. However wind pattern changes that force the icepack southward along the east coast of Greenland where the ice melts in warmer waters does seem have a big effect. NASA points out significant wind pattern changes, but that is ignored by Tamino and everyone else in his peer group. Why?
“The Arctic is warming” is the news catchphrase desired from the Kaufman paper here, just like it was in Antractica and the Steig et al trainwreck. But if the temperature during the summer Arctic melt season does not increase over summer climate normals, then that has no significant effect on enhancing ice melt. Neither does a warming trend that occurs in deep winter when the temperature averages -20C. If the trend in the last 40 years was to make that winter average go from -23C to -20C (just examples not from data/calcs) then the sea ice remains frozen. It still doesn’t affect the melt until the 2M air temperature trend or other Arctic environmental changes causes a change in the amount of time spent above the freezing point of seawater and that does not appear to be happening.
“Tamino” himself points out that “…most of the temperature change north of latitude 80 deg. has occurred, not in the summer, but in winter/spring/fall.” And during much of that time the air temperature remains below 273K.
But you’ve given me a great idea.
– Anthony
P.S. Caspar Amman is part of this Kaufman paper, and for a look at the sort of integrity in data analysis he has, one should read the excellent Caspar and the Jesus Paper here:
http://bishophill.squarespace.com/blog/2008/8/11/caspar-and-the-jesus-paper.html
It seems the main argument of the IPCC defenders lies on the HADCRUT temperature curve, shown so many times to justify “un-precedented warming”. YET, Phil Jones refuses to offer raw data so HADCRUT salad can be replicated.
I bet that the moment raw data will be available we’ll find that the HADCRUT chef was spicing the mix with hot peppers…
Supposition from my part? Of course. Want to stop them? PUBLISHE THE RAW DATA Dr. Jones!
Zeke Hausfather, I prefer this chart: click. [Note that it shows global temp anomalies.]
Global temperatures are essentially the same as they were thirty years ago. No need for regressions, or removing the annual cycle, or consulting tarot cards, or anything else.
There is no measurable AGW. Everything we see is well within the parameters of natural climate change. Falsify natural climate variability, and you’ve got something. As of now, you’ve got nothin’.
I dunno. Looking at the animation, recheck the downslope, below the blue line. Seems to me the last few years are a lot less cold. Is that what they are seeing in an annual or decadal average? Murray
Smokey,
I see a statistically significant trend of 0.14 degrees C per decade in that chart you posted. Though to be fair, I prefer this version: http://i81.photobucket.com/albums/j237/hausfath/Picture11.png
However, this discussion is about arctic temps, which have risen much faster than global temps no matter what data set you use.
If you want the data that phill jones has collected, here is how to get the data that Phil Jones has collected:
While the whole UK FOI action against CRU was an interesting experiment in how the UK treats FOI requests and embarrassed CRU for not having data traceability, it did really resolve getting the data. To get resolution to this, you have to follow the money. The amount of U.S. government funding to climate scientists is staggering.
Phil Jones (University of East Anglia or UEA) has been funded by the U.S. Department of Energy (DOE) Office of Biological & Environmental Research (BER) since 1993; often with Tom Wigley. [Note, that there is also another Phil Jones at Los Alamos National Laboratory (LANL) who receive funding for climate change research; this is not the same Phil Jones (UEA).] Partial details of the grants and funding are provided at the bottom of this post and greater details on the grants are on the webpages cited. This includes the DOE grant that Steve McIntyre kept asking about: DE-FG02-98ER62601.
As Phil Jones (UEA) has been funded by these grants he is subject to the data sharing policy of the DOE granting office and division. The DOE BER Climate Change Research Division Climate Change Prediction Program at http://www.sc.doe.gov/ober/CCRD/model.html only states: “Funding of projects by the program is contingent on adherence to the BER data sharing policy.”
A much more detailed description of Climate Change Research Division (note the CCRD in the weblink) data sharing policy can be found at http://www.science.doe.gov/ober/CCRD/per.html where among other things it states:
Program Data Policy
The program considers all data collected using program funds, all results of any analysis or synthesis of information using program funds, and all model algorithms and codes developed with program funding to be “program data”. Open sharing of all program data among researchers (and with the interested public) is critical to advancing the program’s mission.
Specific terms of the program’s data sharing policy are: (1) following publication of research results, a copy of underlying data and a clear description of the method(s) of data analysis must be provided to any requester in a timely way; (2) following publication of modeling methods or results, a copy of model code, parameter values, and/or any input dataset(s) must be provided to any requester in a timely way; and (3) recognition of program data sources, either through co-authorship or acknowledgments within publications and presentations, is required.
The program assumes that costs for sharing data are nominal and are built into each grant application or field work proposal. In cases where costs of sharing are not nominal, the burden of costs will be assumed by the requester. The Program Manager should be informed whenever a requester is expected to pay for the costs of obtaining program data, whenever a data request is thought to be unreasonable, and whenever requested program data is undelivered.
Funding of projects by the program is contingent on adherence to this data sharing policy.
Several things pop out in this policy:
“Open sharing of all program data among researchers (and with the interested public) is critical to advancing the program’s mission”
“a copy of underlying data and a clear description of the method(s) of data analysis must be provided to any requester in a timely way”
“following publication of modeling methods or results, a copy of model code, parameter values, and/or any input dataset(s) must be provided to any requester in a timely way;”
“The program assumes that costs for sharing data are nominal and are built into each grant application”
This says nothing about sharing with “academics only”. Sharing with the “interested public” is clearly specified. As Phil Jones (UEA) has published multiple research and modeling results, I’m sure a polite request to Dr. Jones (UEA) from a member of the “interested public” for a copy of underlying data and a clear description of the method(s) of data analysis and a copy of model code, parameter values, and/or any input dataset(s) that are the results of DOE funding would be provided to any requester in a timely way as is required by the DOE data sharing policy. After all, the US taxpayers paid for this work and the interested public should be able to get this info.
If the requested information is “undelivered” then a polite request to the head of Climate Change Prediction Program:
Dr. Anjuli Bamzai
Climate and Environmental Sciences Division, SC-23.1
Department of Energy, GTN Bldg.
1000 Independence Ave, SW
Washington, DC 20585-1290
Phone: (301) 903-0294
Fax: (301) 903-8519
Email: anjuli.bamzai@science.doe.gov
would probably be in order. Perhaps a query about the quality assurance standards for these grants, the traceability of data requirements for these grants, and whether continued funding would be provided to principal investigators who do not comply with data requests could also be made.
If that does work, then a FOIA request to DOE regarding data availability, quality assurance standards, and the traceability of the data might get results. The DOE takes FOIA requests seriously. FOIA worked when Steve McIntyre asked for info from B. Santer at the DOE lab, LLNL.
If there are problems with this, then DOE would be open to FOIA requests as to why their Principal Investigators are not living up to data sharing agreements; why the DOE is not enforcing data sharing agreements; why DOE is funding individuals who do not abide by the DOE data sharing agreements; why the data gathered under the DOE program are not traceable; and if the data are not traceable, then what good are the data.
GRANT INFORMATION (weblink followed by brief description of grant):
http://www.osti.gov/oberabstracts/detail.jsp?projectSerial=3784&query_id=0&searchpage=index.jsp
Register Number: ER94157
Project Term: 12/01/1993 – 11/30/1994
Funding not listed
http://www.osti.gov/oberabstracts/detail.jsp?projectSerial=4270&query_id=0&searchpage=index.jsp
Register Number: ER95144
Project Term: 03/01/1995 – 02/28/1996
Funding not listed
http://www.osti.gov/oberabstracts/detail.jsp?projectSerial=4747&query_id=0&searchpage=index.jsp
Register Number: ER96167
Project Term: 12/01/1994 – 11/30/1997
Funding not listed
http://www.osti.gov/oberabstracts/detail.jsp?projectSerial=2002&query_id=0&searchpage=index.jsp
Register Number: ER62601
BER Division: Climate Change Research Division
Awarded Amount to Date and B&R Code :
FY 2006 $178 k KP120101
FY 2005 $175 k KP120101
FY 2004 $173 k KP120101
FY 2003 $180 k KP120101
FY 2002 $180 k KP120101
FY 2001 $180 k KP120101
FY 2000 $180 k KP120101
FY 1999 $174 k KP120101
FY 1998 $170 k KP120101
NOTE: The grant listed above is DE-FG02-98ER62601
http://www.osti.gov/oberabstracts/detail.jsp?projectSerial=674&query_id=0&searchpage=index.jsp
Register Number: ER60397
BER Division: Climate Change Research Division
Awarded Amount to Date and B&R Code :
FY 2003 $0 k KP120101
FY 2002 $0 k KP120101
FY 2001 $0 k KP120101
FY 2000 $0 k KP120101
FY 1999 $-3 k KP120101
FY 1998 $0 k KP120101
FY 1997 $200 k KP120101
FY 1996 $198 k KP120101
FY 1995 $192 k KP120101
http://www.osti.gov/oberabstracts/detail.jsp?projectSerial=5516&query_id=0&searchpage=index.jsp
Register Number: ER62601
Awarded Amount to Date and B&R Code :
FY 2006 $177 k KP120101
FY 2005 $174 k KP120101
FY 2004 $172 k KP120101
FY 2003 $180 k KP120101
http://www.osti.gov/oberabstracts/detail.jsp?projectSerial=5859&query_id=0&searchpage=index.jsp
Register Number: ER62601
BER Division: Climate Change Research Division
Research Area: CCPP-CCRI
Awarded Amount to Date and B&R Code :
FY 2010 $0 k
FY 2009 $0 k
FY 2008 $199 k KP1206
FY 2007 $0 k
Project Term: 05/01/2007 – 04/30/2010
Juraj V. (11:07:19).. How on Earth they were able to produce such a hockey stick?
I wonder too looking at your graphs.
..The temperature history of the first millennium C.E. is sparsely documented, especially in the Arctic. We present a synthesis of decadally resolved proxy temperature records from poleward of 60°N covering the past 2000 years, which indicates that a pervasive cooling in progress 2000 years ago continued through the Middle Ages and into the Little Ice Age.
“pervasive cooling in progress 2000 years ago” I doubt it very much.
The GISP2 data is not sparse. It is pretty precise, measuring temperatures very precisely at about 10 year intervals. I go by that for the Arctic data, not anything else you may have fudged up.
Yes if you plot a trendline from 2006.87 BP (2000 AD), the trendline goes down, But that is because the temperatures then were 1.3 C higher then than at present. (1.83 C higher at 2068.24 BP)
But If you examine the graph of the anomalies, you can easily see that the cooling has been hardly “PERVASIVE”! (Is there a way for me to upload my graphs here? or maybe you could make some using GISP2 records)
Right from 4433.29 BP till 1375.5 BP, (for over 3,000 years!), the arctic temperatures, at least in Greenland were higher than at present!
There were some periods (3320.32 BP to 3237.71BP – 83 years) when it was over 2.25 C higher and others, for centuries, where it was 1 to 1.5 C higher.
I wonder what the state of the Arctic Ice, polar bears, etc were during that period?
Now the AGW crowd are jumping up and down because the temperatures have been high for 50 years.
From 1365 BP temperatures dropped and remained lower than present till 1121 BP.
From 1113 to 869 BP temperatures remained higher than present and from 1025 to 931 (94 years) more than 0.5 C higher. (The peak at 965 BP 0.94 C higher than present).
This “continued through the Middle Ages”??? This proves your study is rubbish. I would get snipped, but you know exactly what you can do with your “synthesis of decadally resolved proxy temperature records”.
A quick example of real science being used as opposed to the quasi science of the AGW Hypothesis.
…. and it hardly took a moment to do. If Kaufman had done what you had Anthony, they could have spent their grant money studing something more noteworthy and benificial.
Well, your post here opens by claiming a new investigation in Science claimed the trend halted in 1990. But it didn’t…that’s what the EurekaAlert claimed. The abstract you reprinted clearly says otherwise. You don’t need to read the paper, they say outright in the abstract that their investigation showed the trend reversed :
“The cooling trend was reversed during the 20th century, with four of the five warmest decades of our 2000-year-long reconstruction occurring between 1950 and 2000.”
I agree with you that it’s a good place to start, with what the study actually says. I immediately suspected a typo from the EurekaAlert. The 9 isn’t very far from the 0 on a lot of keyboards.
I think it’s obvious that someone made an error. It happens.
As to your gif image, it seems to confirm what Tamino has presented before at Open Minds. I know you and he don’t get along, but that is no reason to cast aside his results. Your .gif of DMI data seems to show this to be the case as well. It has no statistics to show that to be true, but that’s what you get with eyeballing.
Excellent info, Taphonomic (18:06:40). Thanx for posting.
And Zeke Hausfather (18:01:40), that chart is fine, too. There are lots more like it. It clearly shows that the climate is well within the parameters of normal variability. So there is zero need to add an extraneous entity like CO2 to the explanation.
As usual, the climate alarmists avoid talking about Antarctic temperature trends: click.
Since the entire debate is about global warming, then both the Arctic and Antarctic should have equal billing. If you look at GLOBAL ice cover, you will see that it is increasing.
Also, the CO2=AGW contingent loses credibility when charts use an honest y-axis with a zero base line: click.
Face it, there isn’t any proof that AGW exists. It is a failed conjecture that only keeps on its zombie-style living because $Billions are paid out to those perpetrating its Elmer Gantry-type snake oil sales pitch.
If Gore, Mann, Pachauri, Obama, Schmidt, or any other AGW proslytizer really believed in AGW, they would be happy to debate what they believe in. But they hide out from debate! Doesn’t that tell you all you need to know about what they really believe?
Clearing things up…the agreement that your .gif has with Tamino is on greater warming during the winter months as opposed to the summer months.
Anthony Watts says (in reply to RW):
Nobody’s perfect. In the context of their actual paper (and even just the abstract), I think it is almost certain that the “mid-1990s” statement in the press release is a typo and that they meant “mid-1900s”.
Smokey:
First of all, Gore and Obama are politicians, not scientists. Why should they debate the science? They know enough to respect the scientific organizations and the scientific process and leave that to the scientists.
As for Schmidt and Mann, they have been debating the science where it matters…in the peer-reviewed journals. What other controversies (such as that concerning the origins of living things) have shown is that it is the losers in the REAL scientific debate that occurs in the peer-reviewed literature who desperately want to take the debate into a popular forum where they can more easily bamboozle people. (See, for example, here: http://www.pebhmong.com/forum/index.php?action=printpage;topic=112018.0 ) [Schmidt, by the way, has participated in at least one debate, but it is quite debatable what such things accomplish.]
RW (15:23:30) : Currently, in the northern hemisphere summer, we’re near aphelion – that’s 94,500,000 miles from the Sun. 600,000 miles less than that is 93,900,000. Solar irradiance is proportional to the inverse square of the distance from the Sun. So in this case, that’s a drop of 1.3%. 1.3% less solar radiation is a huge forcing. Why didn’t you do some simple sums like this before coming to a conclusion?
RW please see my post Richard (16:42:31).
The question is NOT what difference 600,000 miles would make to the irradiance but whether the figure is correct. I get a figure of 188 miles, not 600,000 miles!
Also the 1.3% difference in irradiance you have mentioned is IRRELEVANT. You obviously dont understand the difference between insolation and irradiance. What really matters is insolation not irradiance.
In July the Earth is at aphelion and Jan perihelion. It is 3.2 million miles further in July than Jan from the Sun. This amounts to the Earth getting 7% less irradiance in July than Jan. Yet the Global temperature of the Earth is 2.9 C warmer in July than Jan!
Go figure that out and answer me if you can instead of fighting strawmen and feeling pretty chuffed about it.
I do like someone who understands the Byzantine corridors of government bureacrats. In this case the US ones.
It seems to me to be good advice. It has the authentic ring of someone who knows whereof they speak.
So you lot push from your end and I will pull from mine and we may yet get Dr. Jones [no relation] at UAE to reveal his secrets.
Kindest regards
Go figure that out and answer me if you can instead of fighting strawmen and feeling pretty chuffed about it.
Well, in scientific terms, it’s the angle of the dangle and the motion of the ocean.
evanmjones (19:43:27) : Well, in scientific terms, it’s the angle of the dangle and the motion of the ocean.
You dont have to use such technical language, cant you explain in simpler terms for us poor laymen? 🙂