UPDATE: 9/8/09
The University of Colorado made a serious mistake in the press release that I cited. This press release was issued well before the paper was available, and of course the paper itself was not made available to journalists. It was hidden behind the AAS paywall.
I wrote to the press officer at UC on Friday, he responded Saturday night, on a holiday weekend, to his credit, here is my exchange:
Re: question about press release
From: Gifford H. MillerSent: Saturday, September 05, 2009 8:02 PMTo: Anthony Watts – mobileSubject: Re: question about press releaseIndeed, this is a typo, Anthony. Not sure how it escaped my attention.The sentence should read: “The research team assembled high-resolution records of climate for the past 2,000 years and found that the cooling trend reversed in 20th Century.“I have passed the correction to our PR folks and it should be fixed soonThanks for catching thisGifford Miller
Hello,
I looked at the Kaufman paper press release on EurekAlert as well as here:http://www.colorado.edu/news/r/bff9b4f453f2f9e1aa1e5d1b699d8525.html
In the second paragraph there is this sentence:“The research team assembled high-resolution records of climate for the past 2,000 years and found that the cooling trend reversed in the mid-1990s.”Is this correct? Is this a typo and instead should it say “mid-1900’s ” ?
Thanks for your consideration. Anthony Watts
UC has updated their press release here on 9/7 and was able to persuade EurekAlert to fix it on their website also.
The last sentence of paragraph 2 now reads:
“The research team assembled high-resolution records of climate for the past 2,000 years and found that the cooling trend reversed in the 20th century.”
It was originally stated as:
The research team assembled high-resolution records of climate for the past 2,000 years and found that the cooling trend reversed in the mid-1990s.
I’ve received some criticism for using the press release and acting on it to look for such a change in the 1990’s per the press release. While that criticism would be valid if the press release and the paper were both made available to me at the same time, the fact is they were not.
This method of pushing a scientific paper via press release, ahead of the paper’s actual journal release, and then hiding it behind a paywall is unprofessional and stinks. If the science organization wants to be seen as credible, then they need to make both the press release AND the paper available to journalists at the same time.
This idiotic “press release but no sci paper” policy needs to be changed. I’ll have more on this soon. As it stands, I’ve going to avoid UC press releases until they change the policy and I encourage others to do the same.
– Anthony
==========================
There’s a lot of buzz about regarding the Kaufman et al paper published today in Science which claims a recent reversal on a long term Arctic cooling trend and “found that the cooling trend reversed in the mid-1990s.” In the NOAA internal newsletter I cited yesterday, NOAA claims that the “According to the most recent Arctic Report Card, the Arctic Ocean continues to warm”. OK fair enough, we’ll have a look.
NOAA based this on Hadley’s CRU dataset, which of course Hadley refuses to show any raw data for or methodology despite repeated FOI requests, making verification impossible. (read more here)
 |
| Figure A1. Arctic-wide annual averaged surface air temperature anomalies (60°–90°N) based on land stations north of 60°N relative to the 1961–90 mean. From the CRUTEM 3v dataset, (available online at www.cru.uea.ac.uk/cru/data/temperature/. Note this curve does not include ship observations. |
Note the trend from 1980 to present. Note also that there are few weather stations above 60N and even fewer on the Arctic Ice itself. The data is relatively sparse and interpolation/gridding/averaging is employed to come up with the coverage all the way to 90N. We’ll get back to this.
Let’s first get an understanding of the Kaufman paper. Here’s the abstract. We can’t get a look at the full paper or publish it here yet since it is behind the AAS paywall. If somebody has an external link to it, please advise.
Recent Warming Reverses Long-Term Arctic Cooling
Darrell S. Kaufman,1,* David P. Schneider,2 Nicholas P. McKay,3 Caspar M. Ammann,2 Raymond S. Bradley,4 Keith R. Briffa,5 Gifford H. Miller,6 Bette L. Otto-Bliesner,2 Jonathan T. Overpeck,3 Bo M. Vinther,7 Arctic Lakes 2k Project Members
The temperature history of the first millennium C.E. is sparsely documented, especially in the Arctic. We present a synthesis of decadally resolved proxy temperature records from poleward of 60°N covering the past 2000 years, which indicates that a pervasive cooling in progress 2000 years ago continued through the Middle Ages and into the Little Ice Age. A 2000-year transient climate simulation with the Community Climate System Model shows the same temperature sensitivity to changes in insolation as does our proxy reconstruction, supporting the inference that this long-term trend was caused by the steady orbitally driven reduction in summer insolation. The cooling trend was reversed during the 20th century, with four of the five warmest decades of our 2000-year-long reconstruction occurring between 1950 and 2000.
Here’s the press release from EurekAlert:
Long-term cooling trend in Arctic abruptly reverses, signaling potential for sea rise
 |
||||
A new study led by Northern Arizona University and involving the University of Colorado at Boulder indicates Arctic temperatures have reversed from a long-term cooling trend and are now the warmest they have been in at least 2,000 years, bad news for the world’s coastal cities facing rising seas in the coming decades.
High northern latitudes have experienced a long-term, slow cooling trend for several millennia, the result of a wobble in Earth’s rotation that has been increasing the distance between the sun and Earth and decreasing Arctic summer sunshine. The research team assembled high-resolution records of climate for the past 2,000 years and found that the cooling trend reversed in the mid-1990s.
The decade from 1999 to 2008 was the warmest in the last 200 decades and corresponds with a continuing buildup of human-generated greenhouse gases in Earth’s atmosphere, said lead author Darrell Kaufman of Northern Arizona University. “Scientists have known for a while that the current period of warming was preceded by a long-term cooling trend, said Kaufman. “But our reconstruction quantifies the cooling with greater certainty than ever before.”
Since the Earth is still moving away from the sun — it’s about 0.6 million miles further during the Northern Hemisphere summer solstice than it was in 1 B.C. — it appears greenhouse gases began “overriding” the natural cooling of Earth in the middle of the last century, said Professor Gifford Miller of CU-Boulder’s Institute for Arctic and Alpine Research, a study co-author. “We expect the Arctic will continue to warm in the coming decades, increasing land-based ice loss and triggering global increases in sea-level rise,” he said.
The study was published in the Sept. 4 issue of Science. Other institutions participating in the study included the National Center for Atmospheric Research in Boulder, the University of Arizona, the University of Massachusetts, the University of East Anglia in Norwich, England, and the University of Copenhagen in Denmark. The study was funded by the National Science Foundation.
The research team reconstructed past temperatures on a decade-by-decade basis during the past 2,000 years using information gleaned from ancient lake sediments, ice cores, tree rings and other samples. As part of the study, the decade-by-decade climate data reconstruction was compared with sophisticated climate model simulations run by NCAR researchers.
The NCAR climate simulations agreed closely with the ground-based Arctic data used in the study, said NCAR scientist David Schneider, a co-author on the study. “This result is particularly important because the Arctic, perhaps more than any other region on Earth, is facing dramatic impacts from climate change,” Schneider said. “This study provides us with a long-term record that reveals how greenhouse gases from human activities are overwhelming the Arctic’s natural climate system.”
The new Science study dovetails with a report published earlier this year by the U.S. Climate Change Science Program on changes in the Arctic and at high latitudes. The CCSP study’s five lead authors — including Miller and CU-Boulder INSTAAR Director Jim White — concluded climate warming in the Arctic and at high latitudes likely will continue at a rapid pace given human-caused changes in Earth’s atmosphere.
Arctic temperatures have reached their highest level in the past decade, averaging 2.5 degrees Fahrenheit higher than would have been expected if the 2,000-year cooling trend had continued through the latter part of the 20th century and into the 21st century, said Kaufman. Kaufman received his doctorate from CU-Boulder in 1991 while studying under Miller at INSTAAR.
Previous research has shown that Arctic temperatures increased three times faster during the 20th century than temperatures in the rest of the Northern Hemisphere — a phenomenon known as “Arctic amplification,” said Miller, also a professor of geological sciences at CU-Boulder. The amplification is caused by decreased Arctic sea ice and an increased absorption of the sun’s heat by exposed ocean as well as “darker” land areas caused by decreases of Arctic snow and ice, he said.
“With less sea ice in winter, the ocean returns the heat stored in summer to the atmosphere, resulting in warmer winters throughout the Arctic,” said Miller.
“Because we know that the processes responsible for past Arctic amplification are still operating, we can anticipate that it will continue into the next century,” said Miller. “The magnitude of change was surprising, and reinforces the conclusion that humans are significantly altering Earth’s climate.”
“As we are confronted with evidence of global warming, it is extremely helpful to be able to use paleoclimate data to provide context for today’s climate relative to the range and trajectory of recent climate regimes,” said Neil Swanberg, director of NSF’s Arctic System Science Program.
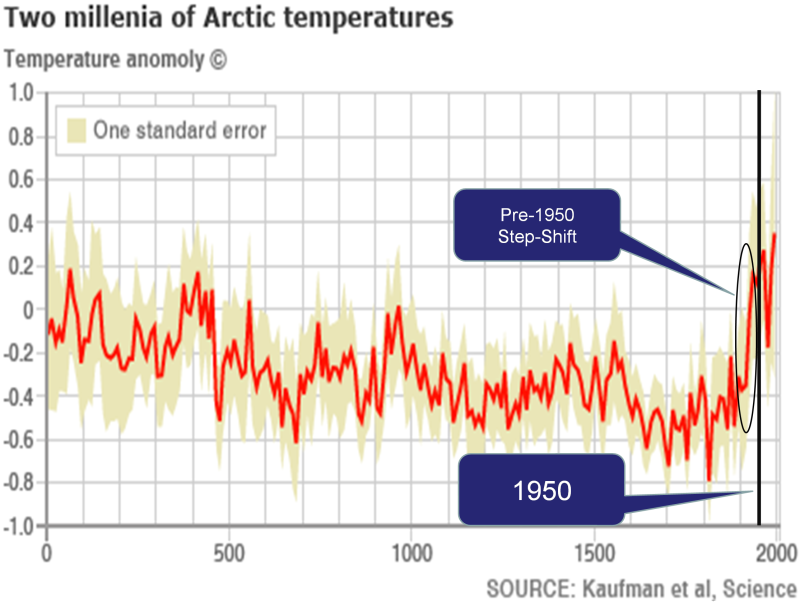
The BBC did a better job of reporting the story and included a graph from the paper. This paper supposedly ties all of the 20th century Arctic warming to greenhouse gas emissions… There’s one tiny problem with the paper’s claim…All of the anomalous warming occurred in one “step shift” before 1950; while most of the increase in atmospheric CO2 has occurred since 1950…
Kaufman et. al. w/ my annotations
And here is that graph Dave annotated:

OK that’s one problem. Here’s another. Both Kaufman et al and NOAA claim recent Arctic warming. In the case of the Kaufman paper, they specifically claim they “found that the cooling trend reversed in the mid-1990s.”
Since we can’t really look at the Hadley CRU data since it is held under lock and key despite the repeated FOI requests so that analysis and verification can be performed, we can’t really analyze it pertaining to NOAA’s claim of warming. Since NOAA and HadleyCRU use many of the same stations above 60N (they’d have to since there are so few) it seems reasonable to assume they share similar data in the Kaufman et al paper.
Fortunately there is another Arctic temperature data source available we can look at to compare against. And that is from the Danish Meteorological Institute (DMI). Like NOAA, they offer a dataset that shows temperature in the high latitudes.Here is what they say about that dataset and how it is obtained.
The daily mean temperature of the Arctic area north of the 80th northern parallel is estimated from the average of the 00z and 12z analysis for all model grid points inside that area. The ERA40 reanalysis data set from ECMWF, has been applied to calculate daily mean temperatures for the period from 1958 to 2002, from 2002 to 2006 data from the global NWP model T511 is used and from 2006 to present the T799 model data are used.
The ERA40 reanalysis data, has been applied to calculation of daily climate values that are plotted along with the daily analysis values in all plots. The data used to determine climate values is the full ERA40 data set, from 1958 to 2002.
Here is the most recent DMI graph of Arctic temperature:

Note that the blue line represents the “melting point” of ice in Kelvin or 0°C/32°F The green line represents the average climate from 1958 to 2002, i.e. the “baseline”
I don’t have time to get into a detailed analysis of the raw DMI data this morning as I have other duties, but I do have time to do a visual check that is just as telling.
Kaufman et al claims they “found that the cooling trend reversed in the mid-1990s.” That should easy to spot in the DMI graphs if it exists. So I animated the entire set of DMI graphs from 1958 to 2009. See if you can spot the temperature spikes or the “…cooling trend reversed in the mid-1990s.” signature.
click for full sized animation
Watch the top of the bell curve above the blue line. See any big changes? I don’t. Note that in the animation above, due to a slight change in DMI’s graphical presentation for 2008 and 2009, I had to graphically fit 2008 and 2009 to match the rest of the animation framework so that there would not be a distracting jump at the end. The data is unchanged in doing this.
One of the most common claims of alarmists is that the Arctic is “melting” and that implies a temperature cause in their statements. But as we see, during the critical melt window, the DMI data seems to hold right along the climatic normal.
One thing about DMI, if you go to their main web page, http://ocean.dmi.dk/english/index.php you don’t find any alarming pronouncements about Arctic melting or temperature reversal like you do at NOAA.
Others like NASA say the wind pattern changes is more of an issue, blowing the sea ice southward. Perhaps NOAA and Kaufman should look more closely at before making grand claims.
Further reading:
NASA Sees Arctic Ocean Circulation Do an About-Face
Arctic Sea ice loss – “it’s the wind” says NASA
Arctic Sea Ice Time Lapse from 1978 to 2009 using NSIDC data
Watching the 2007 historic low sea ice flow out of the Arctic Sea
McIntyre versus Jones: climate data row escalates
You claim that the authors found that something changed in the mid-1990s. And yet you even print out their abstract, which states that the cooling trend reversed in the mid-20th century, not the mid-1990s.
Your animation does not permit a useful assessment of whether the Arctic has warmed or not; the scale is too small. You can find a comprehensive analysis [http://tamino.wordpress.com/2009/08/28/yes-virginia-the-arctic-is-warming-fast/]
REPLY: RW it would not matter what I presented, you would not like it, your worldview is fixed, much like Tamino, aka Mr. “Open Mind” himself. Peas in a pod you two. Both afraid to put their name on anything they say.
And…you are wrong. The phrase is from the press release:
http://www.eurekalert.org/pub_releases/2009-09/uoca-lct083109.php
Read the 2nd paragraph. It says:
“The research team assembled high-resolution records of climate for the past 2,000 years and found that the cooling trend reversed in the mid-1990s.”
So yes, my animation does permit it to look for a reversal in the mid 1990’s, since that is covered in the DMI dataset. – Anthony Watts
Tim (10:24:44)
There are hundreds of research papers on the Atctic over the centuries: Grumet, N.S., Wake, C.P., Mayewski et al and a heck of alot of papers to show that the MWP was global, and warmer than today. Loehle, C. 2007 etc. There is evidence of settlements way into greenland that are now under ice.
However, before 1979 it simply wasn’t known how much sea ice there was, so the present majority take the 1979-present as being the universal truth for all time. Not that earth could possibly be for all time of course. It is reputed that the 1930’s saw greater warming than the past 20 years, so its likely that Arctice ice extent could have been lesser than today. Certainly there were icebergs in the 20’s and 30’s in the Atlantic that traversed from the Arctic, and we have the Titanic as evidence that Arctic ice doesn’t stay in its place.
Indeed to say that the Arctic is warming/melting faster than it has in the last 2000 years is like saying that the Titanic didn’t sink because you dipped your feet into the sea on the West Coast of the USA and didn’t feel it underfoot.
It’s very interesting. Because “they” cannot control the present (non warming) they have taken to rewritting history, so that the MWP and Roman warm periods are erased with the shake of a tree ring. This is the mother of all hockey sticks. They have learnt from Mann’s mistakes – make sure you cover those pesky warm periods in your time scale.
And there is a wisdom among warmists, my brothers: NEVER, but NEVER give your raw data and algorithms to a skeptic.
I might also suggest that the BBC is a news and entertainment organisation, and not a scientific organisation
It looks like they are preparing to explain a long period of no warming by saying that the temp is higher than it would have been if the natural cooling hadn’t been been stopped by the infernal gas, CO2.
Their CO2 theory isn’t wrong, CO2 is just stopping cooling not causing warming. This means that no matter what the temp is anywhere, they can say that it would have been colder if man hadn’t interferred.
This then means that their theory can never be disproven as a colder temperature always exists.
Well what about the holocene optimum? It was longer in duration and warmer than any MWP. It also coindided with the growth of civilisations such as China and Mesopotamia amongst others..
According to present theories, it should have been catastrophe, but it was the converse
Problem is obvious. The Danish data hasnt been adjusted properly to conform to GISS procedures. Clearly it needs to be corrected for UAH effects. Once that is done it will be perfect and the hokey stick will be safe.
JaneHM (10:56:42) :
Plate tectonics my dear, Greenland was 1000 miles further South then 😉
DaveE.
I could be wrong but I find this shocking…
Since the Earth is still moving away from the sun — it’s about 0.6 million miles further during the Northern Hemisphere summer solstice than it was in 1 B.C. — it appears greenhouse gases began “overriding” the natural cooling of Earth in the middle of the last century, said Professor Gifford Miller of CU-Boulder’s Institute for Arctic and Alpine Research, a study co-author. “We expect the Arctic will continue to warm in the coming decades, increasing land-based ice loss and triggering global increases in sea-level rise,” he said.
I don’t think that an extra 600,000 miles from the Sun is going to make a big difference in total irradiance. Certainly one would have to consider other factors before pointing the finger at CO2 as the culprit.
Classic climate science.
Who needs thermometers when you’ve got treemometers, ice cores and lake sediments?
Chuckie lives!
We can go back 11,000 years and know that the Arctic was much colder. Anything close to land was still glaciated at this time and the sea ice was permanent, even in the summer.
By the Holocene Optimum, the majority of the glaciers had melted, other than Greenland and on a few select other islands. The axial tilt reached its maximum about 8,000 years ago and summers would have been warmer (and winters colder). The previous year’s snow definitely melted in the summer and there may have been periods when the sea ice melted completely by September.
Since then, the tilt has been decreasing again and I can buy that the Arctic is generally cooling off slowly.
But there has still been cycles of warmer and cooler. The Inuit would not have invented the kayak and whaling boats if the ice did not melt in a manner similar today. The Vikings were not farming in Greenland 700 years ago if it was that much colder.
The Greenland ice cores show lots of variation and periods in the last 2,000 years which were warmer than today (which contradicts this study).
http://mclean.ch/climate/figures_2/GISP_to_11Kybp.gif
Data at:
http://www1.ncdc.noaa.gov/pub/data/paleo/icecore/greenland/summit/gisp2/isotopes/gisp2_temp_accum_alley2000.txt
Anytime one sees the Team using their proxies, you can just skip reading it and move on to something else.
Wondering Aloud (10:39:43) :
True dat. Not much global warming ‘science’ is independently verifiable, except on the skeptic side, therefore it can not be trusted and must be discarded.
And all this talk about the Arctic is due to one fact: globally, sea ice is increasing.
So pay no attention to the man behind the curtain; look only at the Arctic, because alarmists don’t want to discuss the Antarctic. It’s too inconvenient.
“”” Note the trend from 1980 to present. Note also that there are few weather stations above 60N and even fewer on the Arctic Ice itself. The data is relatively sparse and interpolation/gridding/averaging is employed to come up with the coverage all the way to 90N. “””
Well averaging is a well exercised method of throwing away information; not adding information; and interpolation is a well known method of not adding anything.
There’s that pesky Nyquist Sampling theorem, that keeps on saying you can’t make silk out of a sow’s ear.
The sparcity of arctic measured data, is afundamentally incurable limitation to knowing what is really happening up there.
I believe that in historic times; (1850s) there were precisely 12 “weather” stations taking data north of +60 deg Latitude. That number slowly increased to up in the 80s, and then came down around the time of the collapse (implosion) of the Soviet Union. Compare that systemic fiddling with the carnage that resulted from that little orbital boost that Dr Spencer was telling us about the other day; that ruined his whole weekend.
When the Arctic (+60 > +90) has 80,000 sampling stations; I’ll start believing their data. Of course I don’t mind them reporting the average of the 72 or whatever stations they have now; so long as they don’t try to connect it to the whole arctic; most of which they know nothing about.
According to the most recent Arctic Report Card, the Arctic Ocean continues to warm”. OK fair enough, we’ll have a look.
I posted this in the previous thread but its on topic here,
——
NOAA in their Arctic Report Card Loudly proclaim Arctic atmospheric temperatures up 5C.
Then leads in with
Atmosphere
Summary
Autumn temperatures are at a record 5º C above normal, due to the major loss of sea ice in recent years which allows more solar heating of the ocean.
But then read the report itself and the text under the graph at the top of this page). NOAA doesn’t report any actual atmospheric temperature measurements from the Arctic Ocean The only data they include, because presumably it is the only data they have, is from land stations. The atmospheric temperatures for the entire Arctic Ocean is extrapolation. No data. None at all.
The 5C increase is just more the deceptive rubbish we are so used from the AGW believers.
——
Also note NOAA are saying loss of sea ice is causing the Arctic warming. Not the other way around.
NOAA are saying absolutely nothing about global warming causing loss of Arctic sea ice. In fact their statements imply global warming isn’t the cause of loss of Arctic sea ice, and strongly imply global warming isn’t the cause of Arctic warming.
But as usual, its all packaged and phrased in ways that can only be intended to mislead and deceive those who are not used to parsing scientific reports, and determining if the evidence supports the conclusions.
Thankyou for pointing to the information @ur momisugly Bill Illis.
Presuming that Central Greenland is a proxy for the Arctic region generally, then the information dating back over the last 2000 years from those NOAHH links shows that it was indeed warmer and colder than the present. Its confusing that the same organisation would say that it is the warmest for 2000 years when their own data show that it wasn’t.
Amazing: the Kaufman et al. 2009 paper is published September 3, and already all newspapers in the world have a ready comment on it!
Here is copy of my post on Climateaudit:
here is the link from the Globe and Mail piece by Mr. Weber: http://www.theglobeandmail.com/news/technology/science/arctic-warmest-its-been-in-2000-years-study-finds/article1275018/
and here is my complaint to the Canadian Press:
“The Bob Weber
The Canadian Press
Last updated on Thursday, Sep. 03, 2009 05:11PM EDT
A groundbreaking study that traces Arctic temperatures further back than ever before has shown the region is now warmer than at any time in the past 2,000 years…
is truly an incomplete description of the state of scientific knowledge in this field. In particular it completely fails to check the co-authors past history of flawed studies, the validity of the proxies and take the PR from Science and the lead author at face value, despite the existence of a significant amount of peer reviewed literature demonstrating the flaws in the previous studies by IPCC co-authors, rehashed in the Kaufman et al. 2009 paper.
A scientific case is built at
http://www.climateaudit.org/?p=6932
where Mr. Weber could find all the information he needs to amend his article and transform a piece of propaganda into a piece of information.”
Of historical interest,
The two millenia of Arctic temperatures graph above shows shows an abrupt cooling trend around 450AD equivalent to the warming trend from 1900 to 1950.
I’ve speculated before that global cooling contributed to the decline of the Roman Empire and specifically caused their abrupt and unexplained departure from Britain.
That temperature decline exactly coincided with the 20 or 30 year period the Romans are known to have left Britain and the reason likely would have been a decline in British wheat production, which was Britain’s main export under Roman rule.
I noted in the previous thread that wheat is the major crop most at risk from even a short period of global cooling.
Curious how these things tie together.
Anthony, when you want to know what a paper says, do you a) read the paper, or b) read what someone else thinks the paper says, and believe that even when it’s not what the paper says? If the former, why haven’t you done that in this case? If the latter – why?
REPLY:When you are a scientific organization that makes a press release to EurekaAlert, do you a)check it for accuracy b) assume it matches your paper exactly and not worry about any such quality control?
As an American taxpayer, I resent publicly funded work being hidden behind a paywall, so no I don’t always read it right away but I do when it is made publicly available.
Is it wrong for a scientific organization to push press releases that end up in the public eye without providing the public open and unfettered access to the paper? When public funds are used to write the paper, absolutely.
Since you’ve apparently read it, send me your copy then. I’ll look forward to getting it. Provide a valid email address and I’ll contact you and you can send it along with a note showing exactly why the press release is wrong. – Anthony
“I don’t think that an extra 600,000 miles from the Sun is going to make a big difference in total irradiance”
Currently, in the northern hemisphere summer, we’re near aphelion – that’s 94,500,000 miles from the Sun. 600,000 miles less than that is 93,900,000. Solar irradiance is proportional to the inverse square of the distance from the Sun. So in this case, that’s a drop of 1.3%. 1.3% less solar radiation is a huge forcing. Why didn’t you do some simple sums like this before coming to a conclusion?
“With less sea ice in winter, the ocean returns the heat stored in summer to the atmosphere, resulting in warmer winters throughout the Arctic,” said Miller.
So if more heat is returned to the atmosphere, and therefore radiated back out into space, then having less ice in winter results in an overall greater loss of heat and a general cooling of the earth. Resulting in more ice in the future retaining heat causing less ice and loosing heat… Sounds like a good temperature stabilization device (thermostat) to me.
Is this something like the iris effect of clouds in the tropics?
Keith (11:21:58) : Not many thermometers in the arctic. But what there are pretty much conforms to the DMI data. Alert, Nunavut, Canada’s northernmost airport at about 82.5N, is well below freezing for the duration of the season. Forecasts to next Wednesday are for a -8C minimum (17.6F)
http://www.wunderground.com/cgi-bin/findweather/getForecast?query=Alert, Nunavut&wuSelect=WEATHER
And Resolute, Nunavut at 74 43’N is hovering around a freezing average with -6 for a low forecast for next Tuesday and 60% chance of snow on two of the days of the forecast:
http://www.wunderground.com/cgi-bin/findweather/getForecast?query=Resolute, Nunavut&wuSelect=WEATHER
With the Arctic Basin already freezing up, it looks like that part of the arctic alone is not only going to add on almost a half a million square kilometers (0.2million sq.m) of first year ice over last year (which itself had expanded 15% over the infamous 2007 year that was supposed to cause the ice to disappear because of the loss of albedo, dark earth, etc that was regurgitated in the above article) and add to the inventory of second and multiyear ice in the process:
http://arctic.atmos.uiuc.edu/cryosphere/IMAGES/recent365.anom.region.1.html
Lord one goes crazy hoping for a new ice age just for revenge on the destroyers of science.
More on the misleading rubbish in the NOAA Arctic Report Card referred to in the post above.
In the headline sentence they say,
In general, the Arctic Ocean continued to warm and freshen in 2007 under the influence of unusual atmospheric forcing.
Sounds pretty clear cut doesn’t it. Climate forcings are the cause of the Arctic Ocean warming?
But then immediately after in the detail they say,
The circulation of the sea ice cover and ocean surface layer are closely coupled and are primarily wind-driven
So in fact when they say ‘atmospheric forcing’ they mean by this term ‘weather’.
The NOAA are saying weather has caused the Arctic sea ice decline and not climate change.
The whole of the NOAA’s Arctic Report Card is full of this kind of this kind of misleading dishonesty.
I think the data would be more telling by graphing annual Tmax and annual Tmin, I suspect like most weather stations you would find the “warming” occurs on the coldest days of winter, and the hottest days remain unchanged or become slightly cooler. This does not imply melting for the arctic, but instead a more stable climate. Using annual average 2m temperature is also a poor indicator of temperature change.
Plus comparing current temps against some untested proxy is typically a waste of time, and splicing the data normally results in the “dramatic warming” which occurs as a sudden step….hold on, didnt I see one above?
RW (15:23:30) : So in this case, that’s a drop of 1.3%. 1.3% less solar radiation is a huge forcing. Why didn’t you do some simple sums like this before coming to a conclusion?
600,000 miles over 2,000 years. 1.3% over 2,000 years or .065% per century. Hence if you subscribe to the end of the LIA in 1850 or so then a change of .0975% between then and now. If you accept the end of the LIA at around the early 1900s then the change is only .065%. .1% change in solar radiation across the last century is about a cooling of .05 degrees C. Buried so deep inside natural variability that it is almost meaningless. Probably well inside the level of uncertainty in the study.
So then one has to question. 1850 years at .065% per century is 1.2 percent or about .6 to 1.2 degrees C. With that amount of cooling caused by decrease in solar radiation how it the world did the earth escape the LIA …. long before man started pumping massive amounts of CO2 into the atmosphere.
Philip_B (15:10:50) : said
“I’ve speculated before that global cooling contributed to the decline of the Roman Empire and specifically caused their abrupt and unexplained departure from Britain.
That temperature decline exactly coincided with the 20 or 30 year period the Romans are known to have left Britain and the reason likely would have been a decline in British wheat production, which was Britain’s main export under Roman rule.”
Your hypotheses about Roman Britain is well established and described in a number of books.
http://www.bates.edu/x164370.xml
Climate change in Europe also helped to cause the end of their civilisation there, although there were many other contributory factors as well.
tonyb