The Solar and Heliospheric Observatory (SOHO) satellite is back in operation after some required downtime to keep it operating.
Alas, it didn’t miss anything, the sun remains spotless.

From Spaceweather.com
According to NOAA sunspot counts, the longest stretch of spotless suns during the current solar minimum was 52 days in July, August and Sept. of 2008. The current spate of blank suns is putting that record in jeopardy. There have been no sunspots for almost 42 days and there are none in the offing. Deep solar minimum continues.
Spotless Days
Current Stretch: 42 days
2009 total: 184 days (79%)
Since 2004: 695 days
Typical Solar Min: 485 days
There’s some contention over that claim, as WUWT readers may recall that SIDC in Belgium last year retroactively counted a sunspeck from a drawing by Catainia observatory, nullifying the stretch of sunspotless days in August 2008. NOAA’s SWPC appears not to recognize that sunspeck and so their claim is for a 52 day stretch.
Will SIDC pull another sunspeck stunt this August? I’m sure they are “poreing” over the sketches now.
Joe D’Aleo puts this current stretch in perspective:
Today, Thursday, August 20th marked the 41st straight day without a sunspot, one of the longest stretches this solar minimum.

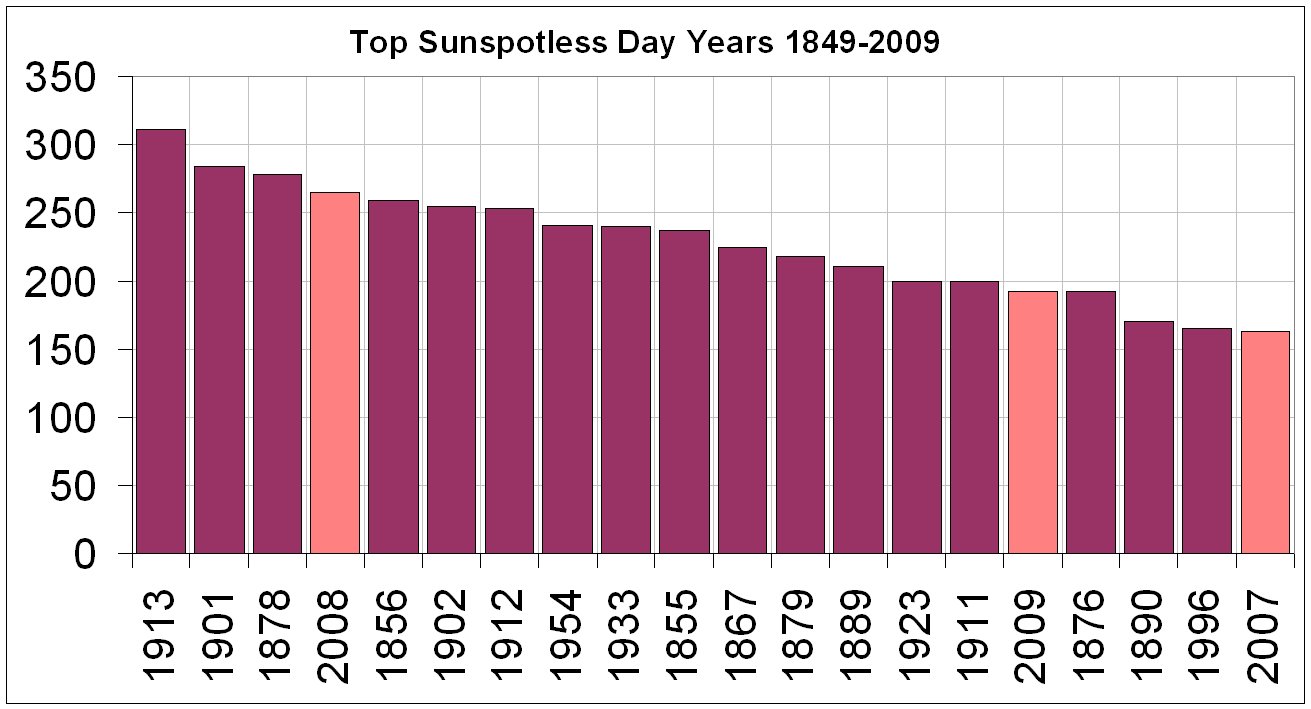
In fact it rises into 10th place among all spotless periods since 1849 (first table here). The total number of spotless days this transition from cycle 23 to 24 is now 694 rapidly approaching the approximate number leading into cycle 15 in the early 1900s (below, enlarged here).

We have had 183 spotless days this year (79% of the days). We are in the top 20 years in 17th place. We will very likely rapidly rise up the list in upcoming weeks and rival 2008’s 265 days and likely end in the top 5 years. 2007, 2008, 2009 will only have 1911, 1912, 1913 in the top 20 as string of 3 per transition (below, enlarged here).

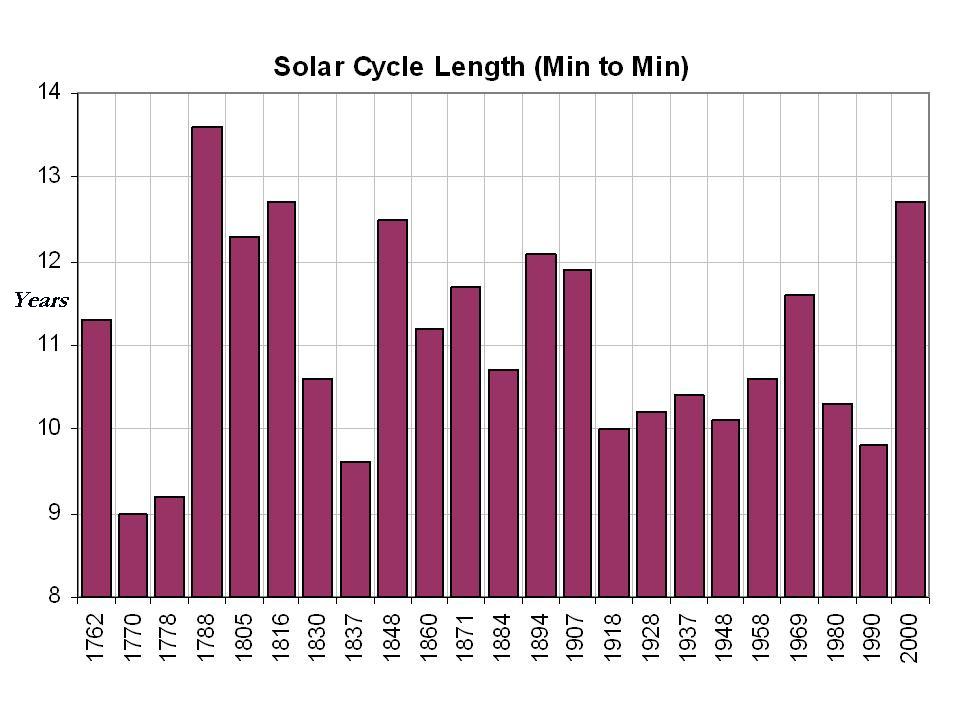
The cycle minimum probably was December, 2008. January 2009 13 month average came up a bit due to slight bump in activity in June and July but if August should end up sunspotless and September low, we could have a double bottom. The 12.7 years assuming December 2008 was longest in two centuries (below, enlarged here).

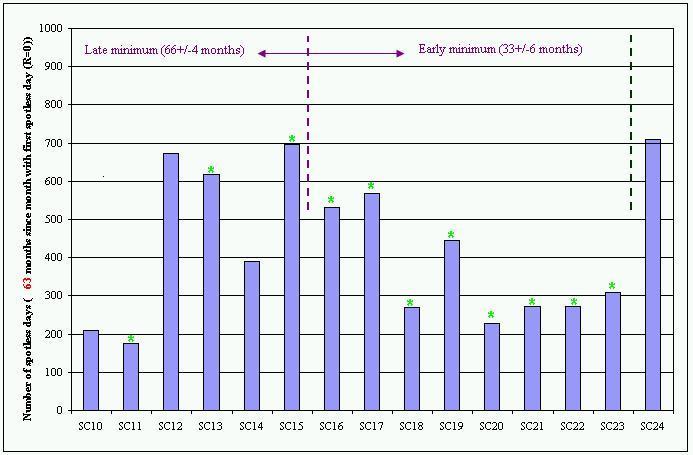
You can see on this chart, by 13 years after the solar minimum year, most of the last 5 cycles already had recovered, in one case already to the solar max (below, enlarged here).

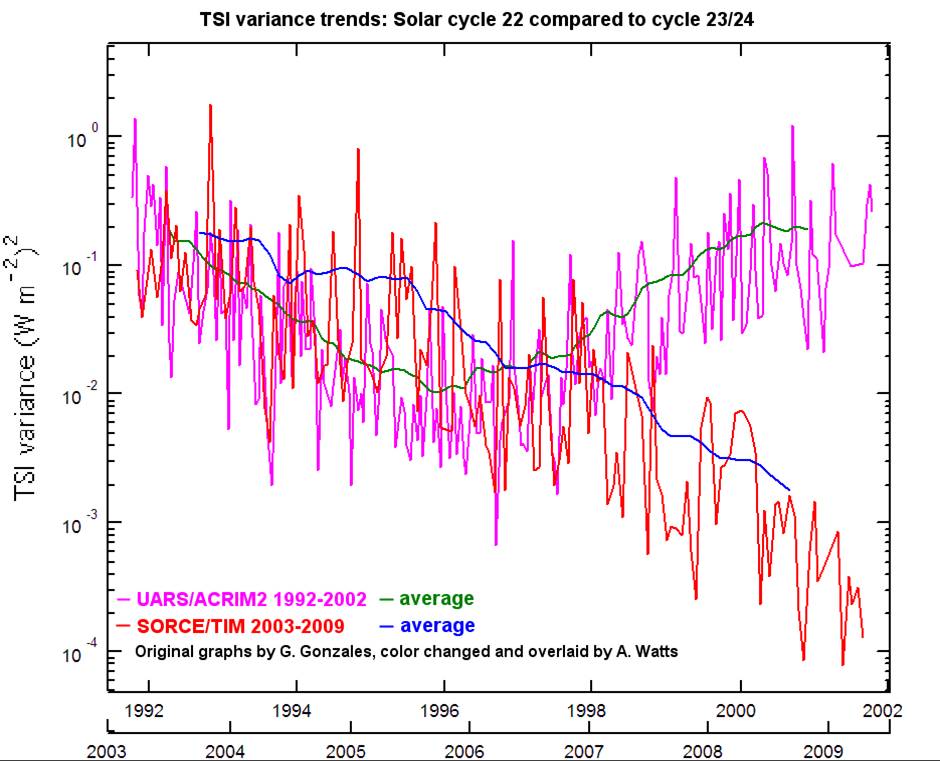
This cycle has continued to decline in the solar irradiance, solar flux, sunspot number and geomagnetic activity after 10 years. On the following chart produced by Anthony Watts, you can see the Total Solar Irradiance declining whereas the prior cycle was rebounding(below, enlarged here).

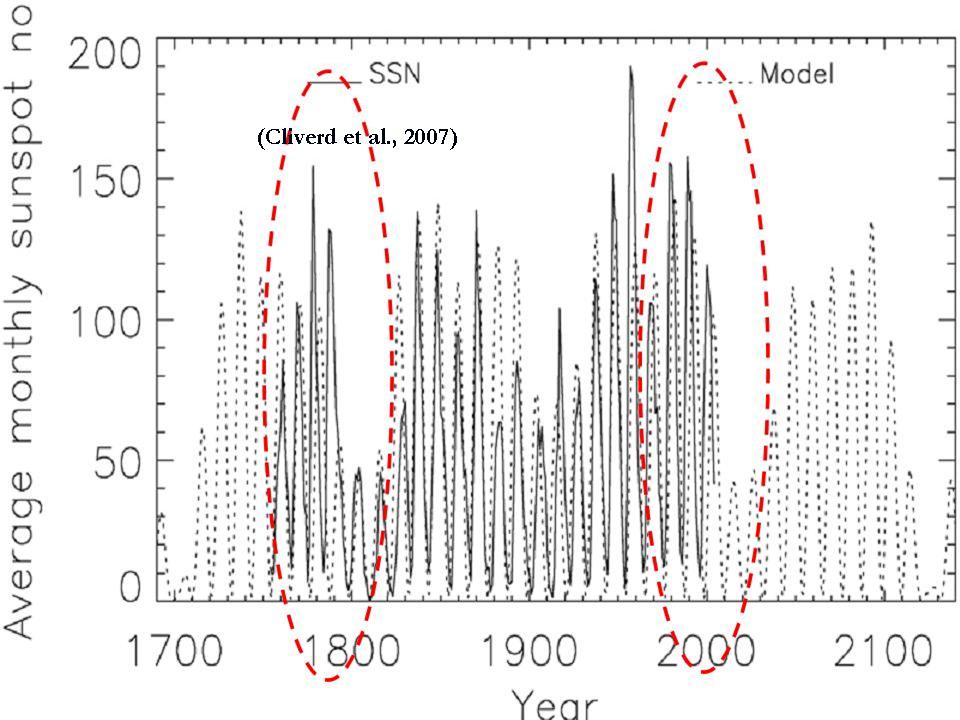
Clilverd et al 2006 suggests using a statistical analysis of the various cycles (11, 22, 53, 88, 105, 213, and 426 years) shows the next two cycles will likely be very quiet much like those of 200 years ago in the early 1800s, the so called Dalton Minimum, the time of Dickens (with snows and cold in London like last winter) (below, enlarged here).

See what David Archibald shows what the result might be if Clilverd is correct here. Some have not ruled out an even stronger Maunder like Minimum. See more complete PDF here.
Discover more from Watts Up With That?
Subscribe to get the latest posts sent to your email.
Richard (20:54:22) :
Global July Insolation = 302.82
Global Jan Insolation = 248.45
% age difference Insolation = 21.88
% age difference in Global Temperatures = 21.55
Those insolation figures look a bit high. Isn’t average insolation ~240 w/m2. Have you taken albedo into account. It probably doesn’t make much difference to the %age figures, though.
Steve M. 18:29:30 on 8/21
Thanks for the update. More popcorn. And more cowbell!
=====================================
Dr David Jones of Ferny Creek (14:33:38) :
“Anthony about time you came clean and admitted you have got climate change wrong.
The oceans are running warmest on record for summer, sea level is running at record highs for this time of year (not hiding behind a seasonal cycle), the satellite data would have been hottest were not for a large “correction” and this is all happening with a cold cold sun.
It’s got so warm out there even the “sceptics” are having trouble finding cold weather to talk about.
REPLY: Hah, doc, you make this too easy. Someday I’ll visit BoM and tell you all about it. I do find your demands amusing though, especially since it all turned on one month with the El Nino going from zero anomaly in UAH LT. Tell me, does climate happen in 1 month? 😉
Here’s a few to talk about at the water cooler at BoM.
http://latimesblogs.latimes.com/lanow/2009/08/las-cold-summer-continues-lancaster-posts-a-record-low-temperature.html
http://newsminer.com/news/2009/aug/21/fairbanks-flirts-frost-early-cold-weather-arrives/
http://www.nzherald.co.nz/business/news/article.cfm?c_id=3&objectid=10590529
I’m still pretty comfortable with my position. Time is on our side. Rant all you like. – Anthony”
Yes, Dr. Jones, you just confirmed the warmists attitude in regard to weather versus climate.
If the world is cooling for several years on a role, you call it “weather”.
If the world is warming for a single month, you call it “climate”.
Even stipulating that temperatures of all stripe warm slowly (at the 20th century rate), we would be continually setting new (instrumental) records, but there would be no emergency at all.
If, on the other hand, the short-term temperature trend suddenly reverses and increases at five times the rate of the past century, we would have the IPCC mainstream scenario of +3.5C, we would have cause for concern.
It’s all in the “degree”.
John Finn (03:32:23) :
Richard (20:54:22) :
Those insolation figures look a bit high. Isn’t average insolation ~240 w/m2. Have you taken albedo into account. It probably doesn’t make much difference to the %age figures, though.
Yes they probably are as that would reduce it. I took nothing into account except the TSI in Jan 3 and July 5 (roughly perihelion and aphelion), assumed other things equal and so would cancel out. I also calculated for just one latitude 60 N and S, again assuming that it would be matched for others (I did check with 50 and it matched). The agreement with the temperatures in Jan and July shows I probably was not very wrong.
Ron de Haan (06:16:39) :
Dr David Jones of Ferny Creek (14:33:38) :
“Anthony about time you came clean and admitted you have got climate change wrong.
The oceans are running warmest on record for summer, sea level is running at record highs for this time of year (not hiding behind a seasonal cycle), the satellite data would have been hottest were not for a large “correction” and this is all happening with a cold cold sun.
It’s got so warm out there even the “sceptics” are having trouble finding cold weather to talk about.”
Where the devil is Ferny Creek? And it aint a “cold cold sun”. The TSI which I am now tracking is about the same. What subjectively I know is that Solar wind is probably less (I dont know how to get the data or make sense of it), but effects of this are indirect and may not be immediate. We are still well within the range of natural variability, so relax.
Veggies have gone up in price. The NZ Herald business section article shows its better to be warm than cold.
I just looked up Ferny Creek, Victoria are you a b.. aussie mate? The temperature there today is 9 max and 3 min, colder than where I am in NZ, you shouldnt have any trouble finding cold weather to talk about.
Look at the BOM forecast for the next few days around Ferny Creek
Forecast for Tuesday
Cloudy. Scattered showers falling as snow above 900 m. The chance of thunderstorms with hail from the morning. Winds west to northwesterly averaging 45 to 55 km/h becoming northwesterly 45 to 60 km/h by early evening. Overnight temperatures falling to around 6 with daytime temperatures reaching between 8 and 13.
http://www.bom.gov.au/products/IDV17102.shtml
Guess that must be weather cause its COLD
The TSI is misleading.
Who needs a spectrum anyways?
Why bother imaging things with filters when we could just capture all the light in one short exposure without them?
So, if the NUV is up 20% but the FUV is down 20% it makes no difference, right?
So, if it’s 120 degrees all summer in the North and 0 degrees all winter in the South, we should consider that the same thing as 70 degrees all summer in the North and 50 degrees all winter in the South.
Right ?
It’s all about the average.
That’s why the TSI is misleading. It’s nothing more than a Solar Average.
It tells you nothing about the changes under the hood.
Besides, it’s been trashed so badly the remains are unidentifiable.
Bury it in the tomb of the Unknown Statistic.
Since insolation so accurately tracked the average satellite temperatures – made a little formula – playing around with insolation. Assuming clear skies (or the same skies) between years.
Comparing 2008 with 2009 – Insolation on June 19, 20, 21, 22 exactly the same for both years. 20 and 21 the same for both days, falls off on either side.
Insolation for June 2008 and 2009 practically the same.
On July 5th however, Aphelion, there is a discrepancy. Insolation more in 2009
Insolation for July more for 2009 than 2008, August more for 2009 and more of a difference than July, September more for 2009 marginally more than August, October more for 2009 same difference as Sept, (if this is true so far warmers should have a field day), Nov more for 09 but difference comes down to less than half of Sept, Dec a little less for 09, Jan 2010 more than Jan 2008 and biggest difference so far.
Here’s what I get for the coming years (assuming more insolation warmer less cooler)
2009 – warmer than 2008 a little less than 2007
2010 – warmer than 2009
2011 – a little warmer than 2010
2012 – much cooler than 2010 – the same or a little cooler than 2008
2013 – warmer than 2012, the same or a little less than 2009
2014 – warmer than 2013 a little less than 2010
2015 – as warm as 2011
2016 – cooler than 2012
2017 – a little warmer than 2008
Caveat – the difference in average insolations is not very large (euphemism for quite small) – could be swamped by other things – solar wind, el nino, nina, CO2, methane, Al Gore … I’m keeping an open mind. So dont hold your breath. Lets see how the coming months pan out.
I have put some figures on these predictions, (based on the insolation of previous years from 2002).
Global Anomalies (as per UAH) from 2002 to 2017 : 0.25, 0.21, 0.13, 0.27, 0.2, 0.22, -0.02, 0.2, 0.24, 0.27, -0.03, 0.2, 0.24, 0.27, -0.04, 0
If you plot the trendline for those figures its negative. If this prediction comes true what would be the significance?
NOAA has made the job of disproving the Anthropogenic Global Warming (AGW) hypothesis, through the temperature records, easier (maybe thats why they are being fiddled).
They ran 10 simulations spanning a period of 700 years and found 17 non-overlapping decades “with trends in ENSO-adjusted global mean temperature within the uncertainty range of the observed 1999–2008 trend (−0.05° to 0.05°C decade–1)”.
According to them “The simulations rule out (at the 95% level) zero trends for intervals of 15 yr or more, suggesting that an observed absence of warming of this duration is needed to create a discrepancy with the expected present-day warming rate.”
Their models never ever came up with 15 consecutive years where the trend was level or decreasing. If that happens, then AGW we have a problem.
http://www.ncdc.noaa.gov/oa/climate/research/2008/ann/bams/full-report.pdf
I’m curious about something. I consistently read about the current streak of spotless days being the latest since August last year. Yet, I never read about the 44 day streak starting 03/09/2009 – to – 04/20/08 (according to NOAA DSD).
http://www.swpc.noaa.gov/ftpdir/indices/old_indices/2009Q1_DSD.txt
http://www.swpc.noaa.gov/ftpdir/indices/old_indices/2009Q2_DSD.txt
Am I missing something?
HI-Z (10:42:39) :
I’m curious about something. I consistently read about the current streak of spotless days being the latest since August last year. Yet, I never read about the 44 day streak starting 03/09/2009 – to – 04/20/08 (according to NOAA DSD).
http://www.swpc.noaa.gov/ftpdir/indices/old_indices/2009Q1_DSD.txt
http://www.swpc.noaa.gov/ftpdir/indices/old_indices/2009Q2_DSD.txt
Am I missing something?
~~~~~~~~~~~~~~~~~~~~~~~~~~~~~~~~~~~~~~~~~
The one that always catches my eye though is that 52-day spotless stretch last year from 2008/07/21 through 2008/09/10. If this is exceeded in 2009, it will be a portentous event, IMHO.
http://www2.nict.go.jp/y/y223/sept/swcenter/sunspot.html
HI-Z (10:42:39) :
The early March – late April 2009 spotless streak is broken academically by, once again, very weak and/or fleeting and/or pores. Amounts that don’t amount to a pail of oil in a ship’s bunker.
Think about it.
You still had something like 43.97 spotless days.
rbateman (15:30:35) :
HI-Z (10:42:39) :
The early March – late April 2009 spotless streak is broken academically by, once again, very weak and/or fleeting and/or pores. Amounts that don’t amount to a pail of oil in a ship’s bunker.
Think about it.
You still had something like 43.97 spotless days.
—————————————–
I understand there was a speck but what is unclear is the NOA DSD for that period doesn’t show a spot count for that day.
Sorry, NOAA DSD (links to DSD in first post)
The DSD doesn’t show the speck because most of the world saw nada.
Imagine how upset you’d be if you bought a burger with a crumb of beef in it.
SWPC/NOAA is right not to Hans & Franz the DSD.
( I sure wish there were a preview . I’m assuming most HTML works .
Richard , I’m very impressed by your work .
What are the most
useful data sources ? Are the details of your computations available
somewhere ? It’s not clear to me what specific heat rather than
absorptivity/emissivity has to do with mean , as opposed to variance of
the sphere .
Ultimately our observed average temperature must be quantifiably
derivable from the sun’s . Certainly unraveling the confounding of the
peri/ap-helion difference in TSI with difference in color , or even
just averaged grayvalue ( I avoid the use of albedo
because it is (1 – ) the relevant term and all too
commonly dissociated from emissivity )
, between the hemispheres is one of the first
tasks .
Given what my small vocabulary of functions so far are oriented to do ,
to
get a feel for how much of a change in
grayValue I’ve calculated what the difference in
grayValue would have to be between the day and night sides
cancel the peri/ap-helion difference .
Here’s the baseline computation for average distance :
  SAd..h />/ "Solid angle of disk of radius ( RD 0 ) at

distance RD 1 "

 : SAsun : SAd Sun `r `Dist  / />/

6.8001334e-005

 : SfeerPart : ( ( ( :: ; pi2 - ) .\: SAsun ) , pi2 ) % pi4 /

/>/ 5.41137e-006 0.499994 0.5

/ Portions of the "celestial sphere" subtended by the sun , the rest of

the day side , and the night side .

/ AE is the grayValue and Tcs the temperatures for each of the

partitions .
Tdif..h : "Difference in power
between a scalar point temperature and a surrounding temperature
distribution"
 AE : 1 1

1

;  Tcs : 5778 3 3.0     ;

?[ Tdif ; 0.0 ; 300.

]

/ />/ 278.67912

/ Call it , 278.68 given the lack of precision in the temperatures

.
/ It is instructive to show that a uniform
change in grayValue makes no
difference :
 AE : 1 1 1 * .7 ;  Tcs : 5778 3

3.0     ; ?[ Tdif ; 0.0 ; 300.

]

/ />/ 278.67912
Here are the calcs for the orbital extremes :
 : SAsun : SAd' 2 2 # Sun `r `perihelion `r

`aphelion

/>/ 7.0332229e-005 6.578442e-005

 : SfeerPart : ( ( ( :: ; pi2 - ) .\: SAsun 0 ) , pi2 ) % pi4

/>/ 5.5968609e-006 0.4999944 0.5

 AE : 1 1 1

;  Tcs : 5778 3 3.0     ;

?[ Tdif ; 0.0 ; 300.

]

/ />/ 281.03711

 : SfeerPart : ( ( ( :: ; pi2 - ) .\: SAsun 1 ) , pi2 ) % pi4

/>/ 5.2349578e-006 0.49999477 0.5

 AE : 1 1 1

;  Tcs : 5778 3 3.0     ;

?[ Tdif ; 0.0 ; 300.

]

/ />/ 276.37951

 % %/ 276.37951 281.03711 />/ 1.0168522

 r ^ 4 />/ 1.069132
Now solve for a grayValue deviation between light and dark side :
 { AE :: .7 + x , x , - x  ;

Tcs :: 5778 3 3.0  ;  278.68 - ?[ Tdif ; 0.0

; 300. ] } ? 0 />/ 0.023598908

 { AE :: .7 + x , x , - x ; Tcs :: 5778 3

3.0     ; 278.68 - ?[ Tdif ; 0.0 ;

300. ] } ? 0 />/ -0.023190297
So a difference in AE
from day side to night side of somewhat less than 5% would balance the
current orbital eccentricity .
After I get full spectrum implemented , I’ll have to tackle the
spherical geometry more completely . But I really have other interests
, and hopefully this global government Lysenko scam will be
defeated before I get to it .