The Solar and Heliospheric Observatory (SOHO) satellite is back in operation after some required downtime to keep it operating.
Alas, it didn’t miss anything, the sun remains spotless.

From Spaceweather.com
According to NOAA sunspot counts, the longest stretch of spotless suns during the current solar minimum was 52 days in July, August and Sept. of 2008. The current spate of blank suns is putting that record in jeopardy. There have been no sunspots for almost 42 days and there are none in the offing. Deep solar minimum continues.
Spotless Days
Current Stretch: 42 days
2009 total: 184 days (79%)
Since 2004: 695 days
Typical Solar Min: 485 days
There’s some contention over that claim, as WUWT readers may recall that SIDC in Belgium last year retroactively counted a sunspeck from a drawing by Catainia observatory, nullifying the stretch of sunspotless days in August 2008. NOAA’s SWPC appears not to recognize that sunspeck and so their claim is for a 52 day stretch.
Will SIDC pull another sunspeck stunt this August? I’m sure they are “poreing” over the sketches now.
Joe D’Aleo puts this current stretch in perspective:
Today, Thursday, August 20th marked the 41st straight day without a sunspot, one of the longest stretches this solar minimum.

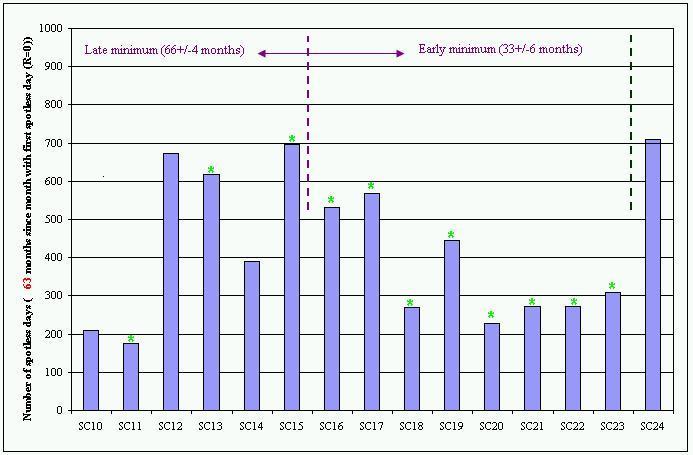
In fact it rises into 10th place among all spotless periods since 1849 (first table here). The total number of spotless days this transition from cycle 23 to 24 is now 694 rapidly approaching the approximate number leading into cycle 15 in the early 1900s (below, enlarged here).

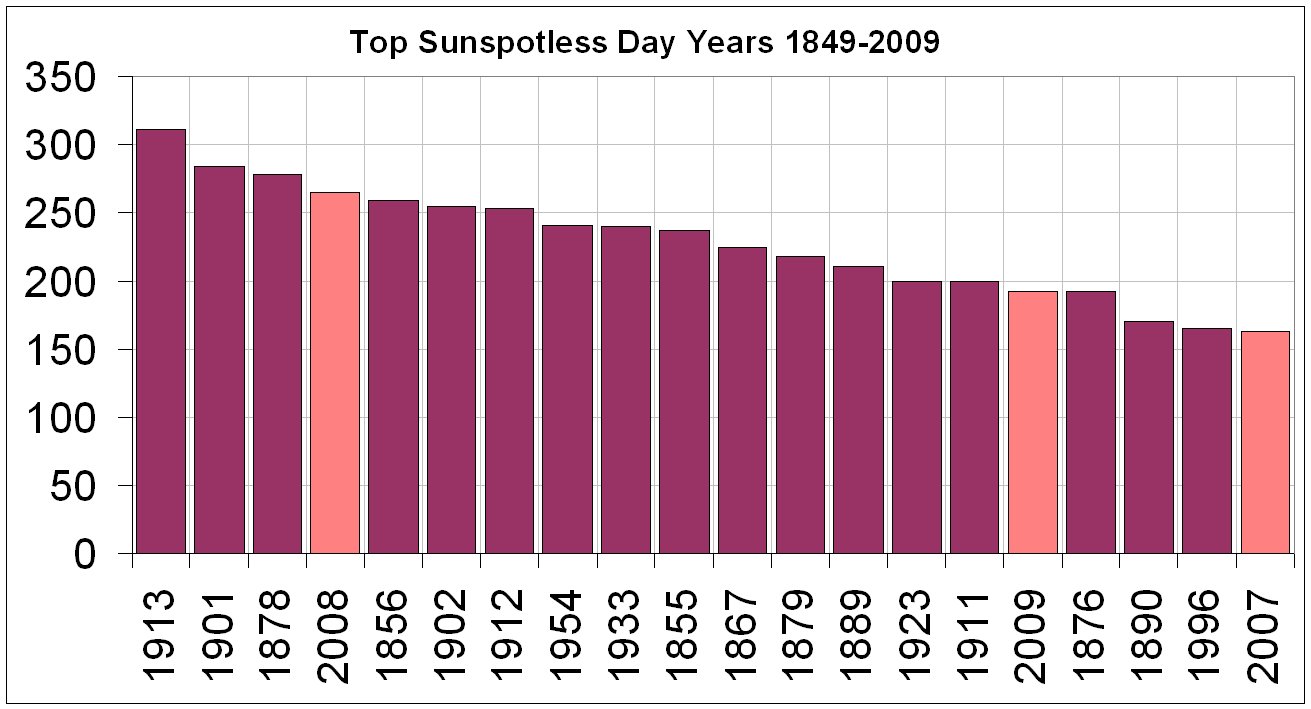
We have had 183 spotless days this year (79% of the days). We are in the top 20 years in 17th place. We will very likely rapidly rise up the list in upcoming weeks and rival 2008’s 265 days and likely end in the top 5 years. 2007, 2008, 2009 will only have 1911, 1912, 1913 in the top 20 as string of 3 per transition (below, enlarged here).

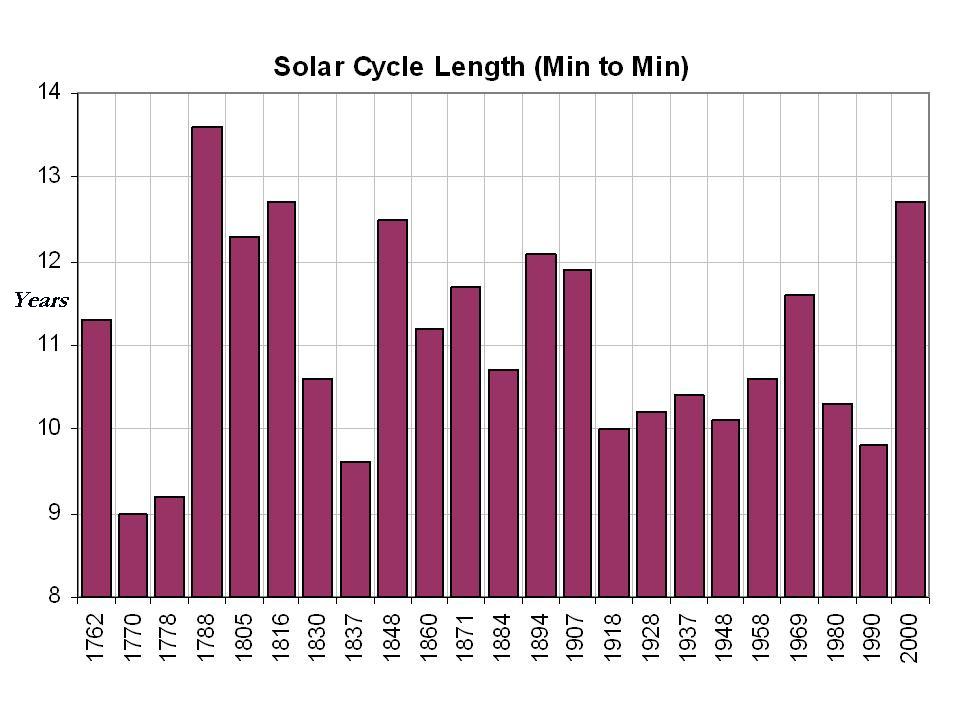
The cycle minimum probably was December, 2008. January 2009 13 month average came up a bit due to slight bump in activity in June and July but if August should end up sunspotless and September low, we could have a double bottom. The 12.7 years assuming December 2008 was longest in two centuries (below, enlarged here).

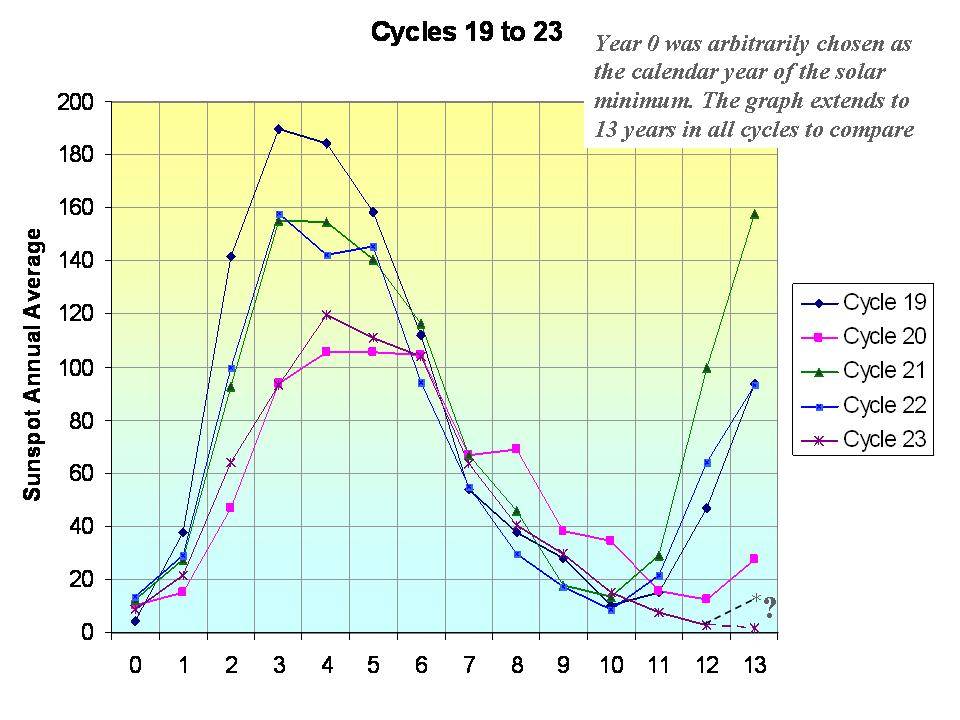
You can see on this chart, by 13 years after the solar minimum year, most of the last 5 cycles already had recovered, in one case already to the solar max (below, enlarged here).

This cycle has continued to decline in the solar irradiance, solar flux, sunspot number and geomagnetic activity after 10 years. On the following chart produced by Anthony Watts, you can see the Total Solar Irradiance declining whereas the prior cycle was rebounding(below, enlarged here).
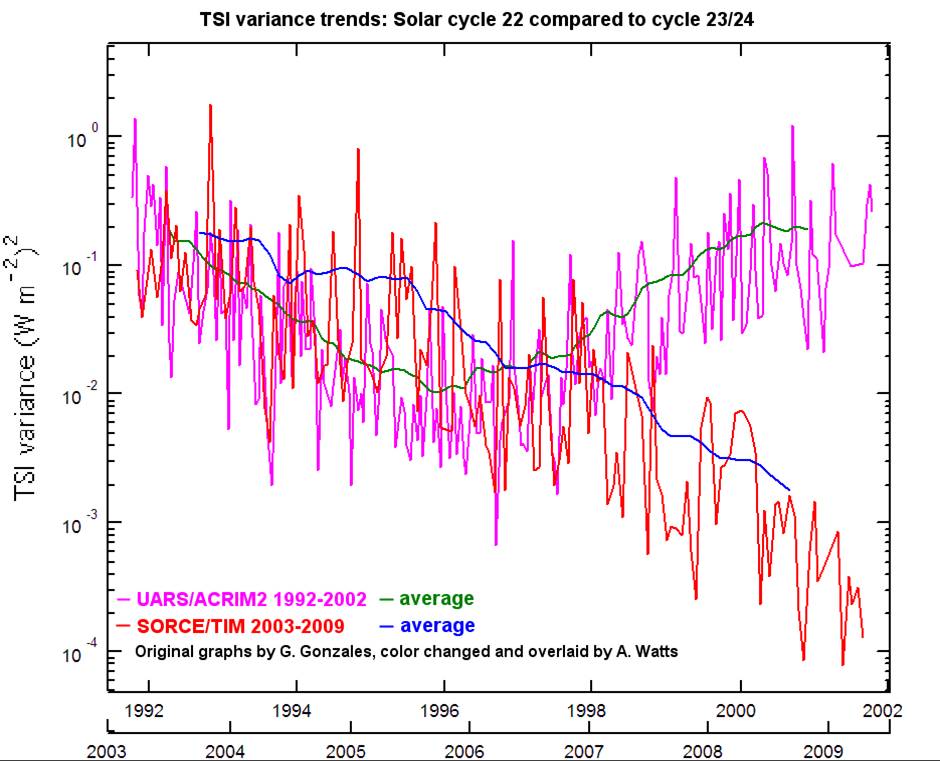

Clilverd et al 2006 suggests using a statistical analysis of the various cycles (11, 22, 53, 88, 105, 213, and 426 years) shows the next two cycles will likely be very quiet much like those of 200 years ago in the early 1800s, the so called Dalton Minimum, the time of Dickens (with snows and cold in London like last winter) (below, enlarged here).
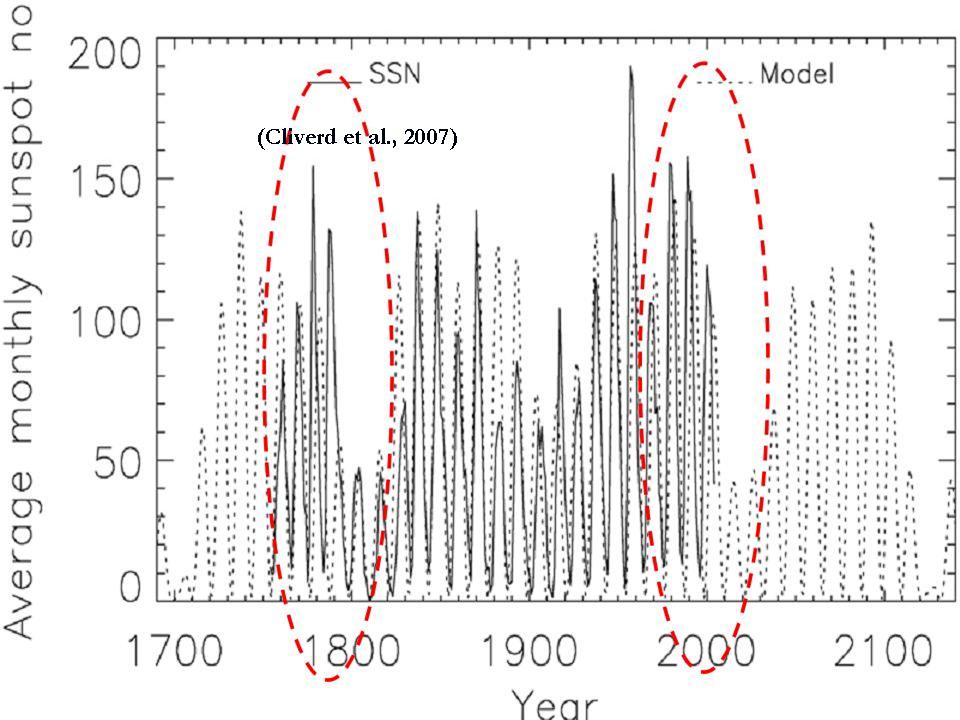

See what David Archibald shows what the result might be if Clilverd is correct here. Some have not ruled out an even stronger Maunder like Minimum. See more complete PDF here.
Discover more from Watts Up With That?
Subscribe to get the latest posts sent to your email.
Methinks it’s a function of thermometers…there’s more in the Northern Hemisphere. Yet another reason to treat global averages with
contempt…I mean suspicion. 🙂vukcevic (14:50:06) :
I would have to agree with (Clilverd et al 2006) projections for future solar activity since it is in a good agreement with my formula (Jan 2004)
http://xxx.lanl.gov/ftp/astro-ph/papers/0401/0401107.pdf
http://www.vukcevic.co.uk/combined.gif
but I am not certain that climatic downturn would be that severe.
I would suggest in addition to SSN and TSI numbers one might keep an eye on the Earth’s magnetic field as seen here:
http://www.vukcevic.talktalk.net/GeoMagField.gif
——
Good co-relationship (of the earth’s magnetic field with short term global average temperatures).
We still need to keep asking “Why”? however, and develop a relationship between short term magnetic field changes and recorded temperatutes.
If short term temperatures cycle at a 60-80 period, we need to be able to determine why the magnetic field changes at that periodicity.
Can geomagnetism better explain the long-term rise in temperatures from the mid-1750’s? So far – that long term cycle is totally unexplained.
What are the “historical proxies” for the earth’s magnetic field over the past 2000 years?
How do those proxies – if available, if ever developed! – track with the well known Roman Warming Period, Dark Ages, MWP, and LIA?
“Carsten Arnholm, Norway (14:23:50) :
Mr. Alex (11:22:03) :
There were 3 pores in Late July/Early August and although invisible to most (clean) telescopes, this ‘clearly indicates’ that SC 24 is now ramping up.
However, if we check Leifs graph we find that those pores were of SC23 magnetic signature. So I guess it means SC23 is ramping up again then :-)”
So true, I can’t believe I missed that!
Leif explains the reason for adding these to his graph on the SC24.com thread, I must read it again.
Solar Flux is at 66 today… not looking too strong if you ask me.
Richard (01:52:25) :
“I’m also a bit concerned that the solar activity peak, i.e. the “grand maximum” peak, was in the early 1990s which was nearly 20 years ago. SC23 was a fairly average cycle in terms of SSN. The temperature dip in 2008 was claimed by many to be solar-related when it was, in fact, simply due to a long-overdue La Nina.”
Cycles 21, and 22 were both short, solar cycle 23 is currently the longest in 200 years, this deep minimum only began in 2006/2007 so if there is any effect on climate it will only be seen in +- 7 or 8 years time. Not a guaranteed mini ice age, but the theories will be put to the test soon.
Landscheidt predicted a weak SC 24 before his death in 2004 and so far it is weak, but things may change so we must wait.
Richard (01:48:07) :
I have a question for anyone. It seems that every year the “Global temperatures” peak in July and they are the minimum in January. July max is about 2.9 C warmer than Jan min.
http://discover.itsc.uah.edu/amsutemps/execute.csh?amsutemps
Now why should this be so? When it is summer in the northern hemisphere its winter in the Southern and vice versa. Why should temperatures vary in this way? Specially since aphelion also falls in July, if anything July should be colder
More land mass in the NH. Temperatures are more extreme over land than over sea. So you get warmer summers and colder winters in the NH, causing the oscillation you see in the global average over the course of the year.
Re: SOHO Up and Running…
The ESA show quite a bit of sunspot activity for the month of August.
http://www.cfbw.com/sunspotcount.htm
The chart’s originator credits both ESA and NOAA for the data.
Where did they find them?
Richard (01:48:07) :
I have a question for anyone. It seems that every year the “Global temperatures” peak in July and they are the minimum in January. July max is about 2.9 C warmer than Jan min.
I wonder what the difference is during an ice age.
It appears that yesterday the Adjusted Solar Flux dropped to and maintained an almost 6 month low.
ftp://lynx.drao.nrc.ca/pub/solar/FLUX_DATA/fluxtablerolling.text
Aside from the implication that we may have just experienced a reversal in the polarity of the Watts Effects, I also think we are due for a Svalgaard Solar Diagnostic/Flux Update.
Just had this reply from someone, hidden behind a tree, in another blog.
It’s a cut cut&paste from my original which I can’t get to but basically I say;
“Co2 and how it absorbs IR and re-radiates”
Treeman’s reply is;
“Is this serious? CO2 absorbing IR? A gas absorbing IR? IR goes through my body, trees, concrete and some heavy metals and you expect us to believe that CO2 a gas absorbs it? This is a joke right? What kind of science is this? And exactly what happens during that activity and “re-radiation”? How does a gas radiate IR? Interesting science there professor.”
No wonder many Aussies are up for an ETS when they have no clue.
George Kominiak (06:09:43) :
Better question is: How did that graph wind up at Central Florida Bird Watchers?
ESA and NOAA ??
Perhaps they meant Eastern Swan Appreciators and National Osprey and Albatross Admirers, and ended up with somebody’s pore count.
Just The Facts (07:06:34) :
Sure enough, a 5-6 month Solar Flux Roll burn has been completed.
That’s only part of the reason. It’s also an artifact of where the thermometers are that are used to calculate the anomaly. For most of the time that records have been kept, only land temperatures were included, so the “over sea/over land” argument doesn’t hold much water.
If you divide the earth into 20° latitude bands pole to pole and compare the numbers of thermometers used to calculate the GISSTemp anomaly in the southern 60° and northern 60° by decade starting in the decade ending in 1939, this is what you get:
Decade Ending Southern 60° Northern 60°
1939 233 2895
1949 281 3336
1959 399 4746
1969 566 5737
1979 699 5818
1989 588 5194
1999 253 2469
2009 129 1597
One would expect a strong northern hemisphere bias in any global anomaly calculation. Note that the northern hemisphere thermometers generally represent over 90% of the measurements in every decade.
So while it may be true that temperature swings are larger over land than ocean and 2/3 of the world’s landmass is in the northern hemisphere, it’s also where 90% of the thermometers have been for most of the measured record.
For a far more detailed discussion of how thermometer locations may affect the anomaly, see E.M. Smith’s analysis:
http://chiefio.wordpress.com/2009/08/17/thermometer-years-by-latitude-warm-globe/
rbateman (08:08:29) :
“a 5-6 month Solar Flux Roll burn has been completed.”
Can you elaborate on that, i.e. what’s a “Roll burn”?
Would this indicate that the downtrend in F10.7 that began in April is likely to reverse itself, continue or neither?
http://www.leif.org/research/TSI-SORCE-2008-now.png
I wonder what the odds are for the next sunspots to be cycle 25 rather than cycle 24?
Just The Facts (08:46:23) :
The Roll Burn is nothing more than some humor injected into a dry subject.
The Flux began a roll upwards in late March/early April with a step up of 2 Flux Units, since then it leveled off and began a roll back down.
What does it indicate? It indicates it wasn’t the ramp angle.
If this is the 1st of those 4 rolls on the Way to the Dalton’s House of SC5, it is one of many.
If it is the prelude to another step up, then do your comparisons and make your educated guess.
Watts Up with What the Sun does next: Ramp, roll or step?
One can only hope we don’t have to wait another 5 months to get the answer, but that’s how this thing strings us along.
Maddening, isn’t it?
JLKrueger (03:35:22) :
Richard (01:48:07) : .. It seems that every year the “Global temperatures” peak in July and they are the minimum in January. July max is about 2.9 C warmer than Jan min. .. why should this be so?
“Methinks it’s a function of thermometers…there’s more in the Northern Hemisphere.”
No this is real. It comes from the satellite temperatures that cover the world evenly.
Its for every year and it follows a roughly sinusoidal curve, exactly out of phase with the TSI graph. TSI (The suns radiance) peaks in Jan and is minimum in July and the temperatures peak in July and are minimum in Jan. I find that rather strange.
Basil (05:38:25) :
More land mass in the NH. Temperatures are more extreme over land than over sea. So you get warmer summers and colder winters in the NH, causing the oscillation you see in the global average over the course of the year.
This is plausible. But this would also mean that the TSI, which fluctuates out of phase with the Global temperatures, either has an almost negligible effect on the temperatures, or that its effect is delayed for some reason by 6 months.
Peak TSI is 91 W/m^2 more in Jan than the minimum in July or about 6.9 % more, whereas peak temperatures are about 3 C more (re averaged over 6 years) in July than the minimum in Jan or about 21.5 % more if you take the absolute temperatures.
Dave (06:51:12) :
I wonder what the difference is during an ice age.
Well the difference should be less. Cooler summers means less winter ice melts. And looking at the curves I can see that the difference is not even over the years.
Maybe that will give a clue whether we are heading for. If the difference is less during one year maybe the next year will be cooler. I will investigate.
TSI (The suns radiance) peaks in Jan and is minimum in July and the temperatures peak in July and are minimum in Jan. I find that rather strange.
Not really. As was said perviously, there’s much more land mass in the NH, and Surface temps are a lot more volatile over land and respond to the seasons more. This overcomes the TSI factor (which may or may not be negligible).
When the equinox is the other way, the seasons are reversed. That cycle completes c. every 23,000 years.
I wonder what the difference is during an ice age.
My understanding is that mild winters and mild summers can lead to an ice age because the ice gets less chance to melt, thus increasing albedo. In the more extreme summers/winters, the ice has much more opportunity to melt.
That’s where Obliquity comes into the equation. Less extreme axial angle leads to less extreme seasons.
PS I asked Dr Roy Spencer about this (after all they are his graphs, produced by him that is) and Basil you are right.
Hi Richard: It’s because most of the land is in the Northern Hemisphere, and land reaches a higher temperature than ocean under the same amount of sunlight. -Roy
Only thing is the sunlight is not the same, it is less in July, but only by 6.9%. The difference between the heating of the land and the oceans however would be so great as to completely nullify that.
While NOAA’s “daily solar data” still shows no spots over the past 30 days, their monthly data for July now shows sunspot numbers of 8 on 7/23 and 7/30.
ftp://ftp.ngdc.noaa.gov/STP/SOLAR_DATA/SUNSPOT_NUMBERS/
NOAA’s monthly sunspot numbers seem to come from the SIDC. You can see the same numbers here:
http://sidc.oma.be/products/ri_hemispheric/
Based on this, even the NOAA data says that we’ve only seen 22 spotless days. Have I missed something?
Steve (12:14:23) :
Have I missed something?
Apparently you are not the only one who missed spots so faint, small and brief that most of the world never caught glimse #1.
I believe one was so bad that the institution that drew the spot couldn’t capture it on it’s imaging train.
It’s like this: spots that insignificant have as much impact on and relevance to levels of solar activity as a drop of gas in your empty fuel tank.
Neither one is going to get things moving.
If tomorrow the level of C02 rose by 1 ppm or the Sea Level by 0.1 mm, would you be impressed?
Of course, Al Gore would be stoked , but then there is only 1 Al Gore.
Is anyone impressed by a sunspot of 2 x 10E-6 area, and the contrast of an erased pencil dot on a piece of off-white paper in a stack of 42 pages?
“Lookouts, is the enemy still closing on us?”
‘Captain, there’s an ice cube in the water dead ahead 1000 meters.’
“Sound collision, right full rudder, all ahead flank, brace for impact !!!
Prepare the life-boats, all hands, abandon ship.”
rbateman (09:29:41) :
“Maddening, isn’t it?”
I am ok with the solar uncertainty, what drives me crazy is that humans are aggressively and exclusively preparing for catastrophic CO2 driven global warming, when it is as reasonable a possibility that we will experience catastrophic Solar/Volcanic driven global cooling. Historians may look back at this as one of the dumbest periods in human history…
Mid-range and maybe faltering. Indicators are patchy, but a continued El Nino is projected.
http://www.bom.gov.au/climate/enso/
Richard (11:05:32) :
Hi Richard: It’s because most of the land is in the Northern Hemisphere, and land reaches a higher temperature than ocean under the same amount of sunlight. -Roy
I finally managed to crack it using insolation and the specific heat of water 1 and land 0.2
The July insolation at 60 N Lat x land area NH + The July insolation at 60 N Lat x water area NH/5 + The July insolation at 60 S Lat x land area SH + The July insolation at 60 S Lat x water area SH/5
and the same for Jan
Global July Insolation = 302.82
Global Jan Insolation = 248.45
% age difference Insolation = 21.88
% age difference in Global Temperatures = 21.55
Take home message insolation is pretty much all that matters.
Just The Facts (20:25:47) :
They aren’t even preparing for what they preach. Assured failure..
Adam Grey (20:44:49) :
A projected El Nino Minimum.
Monkey see, monkey do.