The Solar and Heliospheric Observatory (SOHO) satellite is back in operation after some required downtime to keep it operating.
Alas, it didn’t miss anything, the sun remains spotless.

From Spaceweather.com
According to NOAA sunspot counts, the longest stretch of spotless suns during the current solar minimum was 52 days in July, August and Sept. of 2008. The current spate of blank suns is putting that record in jeopardy. There have been no sunspots for almost 42 days and there are none in the offing. Deep solar minimum continues.
Spotless Days
Current Stretch: 42 days
2009 total: 184 days (79%)
Since 2004: 695 days
Typical Solar Min: 485 days
There’s some contention over that claim, as WUWT readers may recall that SIDC in Belgium last year retroactively counted a sunspeck from a drawing by Catainia observatory, nullifying the stretch of sunspotless days in August 2008. NOAA’s SWPC appears not to recognize that sunspeck and so their claim is for a 52 day stretch.
Will SIDC pull another sunspeck stunt this August? I’m sure they are “poreing” over the sketches now.
Joe D’Aleo puts this current stretch in perspective:
Today, Thursday, August 20th marked the 41st straight day without a sunspot, one of the longest stretches this solar minimum.

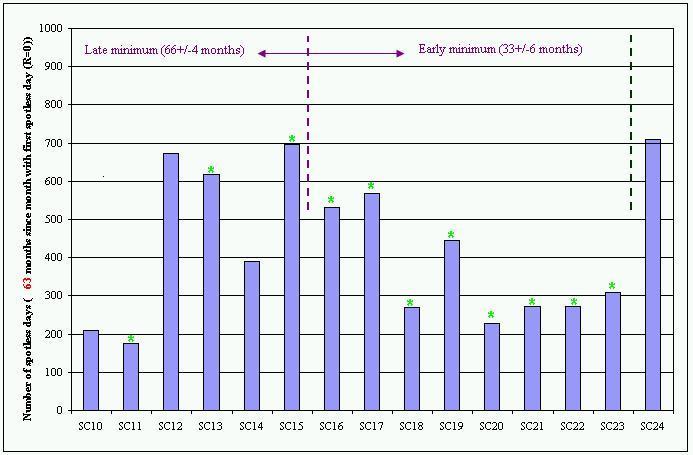
In fact it rises into 10th place among all spotless periods since 1849 (first table here). The total number of spotless days this transition from cycle 23 to 24 is now 694 rapidly approaching the approximate number leading into cycle 15 in the early 1900s (below, enlarged here).

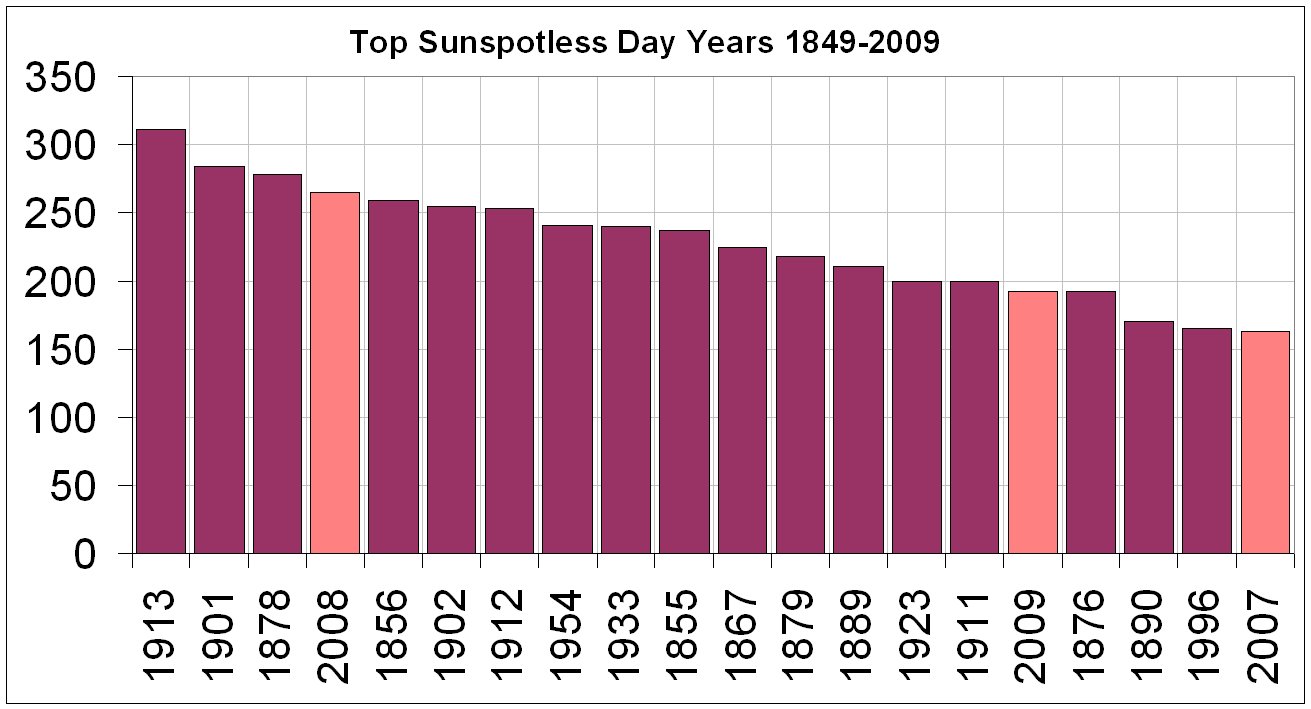
We have had 183 spotless days this year (79% of the days). We are in the top 20 years in 17th place. We will very likely rapidly rise up the list in upcoming weeks and rival 2008’s 265 days and likely end in the top 5 years. 2007, 2008, 2009 will only have 1911, 1912, 1913 in the top 20 as string of 3 per transition (below, enlarged here).

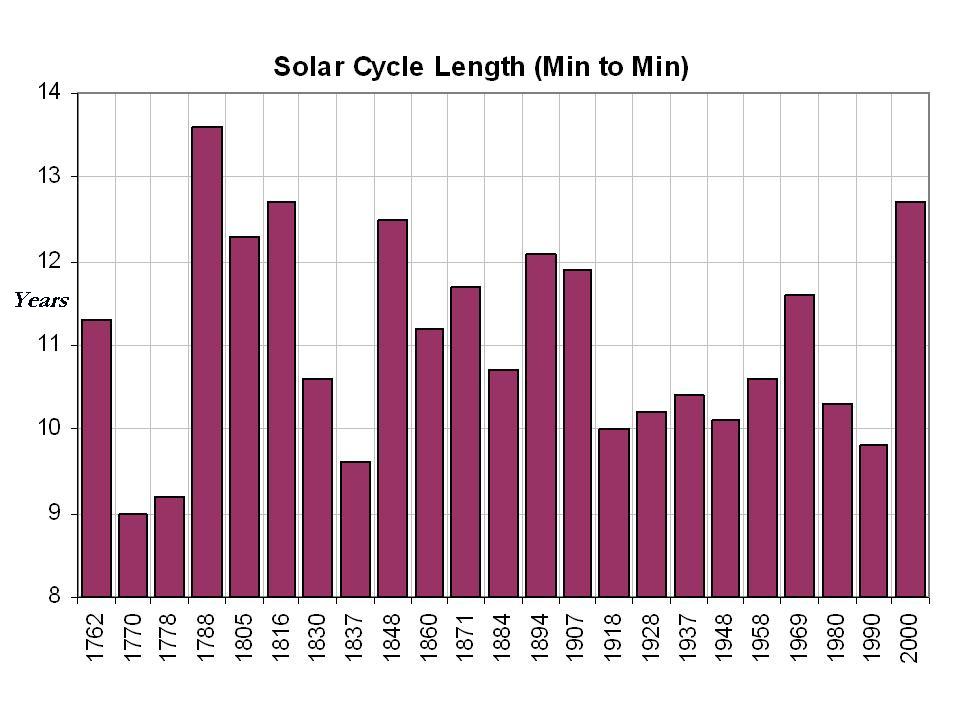
The cycle minimum probably was December, 2008. January 2009 13 month average came up a bit due to slight bump in activity in June and July but if August should end up sunspotless and September low, we could have a double bottom. The 12.7 years assuming December 2008 was longest in two centuries (below, enlarged here).

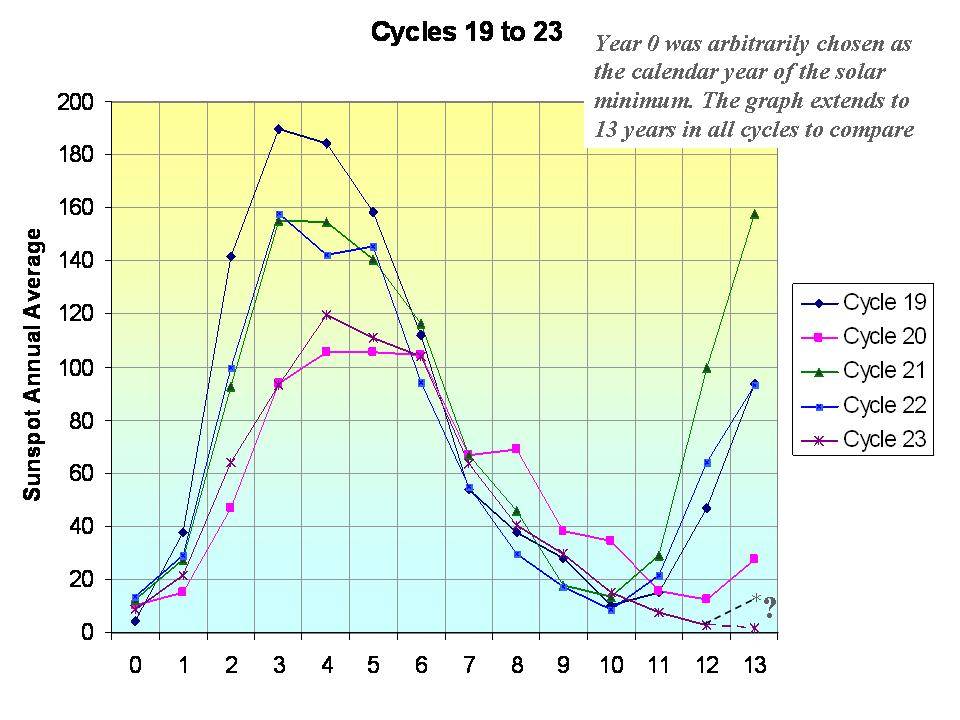
You can see on this chart, by 13 years after the solar minimum year, most of the last 5 cycles already had recovered, in one case already to the solar max (below, enlarged here).

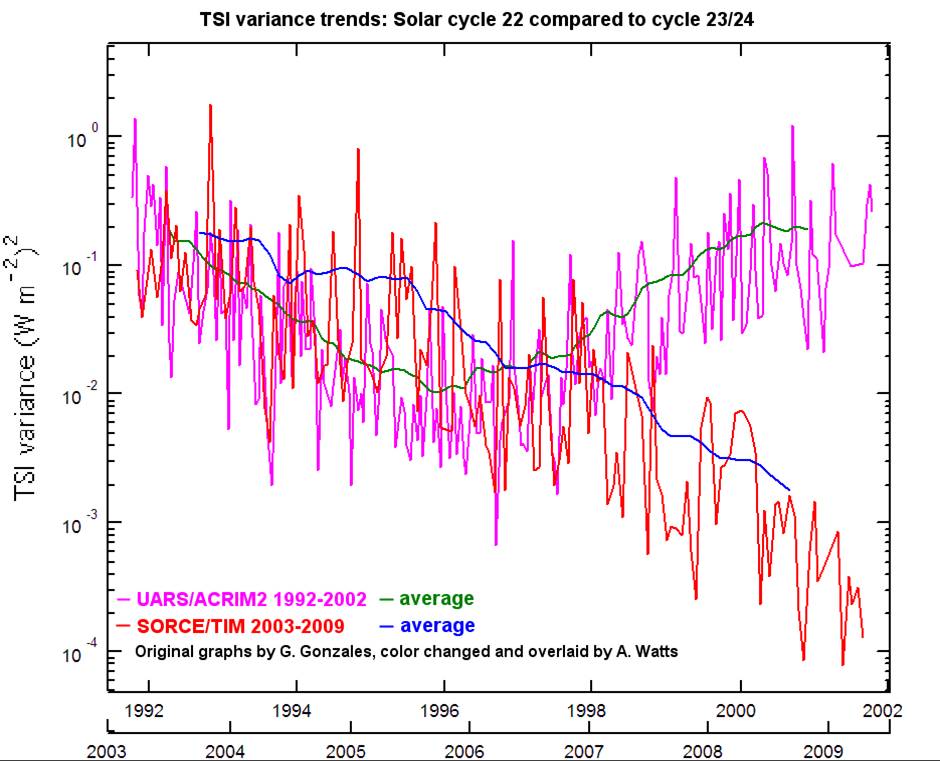
This cycle has continued to decline in the solar irradiance, solar flux, sunspot number and geomagnetic activity after 10 years. On the following chart produced by Anthony Watts, you can see the Total Solar Irradiance declining whereas the prior cycle was rebounding(below, enlarged here).

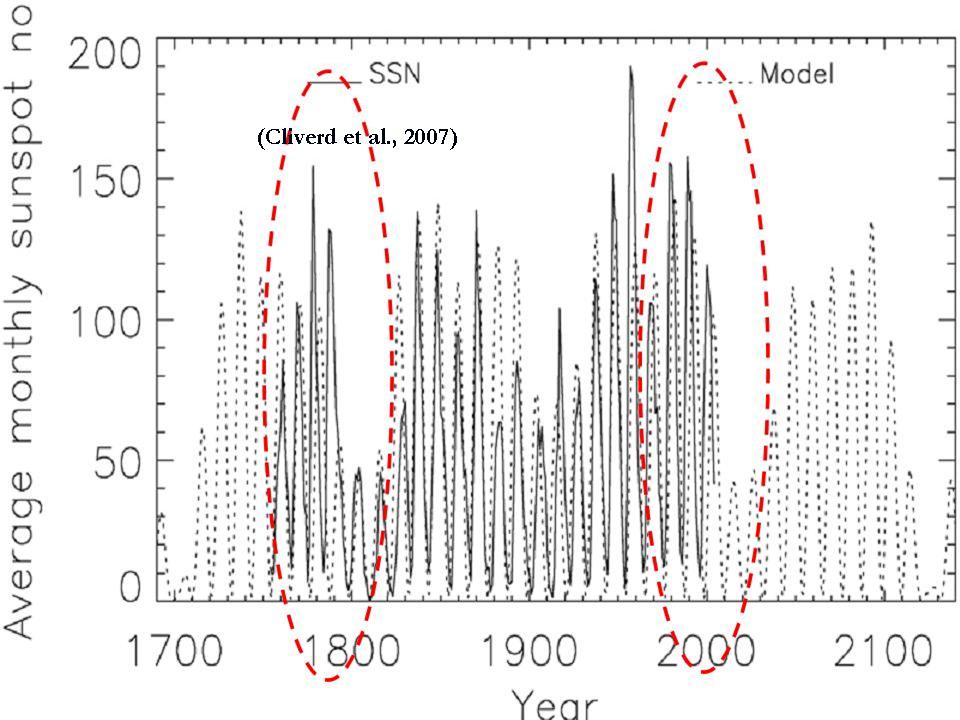
Clilverd et al 2006 suggests using a statistical analysis of the various cycles (11, 22, 53, 88, 105, 213, and 426 years) shows the next two cycles will likely be very quiet much like those of 200 years ago in the early 1800s, the so called Dalton Minimum, the time of Dickens (with snows and cold in London like last winter) (below, enlarged here).

See what David Archibald shows what the result might be if Clilverd is correct here. Some have not ruled out an even stronger Maunder like Minimum. See more complete PDF here.
Discover more from Watts Up With That?
Subscribe to get the latest posts sent to your email.
Lance (11:49:59) :
the news media will be scrambling over each other to state they were the first to bring this to our attention
The best advice to the media:
Before it’s too late put someone, on a 24 hrs. shift , to read WUWT, so you’ll be informed in advance.
Michael (10:46:45) : “We live in interesting times. Is this a blessing or a curse?”
An old Spanish blessing/proverb goes: “Que no hayan novedades,” which translates as “May no new thing arise.”
New things, by their nature, being bad of course. I feel that “May you live in interesting times” is in a similar vein, and is more along the lines of a curse.
So, will our dear world leaders put up an action plan on the next G8 meeting so that by 2030 the global world temperature doesn’t drop by more then 2C?
I don’t think so!
Nogw (12:31:45) :
[i]Lance (11:49:59) :
the news media will be scrambling over each other to state they were the first to bring this to our attention
The best advice to the media:
Before it’s too late put someone, on a 24 hrs. shift , to read WUWT, so you’ll be informed in advance.[/i]
Probably wouldn’t do any good. Fox Business was hugely impressed yesterday about the discovery that the Earth was regularly bombarded by meteors (Killer Asteroid’s was the term used. Michio Kaku was being interviewed about it to pump his new book. Pretty amusing. http://glickreport.blogs.foxbusiness.com/2009/08/20/next-global-crisis-killer-asteroids/ .
No different really than CNN or any other news outlet. This sort of thing is “Sunday Supplement” stuff that just fills space between important things like who is screwing who, and was it any good.
The Oulu neutron count remains pegged at about 4.5% above the last solar minimum. (and is at a record high)
http://cosmicrays.oulu.fi/
A drop in either the Ap index or the radio flux back to their recent minimums would be significant.
http://www.swpc.noaa.gov/ftpdir/weekly/RecentIndices.txt
Ap Geomagnetic index
date Ap index
—— ——-
2003 05 26
…..
2008 08 5
2008 09 5
2008 10 6
2008 11 3
2008 12 2
2009 01 3
2009 02 4
2009 03 4
2009 04 4
2009 05 4
2009 06 5
2009 07 5
The 10.7 cm radio flux is up slightly similar to the Ap index
http://www.leif.org/research/TSI-SORCE-2008-now.png
James the Simple (12:39:37) : If you are a spaniard you are already living in the most interesting times, after Spain fell down in the hole of the “renewable energies” scam, so you electricity bill must reflect the consequences of such a leftist paradise. You’ll need the help of Don Quijote to tear down all those “windmills”, a product of a mad man imagination as any other “windmills of the mind”
On the El Nino scale, how does our current El Nino measure up?
Frank Mosher (12:02:07) :
John Finn. In the past you have indicated that you are an expert at predictions.
I don’t recall “indicating” any such thing.
ked5 (11:43:23) :
“the MSM won’t be nearly as culpable (though perhaps their crediblity will finally be destroyed) as James Hansen and Al the Goracle, or the various governments that are *pushing* the AGW lie.”
It is pretty difficult to delineate culpability between those who tell the lies and those who propagate them. Clearly people like Hansen, Mann, Gore and Pachauri are culpable and their comeuppance will be severe. However, if it wasn’t for the dearth of journalistic integrity within the MSM, these liars would have been exposed years ago. The BBC is a public entity and has a responsibility to accurately inform the public. If they’ve breached the public trust, then then those responsible should held to account in a court of law.
So, if this period causes cooling, is it delayed? I don’t see that much cooling.
Does anyone know for certian?
Or is this period of low activity keeping us from the hockey stick rise in temp?
I’ve been on a snipe hunt and the ones we got had no taste at all.
Just when we think we’ve got the universe figured out, it will spin a 180* on us.
Global warming is probably happening, regardless of those who are rooting for it to cool (therefor making the hypothesis false, etc. etc.).
We are best to let it go. Root for sensibility.
Your graph of solar irradiance is actually of solar irradiance variance, showing only that the sun’s radiance is very stable right now. Yes, irradiance is less, but that graph does not show it.
To E.M.Smith: The sun does indeed radiate about 6.6% stronger in Winter, every Winter — this is because Earth is closest to the Sun in January, when the total Solar disk area seen on the sky is about 6.6% larger than in July.
Michael (13:09:01)
The current El Nino is at the Cialis moment
Another view of the no-sunspot Sun http://photon-hunter.de/temp/astro/ISS-Transit-small-ann.jpg
Gary P (13:02:06) :
Old sun is in need of a cardiologist!
However, if we check Leifs graph we find that those pores were of SC23 magnetic signature. So I guess it means SC23 is ramping up again then 🙂
http://www.leif.org/research/TSI-SORCE-2008-now.png
KW (13:43:10) When cold pray to your Gaia Goddess [snip]
Anthony about time you came clean and admitted you have got climate change wrong.
The oceans are running warmest on record for summer, sea level is running at record highs for this time of year (not hiding behind a seasonal cycle), the satellite data would have been hottest were not for a large “correction” and this is all happening with a cold cold sun.
It’s got so warm out there even the “sceptics” are having trouble finding cold weather to talk about.
REPLY: Hah, doc, you make this too easy. Someday I’ll visit BoM and tell you all about it. I do find your demands amusing though, especially since it all turned on one month with the El Nino going from zero anomaly in UAH LT. Tell me, does climate happen in 1 month? 😉
Here’s a few to talk about at the water cooler at BoM.
http://latimesblogs.latimes.com/lanow/2009/08/las-cold-summer-continues-lancaster-posts-a-record-low-temperature.html
http://newsminer.com/news/2009/aug/21/fairbanks-flirts-frost-early-cold-weather-arrives/
http://www.nzherald.co.nz/business/news/article.cfm?c_id=3&objectid=10590529
I’m still pretty comfortable with my position. Time is on our side. Rant all you like. – Anthony
Historic records from the Little Ice Age show a regular appearance of hot summers followed by cold (very cold) winters.
You can find the historic records here:
http://www.booty.org.uk/booty.weather/climate/1800_1849.htm
Let’s see what the coming winter brings.
alan the brit, how much lower would those record cold temperatures have to go before they kill off those olive trees which people here in London have started to plant in their gardens in the last years? Would serve them right for counting on global warming wouldn’t it.
I would have to agree with (Clilverd et al 2006) projections for future solar activity since it is in a good agreement with my formula (Jan 2004)
http://xxx.lanl.gov/ftp/astro-ph/papers/0401/0401107.pdf
http://www.vukcevic.co.uk/combined.gif
but I am not certain that climatic downturn would be that severe.
I would suggest in addition to SSN and TSI numbers one might keep an eye on the Earth’s magnetic field as seen here:
http://www.vukcevic.talktalk.net/GeoMagField.gif
John Finn (10:11:10) :
VG (09:15:16) :
..I said he was wrong – not about the solar cycle length – but about the 2 deg decline in temperatures.
Yes 2 degrees cooling (over how much time?) seems as absurd a prediction as the warmers warming predictions. At the moment we are “pretty warm” “global averagely” speaking and the sea is warm.
No matter what about the solar cycle spotless days, the TSI is increasing from 5th July which was aphelion day, as we get closer to the sun. There doesnt seem to be much variation in TSI.
For example on the 14th of August the TSI was 1326.33 W/m^2 and last year (14th August 2008) TSI was 1326.51W/m^2. Just a wee bit less this year.
The solar wind is calm though and I wonder how that will pan out with relation to the temperature. Undoubtedly this should have an effect if the calm days last.
I keep an eye on the sea ice data. The Arctic melt seems to be slowing down, but I cant be sure. I wonder how accurate the IJIS data is? It seems to fluctuate wildly, couldnt possibly be fluctuating like that in reality. For example on the 1st and 2nd of June if it is to be believed Arctic ice grew by about 120,000 sq kms. This is obviously not true.
Also the ice-extent picture shows the approach to Gjoa Havn, for example, free of ice. As per the local charts/information it was supposed to have 20% coverage, but as per the people actually negotiating it ( Sprague Theobald’s blog), it had 90% coverage. The satellites are supposed to pick up upto 30% coverage and more, so one wonders.
Steven Hill (13:22:31) :
So, if this period causes cooling, is it delayed? I don’t see that much cooling.
Be patient, Steve, teh thermal time constant of the ocean is massive, and I reckon they cool more slowly than they warm.
Richard, Leif uses TSI measurements corrected for the elliptical orbit of the Earth, normalised to one astronomical unit.
What is more interesting is how the TSI differs across the spectrum.