The Solar and Heliospheric Observatory (SOHO) satellite is back in operation after some required downtime to keep it operating.
Alas, it didn’t miss anything, the sun remains spotless.

From Spaceweather.com
According to NOAA sunspot counts, the longest stretch of spotless suns during the current solar minimum was 52 days in July, August and Sept. of 2008. The current spate of blank suns is putting that record in jeopardy. There have been no sunspots for almost 42 days and there are none in the offing. Deep solar minimum continues.
Spotless Days
Current Stretch: 42 days
2009 total: 184 days (79%)
Since 2004: 695 days
Typical Solar Min: 485 days
There’s some contention over that claim, as WUWT readers may recall that SIDC in Belgium last year retroactively counted a sunspeck from a drawing by Catainia observatory, nullifying the stretch of sunspotless days in August 2008. NOAA’s SWPC appears not to recognize that sunspeck and so their claim is for a 52 day stretch.
Will SIDC pull another sunspeck stunt this August? I’m sure they are “poreing” over the sketches now.
Joe D’Aleo puts this current stretch in perspective:
Today, Thursday, August 20th marked the 41st straight day without a sunspot, one of the longest stretches this solar minimum.

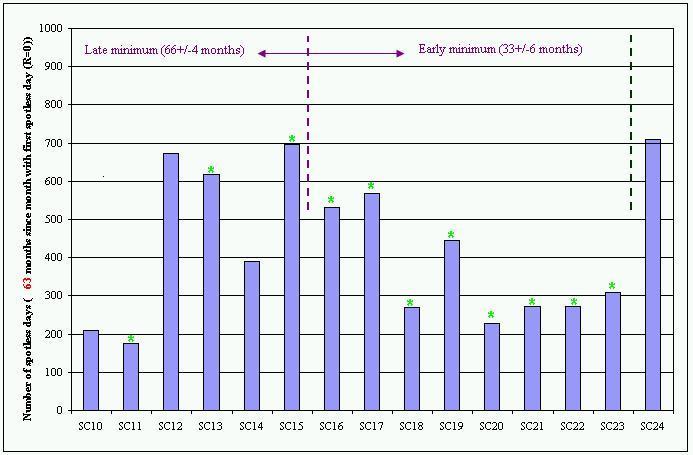
In fact it rises into 10th place among all spotless periods since 1849 (first table here). The total number of spotless days this transition from cycle 23 to 24 is now 694 rapidly approaching the approximate number leading into cycle 15 in the early 1900s (below, enlarged here).

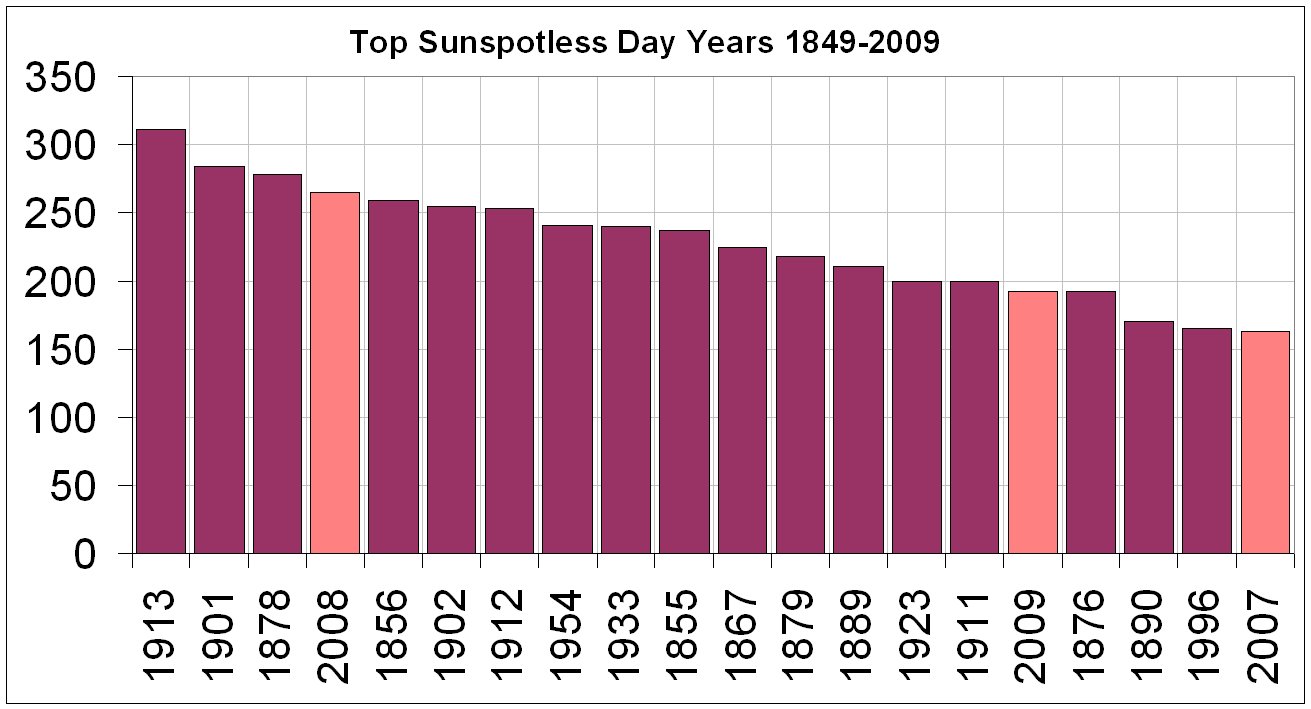
We have had 183 spotless days this year (79% of the days). We are in the top 20 years in 17th place. We will very likely rapidly rise up the list in upcoming weeks and rival 2008’s 265 days and likely end in the top 5 years. 2007, 2008, 2009 will only have 1911, 1912, 1913 in the top 20 as string of 3 per transition (below, enlarged here).

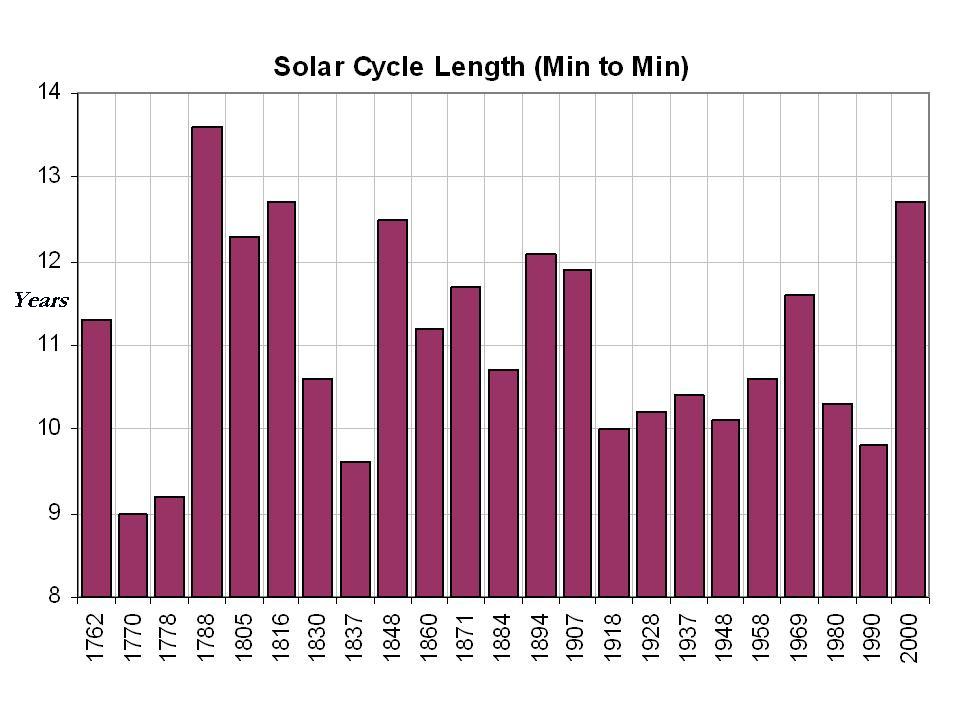
The cycle minimum probably was December, 2008. January 2009 13 month average came up a bit due to slight bump in activity in June and July but if August should end up sunspotless and September low, we could have a double bottom. The 12.7 years assuming December 2008 was longest in two centuries (below, enlarged here).

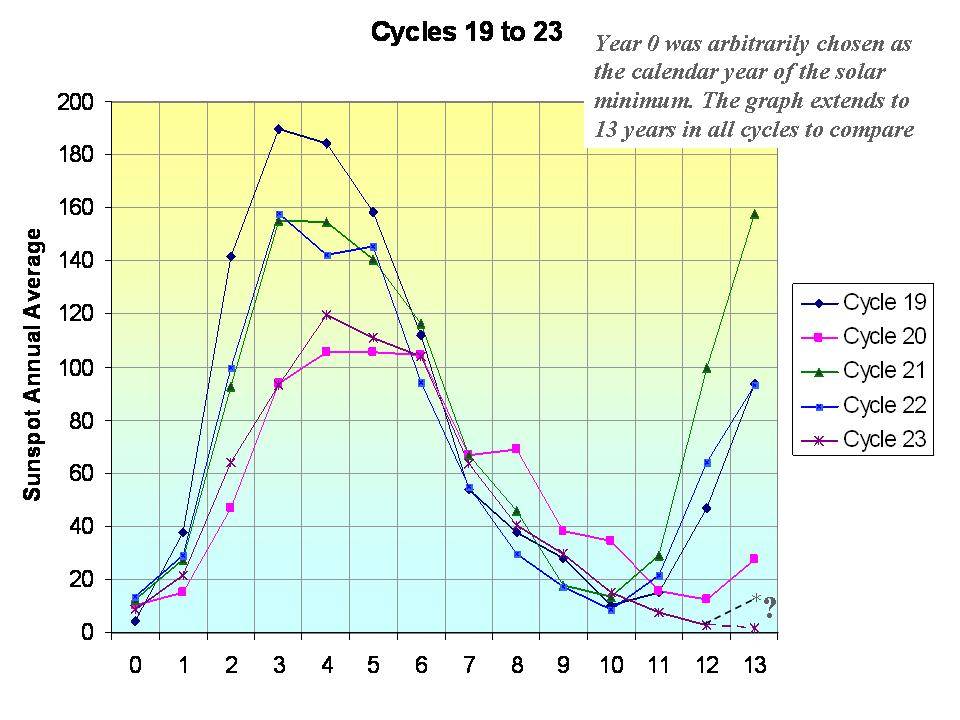
You can see on this chart, by 13 years after the solar minimum year, most of the last 5 cycles already had recovered, in one case already to the solar max (below, enlarged here).

This cycle has continued to decline in the solar irradiance, solar flux, sunspot number and geomagnetic activity after 10 years. On the following chart produced by Anthony Watts, you can see the Total Solar Irradiance declining whereas the prior cycle was rebounding(below, enlarged here).
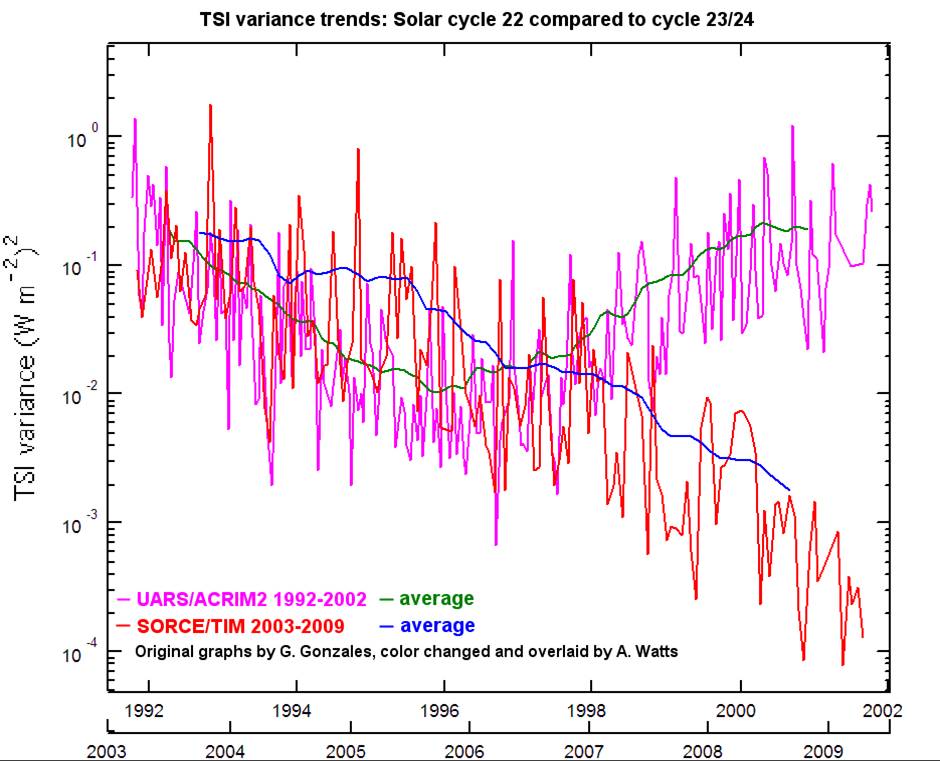

Clilverd et al 2006 suggests using a statistical analysis of the various cycles (11, 22, 53, 88, 105, 213, and 426 years) shows the next two cycles will likely be very quiet much like those of 200 years ago in the early 1800s, the so called Dalton Minimum, the time of Dickens (with snows and cold in London like last winter) (below, enlarged here).
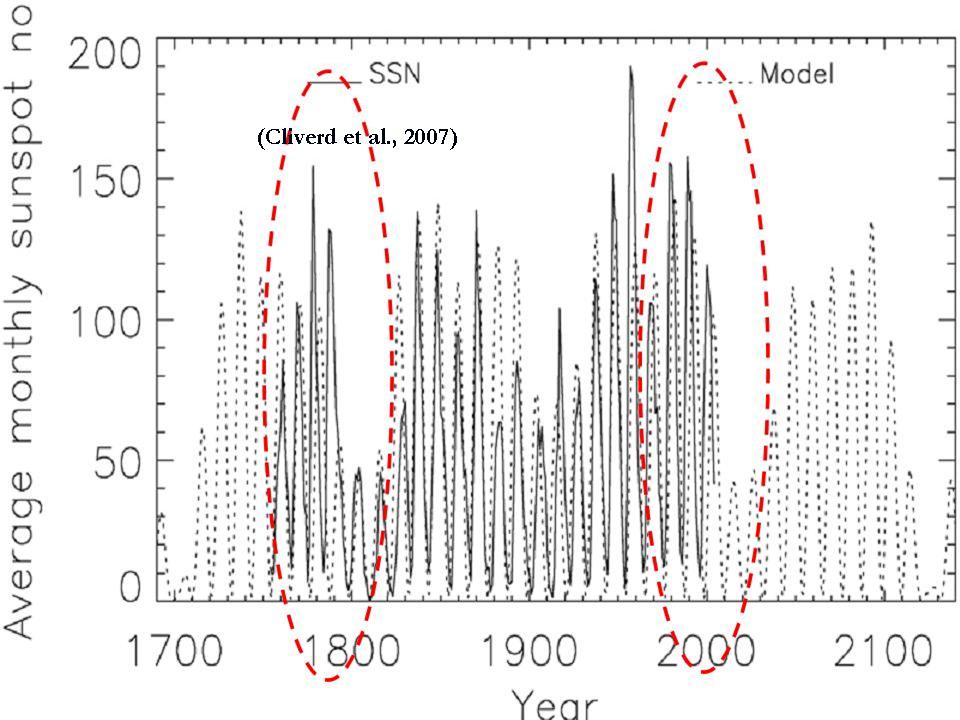

See what David Archibald shows what the result might be if Clilverd is correct here. Some have not ruled out an even stronger Maunder like Minimum. See more complete PDF here.
Discover more from Watts Up With That?
Subscribe to get the latest posts sent to your email.
the two spots on 23 and 30 july were seen only by Catania…
but Sidc count them…
Then, it is very probable that ‘ll repeat the same situation of the last year, when only Catania saw the spot and agust didn’t finish at 0 because Sidc counts it…
Catania, Catania, Catania…I apologize on behalf of the alls Italians, because for those who do not know, Catania is an Italian observatory …
SIDC has provisional sunspot counts on July 23 and 30. IOW, they’ve already proactively counted the specks, no need to go back and recount.
http://www.sidc.be/products/ri/
Less than a week to the big 700. Little over a week to go till a full calendar month. When is the hathaway prediction v15.7.0 coming out?
Folks. I’m a layman and follow this site regularly. I am fascinated by the postings and learn a great deal, but still frequently get lost in the science. I am indebted to you nonetheless for the education. I have a question that is simplistic and will betray my ignorance, but if someone could help me I’d appreciate it. What is the statistical point at which the solar minimum can be said to have ended and the next cycle begun?
Sunners, on whose beach I surf, would like nothing better than a solid link between TSI (or even spots) and climate, but until someone comes up with a clever Mannomatic RegEM PCA teleconnection, it just ain’t there.
Warmer is better, but if warmer means cap’n tax, I’ll go with cooler. Against all Leif’s logic, that dull-as-a-piece-of-grey-linoleum magnetogram gives me hope. Welcome
baskback SOHO.“crosspatch (09:19:03) :
But I am curious why Leif’s site shows are recent sunspot here while I don’t see any such spot listed at spaceweather.”
I am not surprised. Leif needs to show that his predictions will be correct.
The reason that you don’t see this on spaceweather is because there was no spot.
It was a tiny SC 23 magnetic signature that would not have been counted in 2001 solar max or even in 2006 when solar min began; let alone 200 years ago.
Once again bias has infiltrated science.
None of these tiny tims would have been counted had this minimum been “normal”.
Fact is, that this minimum is unusual and regardless of whether the pseudo-spots of the last two years have been counted fairly or not; SC 23 is now nearly 12.7 years long and thus the longest in 200 years.
Grand minimum looks more likely to occur with each passing day.
Remember:
1.In 2005 they said “We expect SC 24 to pick up at the end of 2006 and be record setting.”
2.In 2006 they said “We expect SC 24 to pick up by 2007.”
3.In 2007 they said “This minimum is not unusual, activity will pick up by March 2008.”
4.In March 2008 they said : “SC 23 has returned but SC 24 will pick up by the end of 2008”.
5.In November 2008 (International sunspot number 4.1) they said: “SC 24 has finally begun. We were right.”
6.Then December 2008 had an international sunspot number of 0.8, they said: “December was quiet, but minimum is over and SC 24 will be up and running by mid 2009.”
7.On 6th July 2009 a huge fuss was made about “the biggest spot in 2 years”, which didn’t make sense because the SC 23 sunspots of late March 2008 were much bigger.
8. It is now August 21st. The sunspot number so far, is a grand total of… Zero (0), but apparently Solar Minimum is over.
There were 3 pores in Late July/Early August and although invisible to most (clean) telescopes, this ‘clearly indicates’ that SC 24 is now ramping up.
Referring to my favorite graph…
http://users.telenet.be/j.janssens/Spotless/Spotless.html#Evolution
…we’re now above the SC16-23 two sigma line, so we’re definitely not in Kansas, anymore. We are, however, still within the one sigma envelope for SC10-15, so we’re not in OZ, either. Yet.
Keep watching the skies.
ok, no sunspots. then the “climate” should put up or shut up and get cold. I know it might take a while for the sun to truly affect our temperature and climate. But for the past 6 weeks according to UAH Channel 5 we continue to be very much above the 20 year average. Most of last month we were above the 20 year highs.
http://discover.itsc.uah.edu/amsutemps/
channel 5, draw graph.
A stronger minimum. I know what you mean, but perhaps we need better phrasing.
* Deeper solar depression
* Weaker sun
* Reduced sunlight
* Overly calm sun
* Weaker solar warming
* Colder
* Indoor summer season
* Even further below normal
Tom Trezise (11:09:04) – We don’t know when the new cycle begins until after we see increased activity on the Sun. From the magnetic polarity on sunspots we know that some of the new cycle has begun, but overall activity is still too low to confirm that the next cycle has started.
After all, if the Sun remains as quiet as it is for several more years and then a new cycle begins with the same magnetic polarity as the present cycle — it would generally be agreed that the cycle which we’re waiting for effectively did not happen. We simply can’t know the new cycle has begun until the Sun already has increased its measurable activity.
Just The Facts (09:47:45) :
I am most troubled by the fact that this deep solar minimum is getting minimal coverage in the mainstream media. If it wasn’t for the global warming narrative, this would be front page news. The world may be entering a period of potentially significant and extended cooling and much of the mainstream media refuses to report on it. If cooling leads to crop failures and food shortages, mainstream media outlets and their editors will be culpable for misleading the public and delaying study and preparations for this eventuality.
~~~~
the MSM won’t be nearly as culpable (though perhaps their crediblity will finally be destroyed) as James Hansen and Al the Goracle, or the various governments that are *pushing* the AGW lie.
Damn SUV’s driving around on the sun, spitting out all that co2. It has stopped the sun from working. We better tax it….
On a serious note, many have stated that these are interesting times. They certainly are, and if that sun doesn’t wake up, we could start the slow decent in temps, and the news media will be scrambling over each other to state they were the first to bring this to our attention…..
According to NOAA sunspot counts, the longest stretch of spotless suns during the current solar minimum was 52 days in July, August and Sept. of 2008. The current spate of blank suns is putting that record in jeopardy.
He better come to the plate swinging. God will just throw spitters low and outside to bust up the record. Never fails.
@ur momisugly Tom Trezise (11:09:04) :
“Folks. I’m a layman and follow this site regularly. I am fascinated by the postings and learn a great deal, but still frequently get lost in the science. I am indebted to you nonetheless for the education. I have a question that is simplistic and will betray my ignorance, but if someone could help me I’d appreciate it. What is the statistical point at which the solar minimum can be said to have ended and the next cycle begun? ”
That’s not a simple question. Depends a great deal on the “statistics” and data that went before, for the past 4.5 billion years, of which we have very fragmentary data. I would suggest that you conduct your own statistical analysis using your own data and assumptions, and/or trusted data from known sources. To help you in that, I’ll refer you to this book by Edwin Jaynes “PROBABILITY THEORY:
THE LOGIC OF SCIENCE” http://omega.albany.edu:8008/JaynesBook.html , and to this site for more of a primer in “Orthodox” methods of practical data collection and analysis. http://www.statsoft.com/textbook/stathome.html .
In addition to that, there are a number of physical laws that pertain that you’ll have to research and study, including nuclear physics. If anyone gives a point estimate of the probability of the “shift” I recommend that you ignore them.
Mr. Alex (11:22:03) : Your reasoning confirms that those scientists are in the pay of Big Al (not Big Oil), trying desesperately to demonstrate that 2+2 equals 1.5, or “it is not the sun stupid deniers; it’s CO2, our God, which shines above”
Hope Copenhaguen will frost…
John Finn. In the past you have indicated that you are an expert at predictions. The UAH lower troposphere anomaly peaked in April 1998 at .770. When exactly will that be exceeded? Thanks. fm
The current stretch is 42 for noaa and 22 for sidc (update 8/21/2009)
What, it was ruled an error?
With virtually no sunspots, it’s only a matter of time before the AGW’ers come up with a sunspot hockey stick graph. 🙂
SIDC= Solar Impaired Devotees Carbon
Michael (10:46:45) : “We live in interesting times. Is this a blessing or a curse?”
Yes. 🙂
There were 3 pores in Late July/Early August and although invisible to most (clean) telescopes, this ‘clearly indicates’ that SC 24 is now ramping up.
Has anyone here ever been on a snipe hunt?
crosspatch (09:19:03) :
But I am curious why Leif’s site shows are recent sunspot here while I don’t see any such spot listed at spaceweather.
~~~~~~~~~~~~~~~~~~~~~~~~~~~~~~~~~~~~~~~~~~~~
I can’t find the last two sunspots Leif shows. See
http://www2.nict.go.jp/y/y223/sept/swcenter/sunspot.html
Did these two cycle 23 spots each rapidly come and go on the backside, Leif?
crosspatch (09:19:03) :
But I am curious why Leif’s site shows are recent sunspot here while I don’t see any such spot listed at spaceweather.
I enquired of Leif about this and his reply was:
The official NOAA number will always be 11 or above. NOAA throws away spots that are too small or don’t last more than 12 hours, or are only seen by one observer. I at times keep those [but at half weight:
you’ll see that the points are at SSN=5 and not 11] if I judge that they were real, e.g. that F10.7 also went up or there was a small magnetic region. They show that there was SOME activity. In order not to confuse them with the official count, I make then only half [or less] the height.
Observatory: ALAMAGORDO
Obs. Time: 18.8 UT Seeing: Fair RSN: ///
No. Location Type Area Number of Spot
19 N16E22 Bxo(L) 10 2
So how exactly does the continuous rise in planetary CO2 rates cause the Sun to go dormant ? Thereis such obvious causality here . . .
What part of Al Gore’s film, book or training addresses this phenomenon ? When will the IPCC have a Conference to discuss this ?