By Joseph D’Aleo, AMS Fellow, CCM
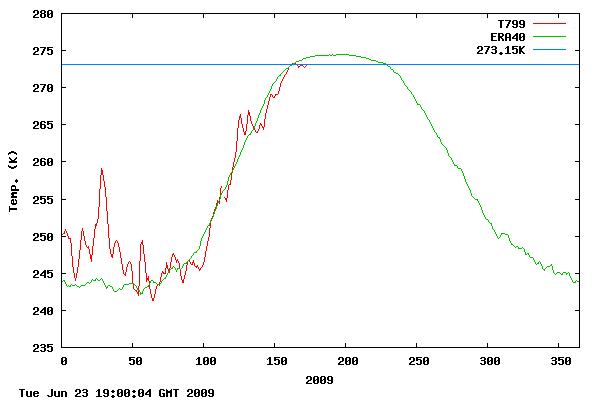
The average arctic temperature is still not above (take your pick) 32°F 0°C 273.15°K–this the latest date in fifty years of record keeping that this has happened. Usually it is beginning to level off now and if it does so, it will stay near freezing on average in the arctic leading to still less melting than last summer which saw a 9% increase in arctic ice than in 2007. H/T to FredM and MarcM

Data from DMI (Danish Meteorological Institute)
See larger image here. Compare with DMI charts in other years here.
[NOTE: as a second source to Joe’s article I’ve added this weather station data from the “North Pole Cam” operated by NOAA. Link is here: http://www.arctic.noaa.gov/gallery_np.html
There is a webcam at the “North Pole” (at least it starts out very near there) that reports via satellite data uplink at regular intervals. They also have a weather station with a once weekly data plot. Note it is still below zero centigrade there.

Latest data (updated approximately weekly) Readers should note that the station really isn’t at the north pole anymore due to significant ice drift. – Anthony ]
The AMSR-E shows the ice situation on June 23rd:

See where we stand relative to recent years in terms of total extent here. We are using JAXA-IJIS AMSR-E data to track ice as NSIDC is using older satellites and the new director Mark Serreze has proven untrustworthy. The next two months will be interesting. Temperatures usually begin flatlining in late June which would suggest less ice loss, although the water temperature beneath plays a key role and all of the warm water that entered the Arctic when the Atlantic was very warm in the middle 2000s (now is nearer normal) may not have circulated out yet.
The other question is what effect the early spring Mt. Redoubt eruptions may be having. Are the sulfate aerosols trapped in the arctic stratosphere reflecting back some of what sunlight reaches the high latitudes?

Along the edge of the arctic, Ross Hays who worked for CNN and then NASA who last year posted from Antartica sent this note to me “They have me working in arctic Sweden until mid July. One of the Esrange staff members told me that so far Kiruna had had the coldest June in 150 years!”
See PDF here.
TJA (17:29:57) : [quoting me saying] “a skeptic version of “how to answer a Climate Septic””
Why would we want a version of a set of rhetorical arguments designed to disguise the true issues, and containing false facts. Last time I checked, they were claiming that the climate never changed in Greenland during the MWP, despite the extensive contemporaneous writings on the subject from across Europe, not to mention ice core data.
I think their basic advice was to shout louder if you weren’t getting through to a skeptic. Maybe the site has improved, but I ain’t going back to find out.
TJA, I totally agree with you, perhaps I worded my post badly. I was being sarcastic to Phil but aiming to get him to respond, which he did. However, what I would genuinely like to see is web pages that systematically deconstruct at least ONE of the key sets of “answers to skeptics” web pages that warmists keep referring to. There is no systematic deconstruction except Warren Meyer’s Sceptical Layman’s Guide to AGW Chapter 9. But IMHO, Real Climate (info pages especially Responses to Common Contrarian Arguments), Skeptical Science, Coby Beck at Gristmill, New Scientist, Royal Society, and the Met Office all have “answers to skeptics” pages that deserve clear, simple, sourced, clinching answers from the skeptics’ community; IMHO this would seriously help us get taken seriously; IMHO this would help turn the tide and help throw out the abominable pending legislation.
Jim (12:01:16) :
Phil – here are some of the references from Moncton’s paper:
LORD MONCKTON
Global warming’ is No Global Crisis – Major Talking Points
Thursday, June 25th 2009, 4:37 PM EDT
Co2sceptic (Site Admin)
The warming effect of greenhouse gases is less than one-tenth the UN’s central estimate.
Spencer et al. (2008, cloud albedo); Douglass (2008, tropical mid-troposphere temperature change); Lindzen & Choi (2009 in press, outgoing long-wave radiation); and Armstrong, Green & Soon (2009 in press, zero-change benchmarking of climate forecasts) empirically confirm theoretical demonstrations (Schwartz, 2007; Monckton, 2008; Monckton & Evans, 2009 in draft) that climate sensitivity – the warming effect of all greenhouse gases, not just of CO2 – is less than one-fourth of the UN’s current central estimate. A CO2 doubling would cause just 1.5 F warming, not the 5.9 F imagined by the UN.
None of those are references, nowhere is there a bibliography telling us where they’re published or where we can read them. In any case of the 7, 3 are said to be in press or not yet drafted and of the remainder one is a reference to his own ‘work’. It’s just a list of unsubstantiated assertions.
The point bears repeating–
These low temperatures are UNPRECEDENTED —
in the past 50 yearas of recording –possibly longer–
and are supported fully by CURRENT
functioning US Army buoys
which likewise correlate and remain at or below 0 degrees C
(unless someonr clues the US Army to
start fudging)
http://imb.crrel.usace.army.mil/buoy_plots/met2009E.gif
http://imb.crrel.usace.army.mil/buoy_plots/met2009D.gif
http://imb.crrel.usace.army.mil/buoy_plots/met2009B.gif
http://imb.crrel.usace.army.mil/buoy_plots/met2009A.gif
and some 2008 buoys have sunk–
http://imb.crrel.usace.army.mil/buoy_plots/met2008C.gif
http://imb.crrel.usace.army.mil/buoy_plots/met2008B.gif
http://imb.crrel.usace.army.mil/buoy_plots/met2007J.gif
http://imb.crrel.usace.army.mil/buoy_plots/met2006C.gif
archived
http://imb.crrel.usace.army.mil/buoy_plots/met2008F.gif
all graphs from —
http://imb.crrel.usace.army.mil/buoysum.htm
(which also shows increased ice thickness
at 4 out 5 buoys)
compare with-
http://ocean.dmi.dk/arctic/meant80n.uk.php
Sorry, this report is complete rubbish (I bet). I’m not an expert, but there was something immediately fishy with the smoothness of temperature data for the early years of this 50 year period.
The reason (I think) is that the data is derived from weather models!
Prior to 2002, the data relies on the ERA40 reanalysis (putting all known data into a weather model and assuming the areas you don’t have data from are “average”). Hence some of the early years (eg. 1970) are so close to the mean over summer to be unrealistic.
Obviously, the satellite era brings in better observations of high latitudes, and so weather variability is more accurately reflected in the later years.
It is pretty poor that a weather expert can represent these results as “data” without explaining how they were derived.
if you actually want to see the Arctic melting: http://ice-map.appspot.com is updated daily.
noiv, that is way cool. All this handwringing over the Arctic melting as if some giant thing is standing over it with a blow torch. The alarmists are beginning to sound like a bad B movie complete with giant CO2 molecules taking the place of the giant ants. Anyone with a lick of sense knows that weather and water melts ice. We have no wind and very cold water and air temperatures in the Arctic circle. That ice ain’t goin nowheres.
Long time lurker here on this excellent educational site.
I notice today 2nd July that it still seems to be not above zero and appears to be at least a one in 50 year event.
The slow start to solarcycle24 also appears to be a 1 in 50 year event.
Could they be connected?
This is quite impressive:
Flanagan (01:58:17) :
Actually, this is exactly what is to be expected…
Melting is mainly due to contact with “hot” water, not melting from the top…
Flanagan (05:34:06) :
Thanks andy, sometimes I feel desperate in front of the certainty with which some people tend to affirm completely false stuff.
It’s been a while since I’ve seen the likes of that.
Do we have a Watts effect (or more precisely a Joe D’Aleo) effect? Since this was posted, Arctic temperatures have shot up close to their average. You need to quiet about announcing things like this lest the curse of Al Gore be upon you!
I am not a high caliber scientist.
My question concerns the the ocean’s salinity. In regards to municipalities storing large amounts of water(maybe we could even include those who have stored bottled water for emergencies) , could this have changed the salinity of the oceans and the thermal belt in the atlantic? I do know if i add salt to water it changes the temperature that it freezes and boils at( I add salt to ice to help freeze ice cream and salt to pasta water to cook it quicker).
First law of thermal dinamics: If i place an ice cube in a glass of water in a room, at room temp the ice cube will melt and the water will eventually become the temperature of the room. increase the temp of the water or temp of the room the ice melts faster. But, if i put an ice cube in a glass of saline solution at room temp what is the rate of melt? What does increasing or decreasing the salinity of the water do to the rate of melt.
Matter can neither be created or destroyed: If storing h2o affects the total available h20 on planet earth; the salt content in the oceans does not change however water levels do. Could this cause the oceans salinity to change or polar precipitation to change. I think if we have to factor el nino’s and volcano’s into the equation we have to factor everything before we pass things like cap and trade to control co2 emmisions….. maybe free the h20. 🙂
Global climate change is the new buzz word. It incompasses all thing climate and weather …..if you are hot today or cold tomorrow maybe there is a flood in your state or drought; it’s a great catch all phrase. No one has yet prove to me that I am the cause, cigarettes cause co2 emmisions not to mention cancer and heart disease but they are still legal . Heck people cause co2 emmisions by breathing. Plant more trees.
It seems the non believers have become quite cynical (myself included) about theories with no data to back them up. They “cherry pick” years to prove the CC religion. Some don’t include data after 2003. It’s 2009. Our legislators are about to pass a bill that will tax you on your co2 emisions based on incomplete and sometimes misrepresented data. Does anyone know how much co2 is produced making a Burger king flame broiled burger?
Does anyone remember methane emmisions(cow farts) causing this ?
http://sayanythingblog.com/entry/cow_emissions_more_harmful_to_the_environment_than_car_emissions/
however i recall some article in the news about this causing holes in the ozone, but that was before Al Gore invented the internet.
If MY thoughts on this are way off base please politely inform me that i don’t know my butt from a whole in the ground. I will accept that and move on. I am sure this is all high school physics to you gusy but I have questions. Could someone answer them?