By Joseph D’Aleo, AMS Fellow, CCM
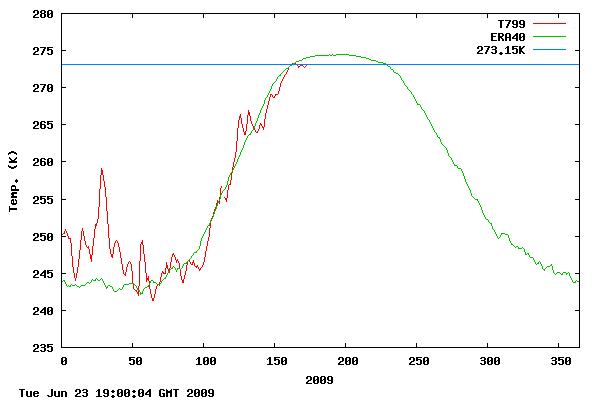
The average arctic temperature is still not above (take your pick) 32°F 0°C 273.15°K–this the latest date in fifty years of record keeping that this has happened. Usually it is beginning to level off now and if it does so, it will stay near freezing on average in the arctic leading to still less melting than last summer which saw a 9% increase in arctic ice than in 2007. H/T to FredM and MarcM

Data from DMI (Danish Meteorological Institute)
See larger image here. Compare with DMI charts in other years here.
[NOTE: as a second source to Joe’s article I’ve added this weather station data from the “North Pole Cam” operated by NOAA. Link is here: http://www.arctic.noaa.gov/gallery_np.html
There is a webcam at the “North Pole” (at least it starts out very near there) that reports via satellite data uplink at regular intervals. They also have a weather station with a once weekly data plot. Note it is still below zero centigrade there.

Latest data (updated approximately weekly) Readers should note that the station really isn’t at the north pole anymore due to significant ice drift. – Anthony ]
The AMSR-E shows the ice situation on June 23rd:

See where we stand relative to recent years in terms of total extent here. We are using JAXA-IJIS AMSR-E data to track ice as NSIDC is using older satellites and the new director Mark Serreze has proven untrustworthy. The next two months will be interesting. Temperatures usually begin flatlining in late June which would suggest less ice loss, although the water temperature beneath plays a key role and all of the warm water that entered the Arctic when the Atlantic was very warm in the middle 2000s (now is nearer normal) may not have circulated out yet.
The other question is what effect the early spring Mt. Redoubt eruptions may be having. Are the sulfate aerosols trapped in the arctic stratosphere reflecting back some of what sunlight reaches the high latitudes?

Along the edge of the arctic, Ross Hays who worked for CNN and then NASA who last year posted from Antartica sent this note to me “They have me working in arctic Sweden until mid July. One of the Esrange staff members told me that so far Kiruna had had the coldest June in 150 years!”
See PDF here.
evanmjones (12:18:15) :
“In any case, it would seem obvious from this trend that we are in absolutely no danger, whatever”
Here I fully agree with you. As a geologist I know very well that a warmer world with higher atmospheric CO2 can only be good for the biosphere.
Look at that:
http://www.arcus.org/search/seaiceoutlook/2009_outlook/report_june.php
Most models predict very small arctic sea ice extent (3 of 4 a smaller extant than 2008), heuristic models predict more ice than last year.
I assume that in September we have maybe the proof, that all of these stupid computer models are WORTH NOTHING
Heck, even a penny and you’d be richer than Midas!
evanmjones (12:18:15) :
O, I beg to differ. We are in terrible danger from Al Gore, Pelosi, Obama, the IPCC and so on and their global warming hysteria. That’s the trend we’re in danger of.
About this Global warming becoming Climate Change… 2 supplementary questions…
When was the IPCC set up?
What does the CC in IPCC stand for?
Answers: 1988 and Climate Change
It’s really interesting that starting in 2003, every year is mostly below average in the summer in the arctic mean temperature plots on the Danish site. http://ocean.dmi.dk/arctic/meant80n.uk.php
Just so you know, I easily understood the opening sentence. A moving type average of Arctic temps demonstrates that it is not warming up as quickly this year. And it may not period this year. We have passed the Summer Solstice June 21st. From here on out Summer days and Summer sun gets shorter. The only way we will get significant melt that equals previous years (IE 07 and 08) is if anomalous wind patterns blows the ice out. Given the HUGE and rather sudden downward trend in wind in the Arctic I suspect that that wind will not materialize.
Flanagan (10:25:04) :
Just to make sure, you meant this data set, right?
http://www.ijis.iarc.uaf.edu/seaice/extent/plot.csv
The data set that says the Ice extent on 6/24/09 is greater than the corresponding date in ’08,’07,’06 &’05?
Claiming 6/23/08 is what we should be comparing against is unsupportable data analysis unless you want to run the numbers all the way back to when we started (’78?). Anyway, it’s a irrelevant, as there have been only 19 days in the last 85 that the ice extent has been less than ’08, or 27 if you adjust for leap day as you seem to want to do.
Other interesting factoids from your data set.
Average Ice Extent for June to date is greater than the equivalent period in ’08,’07,’06 & ’05.
The April Ice extent decrease was less than ’08,’07,’06, ’05, ’04, & ’03.
Even with the “precipitous” decrease of April & May (really only May) there was still more ice extent on June 1st than the same date in ’07,’06, ’05 & ’04.
Also, with the exception of a about 10 days the ice decrease in April & May trends almost perfectly with the previous years, with it typically being much less.
Joe, an interesting side shoot off of this article would be a look see at the wind strength and patterns since 2002. Who turned the wind off???? Back up the finding with Arctic jet stream data of the same period and we will have a winner!
She aims, she shoots, she scores!
Mr Smith: well tried, but you won’t catch me misunderstanding thermodynamics. When ice melts, a lot of heat from oceans is used, which tends to cool sea surface temperatures. This, in turn, will in any case modify the flow of heat between water and air in the favor of liquid water. All in all, the surrounding atmopshere will tend to cool.
Scott: very interesting analysis. Do you realize the years you mention as references would have been considered as “anomalously low” only ten years ago?
Jack, if you’d investigate that you would soon find that it was actually the Republicans who forced this change in description.
George Bush did it. LOL
@ur momisugly AndyW35 (12:14:09) :
2008 saw more melting than 2007 because it was starting off from a lot higher extent value over winter.
Now Andy you forgot the warmist argument that the ice was thinner in 2008 than in 2007, remember? So go factor that into your calculation and get back to us on whether more or less ice was melted in 2008 and don’t forget to include leap year!
Anthony: There is a Naval Postgraduate School program called the Autonomous Ocean Flux Buoy Program which takes measurements in the arctic ocean under the ice cap. The link is here:
http://www.oc.nps.edu/~stanton/fluxbuoy/deploy/deploy.html
The raw data is available along with various plots. According to the website, the buoys “are designed to directly measure the turbulent fluxes of momentum, heat, and salt using the eddy-correlation technique.”
(But since it is Navy, maybe they track submarines too?)
Bob Kutz (10:48:36) :
I was being sarcastic.
LOL…. as was I, hence, the Hansen reference.
I agree with the rest of your response.
“All in all, the surrounding atmopshere will tend to cool.”
So if surface (air) temperatures in the arctic increase, that’s inconsistent with global warming, right? Right?
Sooooo . . . check me on this; warm water under ice, ice melts. This causes the air to cool.(Hmmm. . . .endothermic, you say). But, (scene 2) water’s not as warm, less ice melts, so the air cools a little less and is therefore warmer? (I think you are confusing endotherm, heat being converted in to chemical potential energy and heat transference . . . more heat down a larger gradient, and so forth).
Wouldn’t the air being in contact with the (presumably colder) ice cool more than the air in contact with the (necessarily warmer) water?
I am confused; You are saying you believe that the air is warmer, because it’s in contact with ice instead of water . . . is that really what you are saying?
To say it differently; The air was cooler because the warmer water melted more ice, but now the air is warmer because the surface of the ocean is colder and is frozen.
I think I’m beginning to understand where you AGW people are coming from; tell Alice I said hello.
And now I think I also understand why you think the first sentence is misleading. You might want to look up the definition of ‘average’. ( A definition is the words that tell you what the word you don’t know means).
And you might want to get your money back on your Intro to Therm. text and class. It didn’t work out too well for you. Check out the zeroth law, I think that really covers this scenario. Equilibrium and such.
But go on, tell me more about how coconuts migrate then.
Isn’t leap year just a reconciliation of the calendar to the natural cycle? 365.25 days a year? So it wouldn’t need to be corrected for, right? Or do the seasons operate on a calendar year, ignoring a quarter of a day until the fourth year? Miniscule argument anyway, but still.
brazil: what’s your problem with global warming? We’re only talking about some seasonal observation, right?
FWIW….
I live in Phoenix and this June has been the coolest/mildest June since 1913. We had a stretch of almost three weeks without going over 100. Unfortunately, it hasn’t lasted and things are back in triple digits
So if surface (air) temperatures in the arctic increase, that’s inconsistent with global warming, right? Right?
No. That would be climate change.
The ocean has some very interesting characteristics around the -2.0C to 1.5 temp range. Water is a very strange chemical. Most chemicals just become more and more dense as they get colder. Not water.
Here is the temp range for the lightest ocean water (always on-top) to the most dense ocean water (always on the bottom or in process of sinking to the bottom).
-2.0C and colder (frozen sea ice and always on-top).
+5.0C and warmer (after 5.0C, ocean water becomes lighter and lighter as it warms up and will always form the top layer other than sea ice).
-1.5C; not frozen but the lightest ocean water under 5.0C.
0.0C and 3.0C; more dense than -1.5C.
+1.5C; most dense salty ocean water and is either in the process of sinking or is already at the bottom of the ocean.
The polar ocean will stratify into these layers which makes it a strange beast in that it will always be on the verge of freezing since the ocean water on top will always be frozen or just warmer than -2.0C (except for the very height of the summer when the ocean can warm up to 0.0C or so and in those rare events in Earth history when the polar ocean warms to above +5.0C even in the cold six months of winter darkness season – otherwise it is always on the verge of freezing).
All that snow and cold is caused by global warming?
Big chill in Churchill Winter grips 90 per cent of north, migratory birds can’t breed
Recent late springs in the Hudson Bay area have been more frequent than normal: 2004, 2002, 2000 and 1997.
According to NOAA scientists, although the Arctic is warming, more frequent annual oscillations in temperature are likely to occur, often resulting in late springs.
“Such major oscillations are part of a bumpy ride toward global warming,” said Thomas Karl of the National Climate Center. “For awhile at least this will be the shape of things to come.”
http://www.winnipegfreepress.com/opinion/westview/big-chill-in-churchill-47992231.html
Kevin, Merrick, et al,
“Actually, we don’t say, “degrees Kelvin.” The Kelvin is a unit, not a degree, so it’s 273.15 K.”
Got no problem understanding that “kelvin” is a unit, not a scale. Not so sure about “Kelvin” (with upper case ‘K’). How do you read it? “273 Kelvin”? “273 kelvins”?
“273 kelvins Kelvin”? (by analogy with 32 degrees Fahrenheit)
John the Linguist not the Physicist
Flanagan (01:58:17) [his first post in this thread]
You do point to a scientifically-interesting component of the overall equilibrium-equation that would (if we could fully know it) determine the extent & survival of the Arctic Icecap. I.e., when ice melts, it absorbs heat from the environment.
Although it is true that exposed arctic water can release heat into the atmosphere, raising air-temperatures (as last year’s records appeared to document), the major melting mechanism(s) aren’t likely to conversely lower atmospheric temperatures. That’s because, as you point out, the melting occurs at the interface of the underside of the ice & the water, taking heat directly from the ocean – not the atmosphere.
But, for one, these are secondary, not the primary effects. Secondly, there is a cascading and ‘inbreeding’ series of such effects, bifurcating into ever more-minute components of the overall process, compared with the dominant effects. Bifurcating elements of the whole are not linearly additive, they are (vanishingly) logarithmic, and thus will never ‘conspire’ against the main factors. This is why water never jumps out of the glass (or ocean…), though by invoking random thermal motion of the molecules, one could (try to) make a case that it might, sometimes. [I do see a new Maxwell’s Demon story on PhysOrg.com, but haven’t read it yet …] It’s a case of chasing and putting too much weight on too small a part of the overall dynamic.
For example, what is the surface area of the underside of the ice? It is of course often/usually very much larger than the upper surface. What does this mean/why does this occur? It means that ice is both melting and forming on the under-surface, at the same time. It occurs because (among a myriad of factors) there has been salinity-differentiation within the ice-cake. Salinity-‘tears’ & ducts provide penetration-paths for the warmer ocean-water, once they become exposed at the bottom. There arises a micro-thermohaline convection just under the ice (often, within the fluid mechanic “boundary layer”), which sets up circulation-circuit (similar to galvanic corrosion), eating into (higher-freezing/melting) saltier ice in some points, chilling adjacent water & ice at other points, and depositing new (lower-freezing/melting) normal-salinity ice nearby.
The underside of the ice thus becomes a bizarre landscape of hanging stalactites, sheets & curtains, honeycombs, recesses, pitting … amounting to orders of magnitude more surface area than on the surface. Add to that the far greater thermal capacity of water than air, and the role of the atmosphere in transacting the endothermy of melting is much reduced.
For another example, the thermal properties & structure of ocean waters are not homogenous. The existence of well-known large-scale thermohaline dynamics makes this clear even to the consumer public. Within the ocean water column there are commonly layers or sheets or interfaces with sharp thermal or other density gradients. Sounds that enter or occur within these thin layers can undergo lossless refraction at the upper & lower boundaries resulting in transmission across oceanic distances (a phenomenon directly analogous to fiber optics communication).
These discontinuity-layers within the ocean are barriers to all normal macro-mixing mechanisms. They are part of what ‘sets up’ large thermohaline potentials. They also mean that much of the heat of the Arctic Ocean will be unavailable to help melt the ice, because the water has been compartmentalized into non-mixing zones. The structure of an ocean always acts to reduce the rate and amount of circulation that would cause it to be more homogenized. In the case of melting the icecap, it means 1.) that much of the thermal energy that enters the Arctic will never gain access to the ice, and 2.) that the water near the ice is will generally be colder than the average temperature of the ocean.
“Great fleas have little fleas upon their backs to bite ’em,
And little fleas have lesser fleas, and so ad infinitum.
And the great fleas themselves, in turn, have greater fleas to go on;
While these again have greater still, and greater still, and so on.”
~~ Augustus De Morgan
To my eye, the most telling proxy for predicting whether the Arctic icecap is going to recede dramatically is the U.S. military posture & policy in the north polar region – a first-order strategic & security concern. The Navy knows more about conditions under the ice than NASA can even guess at. Military satellites render NASA’s obsolete by 15-20 years. If the Pentagon’s understanding of the Arctic Ocean indicated to them that a major trend toward seasonally open waters was in the offing, I believe that our (and the Russian’s) activities & relationships (i.e., with Canada et al) would be an easily-discernable give-away.
The Pentagon has a laison embedded in the White House who consults & advises the President every single day. How often does Obama sit down with NASA? In fact, he studiously & assiduously ignores NASA like the plague. It’s the Pentagon who knows, who has access to the Man … and they don’t seem concerned about the icecap. Ergo, I’m not either.
The Pentagon has, however, published concerns about global cooling.